In 1990, China was the world’s 11th largest economy in nominal GDP terms at $397 Billion USD.
And when using $PPP dollars (which is an attempt to better reflect the cost of living in a country) it was still only the world’s 7th largest economy at $992 Billion.
Yet by 2025 it has become the second largest to the United States in nominal GDP terms at $20 Trillion USD and the largest in $PPP terms at $40 Trillion.
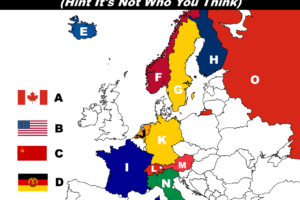
The maps below show’s China’s nominal GDP relative to the 10 economies that were larger than it was in nominal GDP terms in 1990 (plus Australia).
They show the difference in size between them in 1990, the year they roughly become equal, and finally the difference in size in 2025. Full data is at the bottom of the page.
11. Australia

10. Brazil

9. Spain

8. Iran

7. Canada

6. Italy

5. UK

4. France

3. Germany

2. Japan

1. United States

China vs USA in PPP Dollars

Bonus UK vs India

I also thought it would be fun to look at India vs the UK. In 1990 India’s nominal GDP was $321 Billion ($948 Billion in PPP) compared to the UK’s $1.2 Trillion nominal ($1.1 Trillion PPP).
By 2025, India’s nominal GDP was $4.3 Trillion or a massive $17.3 Trillion in PPP terms. This makes it the world’s 5th largest in nominal terms and 3rd largest in PPP terms.
The UK in contrast has a nominal GDP of $3.7 Trillion today or $4.4 Trillion in PPP terms. Making it the 6th largest in nominal terms and 10th largest in PPP terms.
Finally here’s a really crazy stat. In 1995 Japan’s Nominal GDP was larger than all the rest of Asia’s $5.5T vs $4.19T but in 2025 it’s GDP is now smaller than just four Chinese provinces: Jiangsu, Shanghai, Zhejiang, and Fujian.

The data for all countries mentioned:
| Country | 1990 GDP (Nominal) Millions $USD | 2025 GDP (Nominal) Millions $USD | Nominal % Increase | 1990 GDP (PPP) Millions $ | 2025 GDP (PPP) Millions $ | PPP Increase |
|---|---|---|---|---|---|---|
| United States | $5,963,125 | $30,337,162 | 409% | $5,963,125 | $30,337,162 | 409% |
| Japan | $3,185,904 | $4,389,326 | 38% | $2,405,271 | $6,767,661 | 181% |
| Germany | $1,604,497 | $4,921,563 | 207% | $1,744,029 | $6,174,688 | 254% |
| France | $1,260,874 | $3,283,429 | 160% | $1,143,554 | $4,485,437 | 292% |
| United Kingdom | $1,197,021 | $3,730,261 | 212% | $1,053,961 | $4,424,658 | 320% |
| Italy | $1,164,328 | $2,459,597 | 111% | $1,242,121 | $3,691,249 | 197% |
| Canada | $596,089 | $2,330,308 | 291% | $567,292 | $2,692,053 | 375% |
| Iran | $581,008 | $434,243 | -25% | $312,425 | $1,782,265 | 470% |
| Spain | $536,322 | $1,731,469 | 223% | $633,395 | $2,771,523 | 338% |
| Brazil | $455,335 | $2,188,419 | 381% | $922,224 | $4,890,950 | 430% |
| China | $396,590 | $19,534,894 | 4826% | $992,248 | $39,438,111 | 3875% |
| Australia | $324,124 | $1,802,006 | 456% | $317,065 | $1,973,284 | 522% |
| India | $320,979 | $4,271,922 | 1231% | $947,830 | $17,364,809 | 1732% |
Note all data comes from the IMF via Wikipedia.
Have any countries grown faster than China?
Since 1990 China’s economic growth has been unprecedented in human history.
It has lifted more than 800 million people out of poverty, that’s more the entire population of every country in Europe.
In PPP terms China grew its economy 3,875%.
Only Equatorial Guinea (for very different reasons) outpaced them at 18,834%.
The next closest were Guyana 3,281%, Cambodia 2,237%, Ethiopia 2070%, Qatar 2,053% and Vietnam 2,003%.
However, in nominal terms there are a few more countries that outpaced China. Here are all countries that grew at least 2,000% in Nominal terms between 1990 and 2025.
- Armenia (from 1992): $108 Million → $27 Billion – 24,509%
- Croatia (from 1992): $568 Million → $96 Billion – 16,806%
- Kazakhstan (from 1992): $2.9 Billion → $307 Billion – 10,565%
- Equatorial Guinea: $133 million → $13 Billion – 9,613%
- Azerbaijan (from 1992) $1.2 Billion → $77 Billion – 6,358%
- Vietnam: $8.2 Billion → 506 Billion – 6,063%
- Cambodia: $898 million → $51 Billion – 5,597%
- Turkmenistan (from 1992): $1.6 Billion → $91 Billion – 5,511%
- China: $397 Billion → $19.5 Trillion – 4,826%
- Tajikistan (from 1992): $291 Million → $14 Billion – 4,767%
- Georgia (from 1994): $850 million → $36 Billion – 4,124%
- Nicaragua: $519 Million → $21 Billion – 3,938%
- Qatar: $6.3 Billion → $226 Billion – 3,510%
- Guyana: $685 Million → $24 Billion – 3,474%
- Maldives: $231 Million → $7.6 Billion – 3,208%
- Russia (from 1992): $71.6 Billion → $2.2 Trillion – 2,967%
- Uzbekistan (from 1992): $4.5 Billion → $127 Billion – 2,746%
- Latvia (from 1992): $1.7 Billion → $48.1 Billion – 2,743%
- Estonia (from 1993): $1.8 Billion → $45 Billion – 2,430%
- Moldova (from 1992): $864 million → $19.6 Billion – 2,174%
Nominal vs PPP GDP
Nominal GDP
Definition:
Nominal GDP measures the total value of goods and services produced by a country, using current market prices and currency exchange rates.
Pros:
- Simple & widely used: Easily comparable at current market exchange rates.
- Timely: Data availability and ease of calculation make it useful for immediate comparisons.
- Reflects international economic power: Better reflects the influence countries have in global trade and finance, as it uses actual currency exchange rates.
Cons:
- Price level differences ignored: Doesn’t account for differences in cost of living or inflation across countries.
- Exchange rate volatility: Sensitive to fluctuations in currency values, making comparisons unstable over time.
Purchasing Power Parity (PPP) GDP
Definition:
PPP GDP adjusts for price differences between countries, allowing GDP to reflect actual purchasing power within each economy.
Pros:
- More accurate standard of living comparisons: Reflects actual living standards and purchasing power within countries.
- Stable comparisons over time: Not directly influenced by short-term currency fluctuations.
Cons:
- Less intuitive: Calculations involve assumptions and estimation, making it harder to interpret quickly.
- Data limitations: Quality, availability, and comparability of data can be problematic, making precise estimates challenging.
- Ignores global market power: Doesn’t reflect a country’s actual economic clout on international markets.
Credit for flag maps:
Which one surprised you the most?


Leave a Reply