Brilliant Maps

Making Sense Of The World, One Map At A Time

  • BOOK!
  • Newsletter
  • Games & Quizes
  • Map Based Polls
  • Map Tools

Probability of a White Christmas Across The United States

Last Updated: March 30, 2026 1 Comment

Click To Get My 10 Best Brilliant Maps For Free:

Probability of a White Christmas Across The United States

Map created by NOAA at climate.gov

Given how popular the Probability of a White Christmas Across Europe map turned out to be, we were happy to find that the National Oceanic and Atmospheric Administration has created a similar map for the United States.

The map simply shows the historic odds of there being more than 1 inch of snow on the ground on December 25th across the United States and is not a prediction for this year.

Unsurprisingly, the probability increases the closer you are to Canada and the higher your elevation, with both the Rocky and Sierra Nevada mountain ranges clearly visible on the map.

Want a white Christmas but live in an area that’s unlikely to get any snow? Then the following may help:

  • White Christmas
  • Christmas Snow Globe with LED Light Musical Snowflakes
  • Instant Snow Powder – Makes 4 Gallons of Fake Snow

And as a fun extra map here’s the probability of a White Easter:
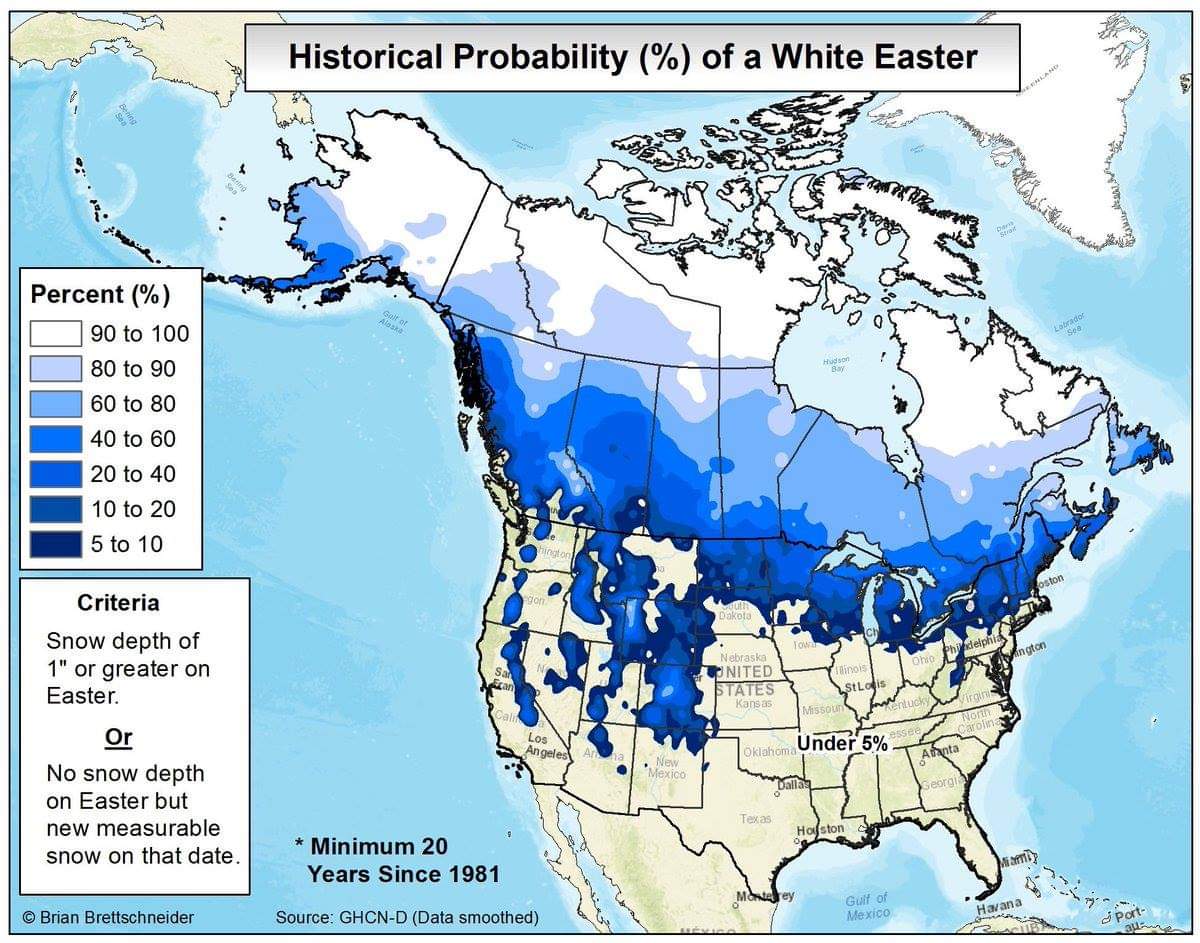
probability of a White Easter

Map credit Brian Brettschneider

Enjoy this post? Then please help us by sharing it with a friend:

Filed Under: United States Tagged With: weather

Click To Get My 10 Best Brilliant Maps For Free:


Other Popular Maps

  • Where Does Assembling IKEA Furniture Cause the Most Stress?

    Where Does Assembling IKEA Furniture Cause the Most Stress?

  • Global 5G Coverage Availability Map By County

    Global 5G Coverage Availability Map By County

  • 12 Ways To Divide The UK: From Accent To Religion

    12 Ways To Divide The UK: From Accent To Religion

  • I’ve Been To Canada

    I’ve Been To Canada

  • Animation Showing Peak-Hour New York City MTA Subway Services

    Animation Showing Peak-Hour New York City MTA Subway Services

  • Size Comparison of Roman & Ottoman Empires At Their Peak

    Size Comparison of Roman & Ottoman Empires At Their Peak

  • Map of The Most Commonly Spoken Languages In Toronto Other Than English

    Map of The Most Commonly Spoken Languages In Toronto Other Than English

  • Who Contributes & Who Receives Money From The EU Budget

    Who Contributes & Who Receives Money From The EU Budget

Comments

  1. Peter Hardy says

    December 15, 2015 at 1:32 pm

    What about Alaska and Hawaii? 100 and 0% respectively?

    Reply

Leave a Reply Cancel reply

Your email address will not be published. Required fields are marked *

This site uses Akismet to reduce spam. Learn how your comment data is processed.


Product Reviews · World Atlas · Map Posters · Settlers of Catan · Risk · Game of Thrones · Coloring Books · Globes · Monopoly · Star Wars · Game of Life · Pandemic · Ticket To Ride · Drinks Cabinets
Size Comparisons · US Locations · Flight Maps · Fleet Management
Copyright © 2026 · Privacy Policy · Fair Use, Attribution & Copyright · Contact Us
Follow Us: Newsletter · Facebook · Youtube · Twitter · Threads · BlueSky · LinkedIn · Instagram · Pinterest · Flipboard