
The map above shows the huge difference in the size of the UK vs Japan’s highspeed rail networks in 1963 compared to 2025.
Given the UK’s invented passenger railways it seems even more strange. So why is the UK network’s so small compared to Japan’s?
The UK’s Stockton and Darlington Railway (25 miles; 40km long) opened in 1825 as the first passenger railway anywhere in the world.
And according to the Institution of Civil Engineers
“Allowing for stops, the first train to run on the S&DR averaged a speed of 8mph (13km/h) on its inaugural journey.”
It also cost £5.1m (in today’s money) and took only 3 years to complete.
Thus 2025, is the 200th anniversary of the existence of passenger rail.
At that time, the Tokugawa shogunate (Edo period) still ruled Japan, which remained more or less closed off to the rest of the world. And wouldn’t start opening up until it was forced to do so by the Americans from 1853.
Japan wouldn’t open it’s first railway line from Tokyo to Yokohama until 1872 almost 50 years after the UK.
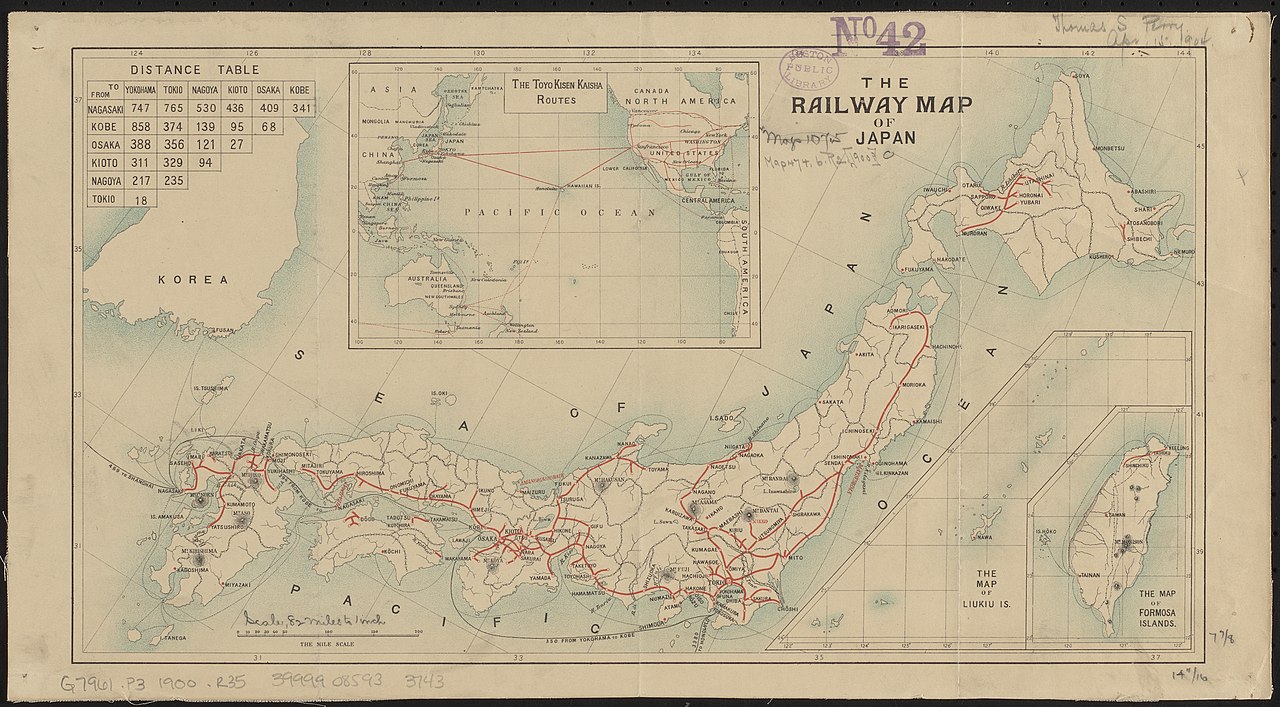
Here’s a map of Japan’s railway network in 1900:
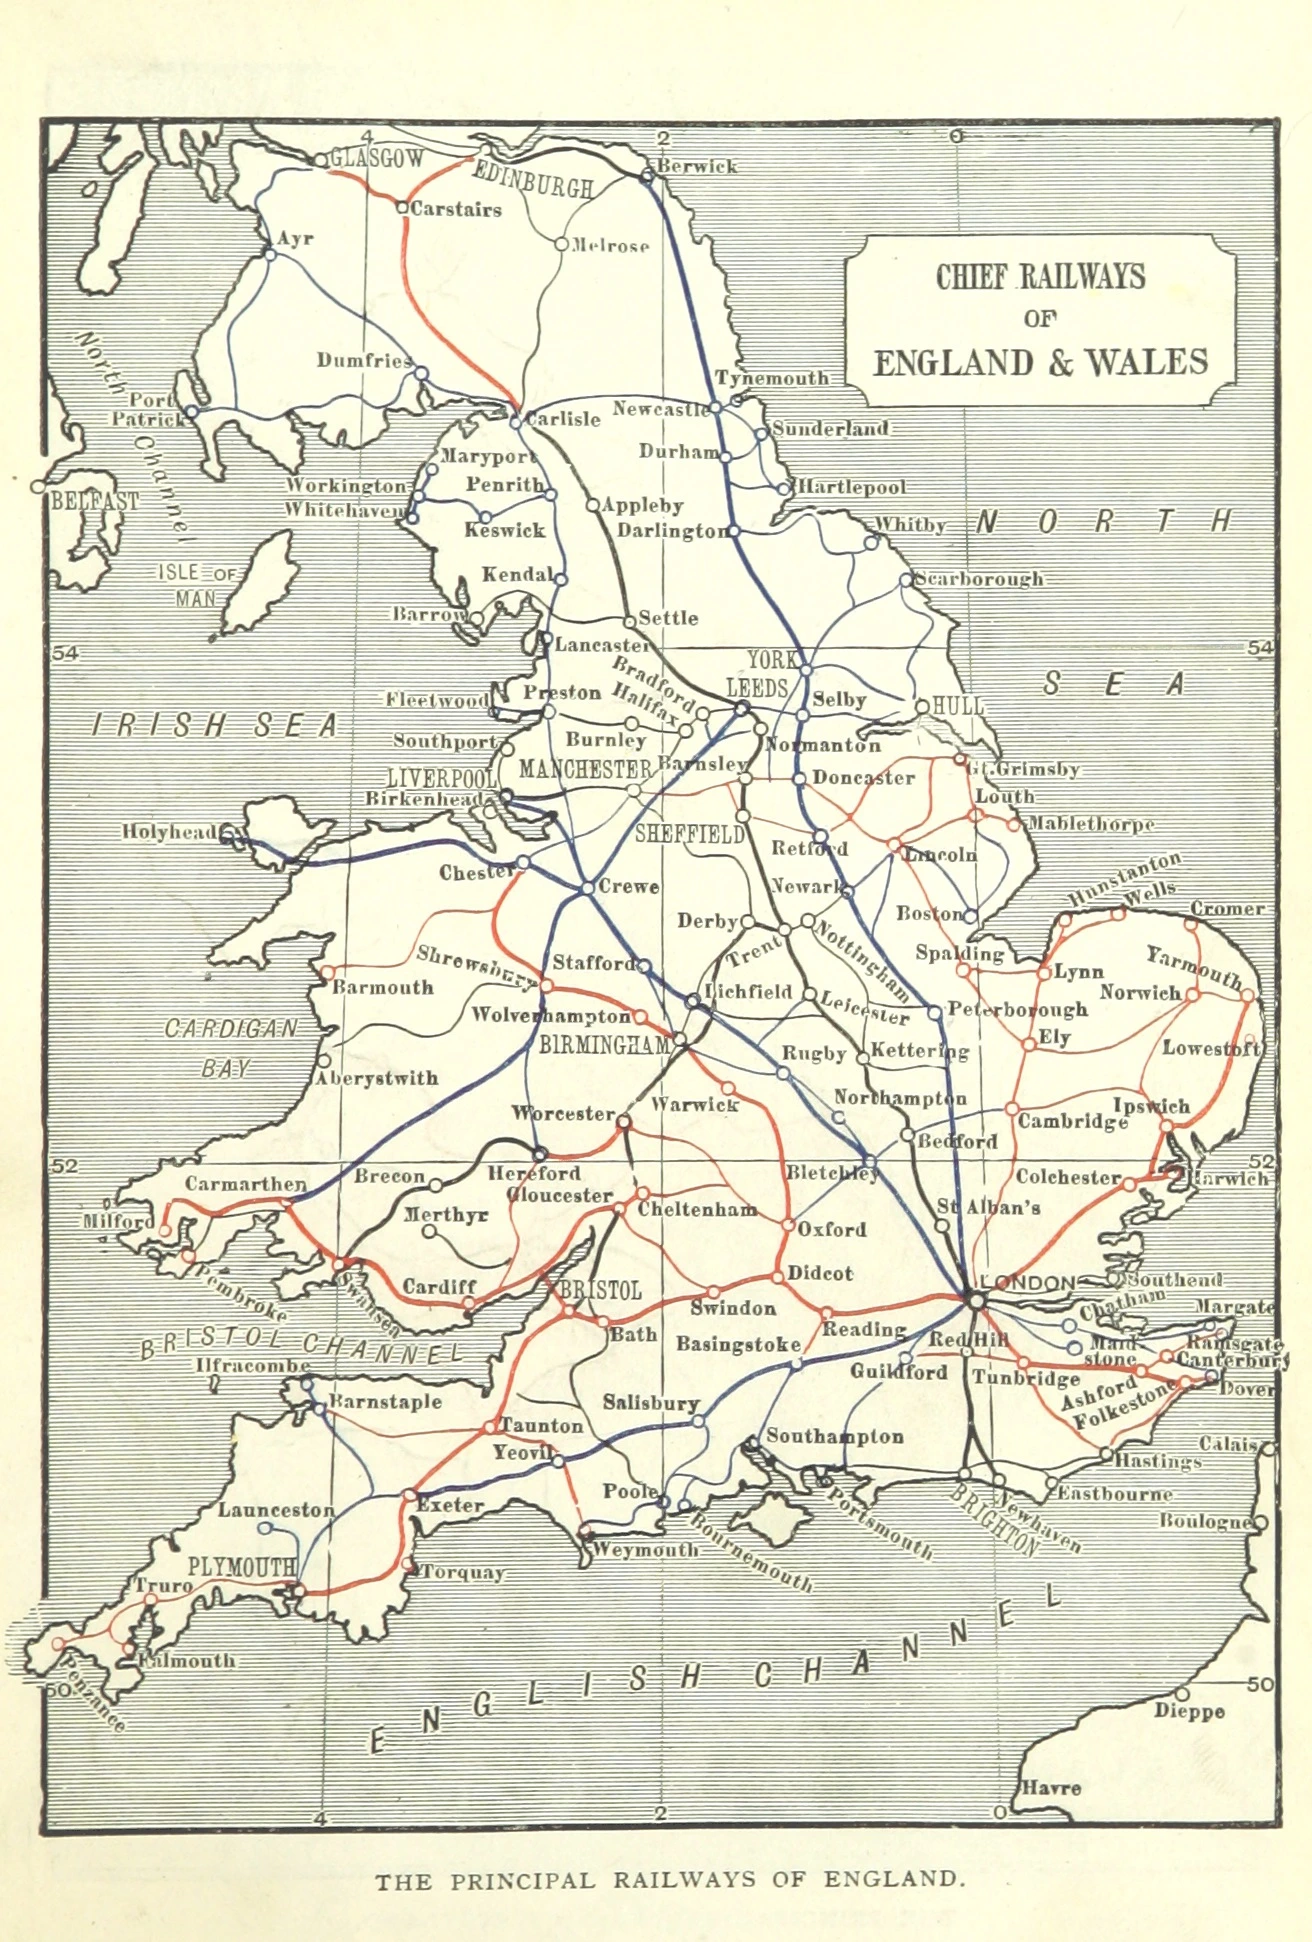
and here are the main passenger railways in just England and Wales in 1898:
However, despite it’s early lead in rail and the fact it was on the winning side in World War 2, it was Japan and not the UK which opened the first highspeed rail line.
The Tokaido Shinkansen debuted in 1964 at 515.4 km (320.3 mi) in length, nearly 13x longer than the Stockton and Darlington Railway.
And according to Business Insider:
“On October 1 that same year, the line was officially opened, with the first train, Hikari 1, traveling from Tokyo to Shin-Osaka with a top speed of 210 km/h (130 mph).”
Around 16x faster than the OG S&DR.
And it cost around 380bn Yen in 1964. This works out to around 1.8 trillion Yen in 2024 or £9.3 billion 2024 GBP.
The UK’s only operational High Speed 1 (HS1) line opened in 2007 and cost £6.84 billion (in 2007 pounds; £11.3 billion in 2025), but runs only 109.9-kilometre (68.3-mile) from London to the Channel Tunnel or around 1/5th of the distance as the Tokaido Shinkansen.
Trains run at speeds of up to 300 km/h (190 mph) and is estimated to carry around 19 million passengers per year between Eurostar and Javelin services.
Contrast that with the current Japanese Shinkansen network:
| Line | Start | End | Operating speed | Length | Opened | Passengers (2023) |
|---|---|---|---|---|---|---|
| Tōkaidō Shinkansen | Tokyo | Shin-Osaka | 285 km/h (177 mph) | 515.4 km (320 mi) | 1964 | 160,705,000 |
| San'yō Shinkansen | Shin-Osaka | Hakata | 300 km/h (186 mph) | 553.7 km (344 mi) | 1972–1975 | 70,301,000 |
| Tōhoku Shinkansen | Tokyo | Shin-Aomori | 320 km/h (199 mph) | 674.9 km (419 mi) | 1982–2010 | 81,547,000 |
| Jōetsu Shinkansen | Ōmiya | Niigata | 275 km/h (171 mph) | 269.5 km (167 mi) | 1982 | 39,776,000 |
| Hokuriku Shinkansen | Takasaki | Tsuruga | 260 km/h (162 mph) | 470.6 km (292 mi) | 1997–2024 | 30,308,000 |
| Kyushu Shinkansen | Hakata | Kagoshima-Chūō | 260 km/h (162 mph) | 256.8 km (160 mi) | 2004–2011 | 16,089,000 |
| Nishi Kyushu Shinkansen | Takeo-Onsen | Nagasaki | 260 km/h (162 mph) | 66.0 km (41 mi) | 2022 | |
| Hokkaido Shinkansen | Shin-Aomori | Shin-Hakodate-Hokuto | 260 km/h (162 mph) | 148.8 km (92 mi) | 2016 | 1,401,000 |
As for the UK’s HS2: “By February 2023, a total of £24.7bn had been spent.” With estimates of the total cost easily toping £50bn despite the reduced scope.
So why is the UK so bad at high-speed rail?
The UK’s limited high-speed rail development compared to Japan by 2025, despite pioneering passenger railways in the early 19th century, results from many factors:
1. Historical Infrastructure and Early Success
- Early Leader’s Dilemma: Because Britain built the world’s first extensive rail network in the early to mid-19th century, it inherited a dense network with winding alignments and limited clearances, mostly designed for slower steam trains. Upgrading these to high-speed rail standards requires significant demolition, tunneling, or completely new lines, greatly increasing complexity and cost.
- Legacy Infrastructure: Many UK railway lines are already heavily used for commuting and freight, leaving little room for the introduction of high-speed trains without substantial disruption to existing services.
2. Geographical Factors
- Urban Density and Geography: The UK is geographically smaller, densely populated, and highly urbanized. Compared to Japan—which has densely populated but elongated urban corridors that lend themselves naturally to long-distance, high-speed travel—the UK’s geography means cities are often closely spaced. Shorter distances between major urban areas reduce the relative time-saving advantages of high-speed rail, meaning marginal benefits are often perceived as less significant compared to the large upfront costs.
3. Political and Institutional Factors
- Short-termism and Political Instability: The UK’s political climate has historically exhibited frequent shifts in policies and priorities, resulting in a lack of continuity necessary for long-term infrastructure investment. Projects like HS2 (High Speed 2) have been repeatedly scaled back, delayed, or redesigned, partly due to political controversy and budgetary debates.
- Planning and Legal Obstacles: The UK’s planning laws, property rights, and local governance systems make large infrastructure projects more challenging and slower to implement compared to centralized systems like Japan’s. Public consultations, appeals, environmental inquiries, and litigation processes in Britain can prolong major projects by decades.
4. Economic Factors and Cost Constraints
- High Construction Costs: Britain’s construction costs, especially tunnelling and urban infrastructure, have significantly increased due to high labour costs, stringent safety and environmental standards, complex planning processes, and property acquisition expenses. This has raised the financial barriers, causing frequent political reassessments and cancellations.
- Funding Priorities and Budget Competition: In the UK, investment priorities frequently shift, with healthcare, education, and road infrastructure often politically favored over expensive rail projects. By contrast, Japan has maintained consistent public funding and support for high-speed rail, with a strong political consensus recognizing its critical importance to economic competitiveness.
5. Cultural and Social Attitudes
- Car-Centric Society: The UK developed strong automotive infrastructure post-World War II, leading to deep-rooted car dependency. This reduced political urgency to invest significantly in rail. In Japan, limited space, high population density, and less practical car usage promoted rail development as an efficient and practical transport choice.
- Public Acceptance and Nimbyism: In the UK, significant opposition from residents (often referred to as the “not-in-my-backyard,” or NIMBY phenomenon) has greatly delayed infrastructure projects. This social dimension has posed fewer obstacles in Japan, where the public traditionally accepts government infrastructure decisions more readily.
6. Private Ownership and Fragmentation
- Privatization of UK Railways: The UK’s privatization of rail infrastructure and operations from the 1990s onward led to fragmentation, complex regulatory environments, and competing commercial interests, all complicating the integration and coordination needed to build comprehensive high-speed networks. Japan, though partly privatized, still maintains robust governmental control over strategic infrastructure investment decisions.
What do you think? Why does the UK do so badly at high-speed rail, not only compared to Japan, but many countries in Europe as well.
Additional Sources:


Leave a Reply