
Majority/plurality ethnicities indicated by color and also includes counties and larger regional subdivisions.
In 1910, the Kingdom of Hungary was the other half of the Austro-Hungarian Empire, holding significant political autonomy under the Dual Monarchy system established in 1867.
It played a crucial role in the empire’s economy, contributing to industrial production and agricultural output, while also serving as a cultural and political counterbalance to Austria.
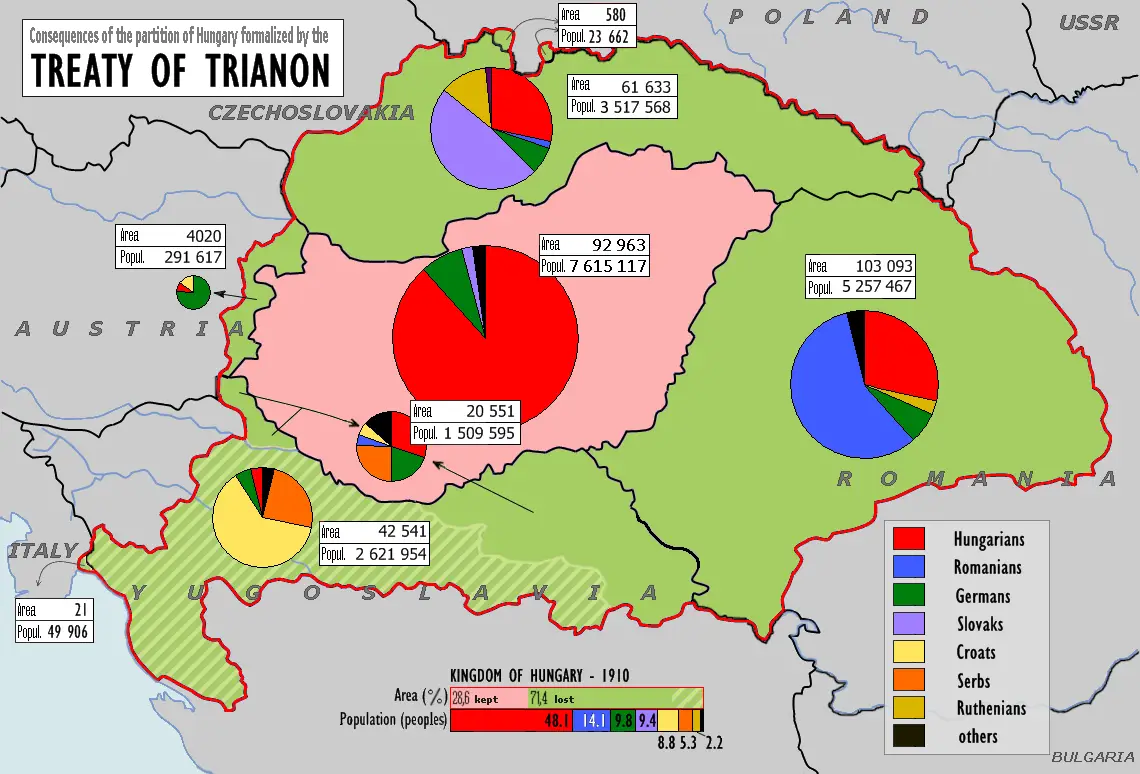
However, it was far from being a state only for Hungarians as the detailed breakdown by county below shows:
Here are the numbers entire area under the Hungarian crown, which included both the Kingdom of Hungary and also Croatia-Slavonia:
Total Population: 20,886,487
- Hungarians: 10,050,575 (48.1%)
- Germans: 2,037,435 (9.8%)
- Slovaks: 1,967,970 (9.4%)
- Romanians: 2,949,032 (14.1%)
- Ruthenians: 472,587 (2.3%)
- Croatians: 1,833,162 (8.8%)
- Serbians: 1,106,471 (5.3%)
- Other: 469,255 (2.2%)
| Danube Right Bank | Hungarian | German | Slovak | Romanian | Ruthenian | Croatian | Serbian | Other | Total |
|---|---|---|---|---|---|---|---|---|---|
| Baranya County | 199,659 (56.6%) | 112,297 (31.9%) | 392 (0.1%) | 54 (0.0%) | 5 (0.0%) | 10,159 (2.9%) | 13,048 (3.7%) | 16,864 (4.8%) | 352,478 (11.4%) |
| Fejér County | 218,822 (87.3%) | 24,265 (9.7%) | 4,359 (1.7%) | 37 (0.0%) | 5 (0.0%) | 333 (0.1%) | 814 (0.3%) | 2,035 (0.8%) | 250,670 (8.1%) |
| Győr County | 132,991 (97.6%) | 2,023 (1.5%) | 609 (0.4%) | 17 (0.0%) | 2 (0.0%) | 109 (0.1%) | 17 (0.0%) | 527 (0.4%) | 136,295 (4.4%) |
| Komárom County | 178,473 (88.4%) | 12,517 (6.2%) | 8,105 (4.0%) | 486 (0.2%) | 145 (0.1%) | 237 (0.1%) | 32 (0.0%) | 1,855 (0.9%) | 201,850 (6.5%) |
| Moson County | 33,006 (34.9%) | 51,997 (55.0%) | 735 (0.8%) | 5 (0.0%) | 7 (0.0%) | 8,123 (8.6%) | 2 (0.0%) | 604 (0.6%) | 94,479 (3.1%) |
| Somogy County | 333,597 (91.2%) | 18,718 (5.1%) | 364 (0.1%) | 63 (0.0%) | 4 (0.0%) | 9,934 (2.7%) | 44 (0.0%) | 3,237 (0.9%) | 365,961 (11.9%) |
| Sopron County | 141,011 (49.7%) | 109,160 (38.5%) | 397 (0.1%) | 33 (0.0%) | 4 (0.0%) | 31,004 (10.9%) | 15 (0.0%) | 1,886 (0.7%) | 283,510 (9.2%) |
| Tolna County | 189,521 (70.9%) | 74,376 (27.8%) | 789 (0.3%) | 39 (0.0%) | 4 (0.0%) | 343 (0.1%) | 1,102 (0.4%) | 1,085 (0.4%) | 267,259 (8.7%) |
| Vas County | 247,985 (56.9%) | 117,169 (26.9%) | 288 (0.1%) | 14 (0.0%) | 48 (0.0%) | 16,230 (3.7%) | 23 (0.0%) | 54,036 (12.4%) | 435,793 (14.1%) |
| Veszprém County | 199,063 (86.6%) | 29,283 (12.7%) | 917 (0.4%) | 41 (0.0%) | 5 (0.0%) | 55 (0.0%) | 17 (0.0%) | 395 (0.2%) | 229,776 (7.4%) |
| Zala County | 347,167 (74.4%) | 3,889 (0.8%) | 233 (0.0%) | 44 (0.0%) | 3 (0.0%) | 91,909 (19.7%) | 56 (0.0%) | 23,032 (4.9%) | 466,333 (15.1%) |
| Total | 2,221,295 (72.0%) | 555,694 (18.0%) | 17,188 (0.6%) | 833 (0.0%) | 232 (0.0%) | 168,436 (5.5%) | 15,170 (0.5%) | 105,556 (3.4%) | 3,084,404 (14.8%) |
| Danube Left Bank | Hungarian | German | Slovak | Romanian | Ruthenian | Croatian | Serbian | Other | Total |
| Árva County | 2,000 (2.5%) | 1,518 (1.9%) | 59,096 (75.0%) | 8 (0.0%) | 1 (0.0%) | 1 (0.0%) | 1 (0.0%) | 16,120 (20.5%) | 78,745 (3.6%) |
| Bars County | 62,022 (34.7%) | 17,366 (9.7%) | 97,824 (54.8%) | 11 (0.0%) | 92 (0.1%) | 12 (0.0%) | 8 (0.0%) | 1,165 (0.7%) | 178,500 (8.2%) |
| Esztergom County | 73,418 (80.8%) | 9,455 (10.4%) | 7,520 (8.3%) | 14 (0.0%) | 5 (0.0%) | 88 (0.1%) | 12 (0.0%) | 305 (0.3%) | 90,817 (4.2%) |
| Hont County | 73,215 (55.3%) | 6,417 (4.8%) | 51,522 (38.9%) | 71 (0.1%) | 7 (0.0%) | 19 (0.0%) | 18 (0.0%) | 1,172 (0.9%) | 132,441 (6.1%) |
| Liptó County | 4,365 (5.0%) | 2,591 (3.0%) | 78,098 (89.9%) | 222 (0.3%) | 25 (0.0%) | 11 (0.0%) | 1 (0.0%) | 1,593 (1.8%) | 86,906 (4.0%) |
| Nógrád County | 197,670 (75.6%) | 3,143 (1.2%) | 58,337 (22.3%) | 33 (0.0%) | 4 (0.0%) | 52 (0.0%) | 36 (0.0%) | 2,242 (0.9%) | 261,517 (12.0%) |
| Nyitra County | 100,324 (21.9%) | 27,937 (6.1%) | 324,664 (71.0%) | 39 (0.0%) | 13 (0.0%) | 81 (0.0%) | 26 (0.0%) | 4,371 (1.0%) | 457,455 (21.0%) |
| Pozsony County | 163,367 (41.9%) | 53,822 (13.8%) | 166,017 (42.6%) | 81 (0.0%) | 42 (0.0%) | 1,934 (0.5%) | 31 (0.0%) | 4,456 (1.1%) | 389,750 (17.9%) |
| Trencsén County | 13,204 (4.3%) | 9,029 (2.9%) | 284,770 (91.7%) | 172 (0.1%) | 24 (0.0%) | 78 (0.0%) | 51 (0.0%) | 3,109 (1.0%) | 310,437 (14.3%) |
| Turóc County | 5,560 (10.0%) | 10,993 (19.7%) | 38,432 (69.0%) | 27 (0.0%) | 44 (0.1%) | 4 (0.0%) | 3 (0.0%) | 640 (1.1%) | 55,703 (2.6%) |
| Zólyom County | 16,509 (12.4%) | 2,124 (1.6%) | 113,294 (84.8%) | 26 (0.0%) | 136 (0.1%) | 14 (0.0%) | 13 (0.0%) | 1,537 (1.1%) | 133,653 (6.1%) |
| Total | 711,654 (32.7%) | 144,395 (6.6%) | 1,279,574 (58.8%) | 704 (0.0%) | 393 (0.0%) | 2,294 (0.1%) | 200 (0.0%) | 36,710 (1.7%) | 2,175,924 (10.4%) |
| Danube-Tisza | Hungarian | German | Slovak | Romanian | Ruthenian | Croatian | Serbian | Other | Total |
| Bács-Bodrog County | 363,518 (44.7%) | 190,697 (23.5%) | 30,137 (3.7%) | 386 (0.0%) | 10,760 (1.3%) | 1,279 (0.2%) | 145,063 (17.9%) | 70,545 (8.7%) | 812,385 (21.6%) |
| Csongrád County | 319,274 (98.1%) | 2,862 (0.9%) | 646 (0.2%) | 773 (0.2%) | 11 (0.0%) | 94 (0.0%) | 1,235 (0.4%) | 673 (0.2%) | 325,568 (8.6%) |
| Heves County | 277,378 (99.2%) | 800 (0.3%) | 972 (0.3%) | 91 (0.0%) | 30 (0.0%) | 42 (0.0%) | 23 (0.0%) | 364 (0.1%) | 279,700 (7.4%) |
| Jász-Nagykun-Szolnok County | 372,423 (99.6%) | 639 (0.2%) | 450 (0.1%) | 206 (0.1%) | 14 (0.0%) | 32 (0.0%) | 43 (0.0%) | 157 (0.0%) | 373,964 (9.9%) |
| Pest-Pilis-Solt-Kiskun County | 1,728,473 (87.4%) | 162,824 (8.2%) | 47,149 (2.4%) | 3,357 (0.2%) | 306 (0.0%) | 3,419 (0.2%) | 7,934 (0.4%) | 24,579 (1.2%) | 1,978,041 (52.5%) |
| Total | 3,061,066 (81.2%) | 357,822 (9.5%) | 79,354 (2.1%) | 4,813 (0.1%) | 11,121 (0.3%) | 4,866 (0.1%) | 154,298 (4.1%) | 96,318 (2.6%) | 3,769,658 (18.0%) |
| Tisza Right Bank | Hungarian | German | Slovak | Romanian | Ruthenian | Croatian | Serbian | Other | Total |
| Abaúj-Torna County | 156,668 (77.4%) | 6,520 (3.2%) | 36,067 (17.8%) | 127 (0.1%) | 378 (0.2%) | 63 (0.0%) | 21 (0.0%) | 2,444 (1.2%) | 202,288 (11.4%) |
| Bereg County | 113,090 (47.8%) | 20,722 (8.8%) | 1,123 (0.5%) | 215 (0.1%) | 100,918 (42.7%) | 54 (0.0%) | 12 (0.0%) | 477 (0.2%) | 236,611 (13.4%) |
| Borsod County | 281,874 (97.2%) | 2,379 (0.8%) | 4,115 (1.4%) | 293 (0.1%) | 174 (0.1%) | 70 (0.0%) | 44 (0.0%) | 965 (0.3%) | 289,914 (16.4%) |
| Gömör és Kis-Hont County | 109,994 (58.5%) | 2,930 (1.6%) | 72,232 (38.4%) | 80 (0.0%) | 21 (0.0%) | 88 (0.0%) | 8 (0.0%) | 2,745 (1.5%) | 188,098 (10.6%) |
| Sáros County | 18,088 (10.4%) | 9,447 (5.4%) | 101,855 (58.3%) | 321 (0.2%) | 38,500 (22.0%) | 15 (0.0%) | 2 (0.0%) | 6,392 (3.7%) | 174,620 (9.9%) |
| Szepes County | 18,658 (10.8%) | 38,434 (22.2%) | 97,077 (56.2%) | 532 (0.3%) | 12,327 (7.1%) | 65 (0.0%) | 145 (0.1%) | 5,629 (3.3%) | 172,867 (9.8%) |
| Ung County | 53,824 (33.2%) | 8,383 (5.2%) | 36,364 (22.4%) | 133 (0.1%) | 61,711 (38.1%) | 82 (0.1%) | 8 (0.0%) | 1,584 (1.0%) | 162,089 (9.2%) |
| Zemplén County | 193,794 (56.5%) | 9,749 (2.8%) | 92,943 (27.1%) | 209 (0.1%) | 39,033 (11.4%) | 49 (0.0%) | 7 (0.0%) | 7,410 (2.2%) | 343,194 (19.4%) |
| Total | 945,990 (53.5%) | 98,564 (5.6%) | 441,776 (25.0%) | 1,910 (0.1%) | 253,062 (14.3%) | 486 (0.0%) | 247 (0.0%) | 27,646 (1.6%) | 1,769,681 (8.5%) |
| Tisza Left Bank | Hungarian | German | Slovak | Romanian | Ruthenian | Croatian | Serbian | Other | Total |
| Békés County | 219,261 (73.4%) | 6,048 (2.0%) | 66,770 (22.4%) | 6,125 (2.1%) | 4 (0.0%) | 17 (0.0%) | 76 (0.0%) | 409 (0.1%) | 298,710 (11.5%) |
| Bihar County | 365,642 (56.6%) | 3,599 (0.6%) | 8,457 (1.3%) | 265,098 (41.0%) | 211 (0.0%) | 156 (0.0%) | 122 (0.0%) | 3,016 (0.5%) | 646,301 (24.9%) |
| Hajdú County | 251,918 (99.2%) | 1,044 (0.4%) | 118 (0.0%) | 376 (0.1%) | 25 (0.0%) | 23 (0.0%) | 76 (0.0%) | 283 (0.1%) | 253,863 (9.8%) |
| Máramaros County | 52,964 (14.8%) | 59,552 (16.6%) | 503 (0.1%) | 84,510 (23.6%) | 159,489 (44.6%) | 41 (0.0%) | 6 (0.0%) | 640 (0.2%) | 357,705 (13.8%) |
| Szabolcs County | 316,765 (99.0%) | 868 (0.3%) | 1,117 (0.3%) | 212 (0.1%) | 194 (0.1%) | 15 (0.0%) | 7 (0.0%) | 640 (0.2%) | 319,818 (12.3%) |
| Szatmár County | 268,385 (67.7%) | 6,670 (1.7%) | 425 (0.1%) | 119,760 (30.2%) | 114 (0.0%) | 66 (0.0%) | 27 (0.0%) | 1,185 (0.3%) | 396,632 (15.3%) |
| Szilágy County | 87,312 (37.9%) | 816 (0.4%) | 3,727 (1.6%) | 136,087 (59.1%) | 52 (0.0%) | 5 (0.0%) | 6 (0.0%) | 2,135 (0.9%) | 230,140 (8.9%) |
| Ugocsa County | 42,677 (46.5%) | 4,632 (5.0%) | 37 (0.0%) | 9,750 (10.6%) | 34,415 (37.5%) | 4 (0.0%) | 1 (0.0%) | 239 (0.3%) | 91,755 (3.5%) |
| Total | 1,604,924 (61.8%) | 83,229 (3.2%) | 81,154 (3.1%) | 621,918 (24.0%) | 194,504 (7.5%) | 327 (0.0%) | 321 (0.0%) | 8,547 (0.3%) | 2,594,924 (12.4%) |
| Tisza-Maros | Hungarian | German | Slovak | Romanian | Ruthenian | Croatian | Serbian | Other | Total |
| Arad County | 124,215 (30.0%) | 38,695 (9.3%) | 5,451 (1.3%) | 239,755 (57.9%) | 677 (0.2%) | 70 (0.0%) | 2,138 (0.5%) | 3,387 (0.8%) | 414,388 (19.3%) |
| Csanád County | 108,621 (74.8%) | 1,013 (0.7%) | 17,133 (11.8%) | 14,046 (9.7%) | 119 (0.1%) | 8 (0.0%) | 3,967 (2.7%) | 341 (0.2%) | 145,248 (6.8%) |
| Krassó-Szörény County | 33,787 (7.2%) | 55,883 (12.0%) | 2,908 (0.6%) | 336,082 (72.1%) | 2,351 (0.5%) | 319 (0.1%) | 14,674 (3.1%) | 20,143 (4.3%) | 466,147 (21.8%) |
| Temes County | 79,960 (16.0%) | 165,883 (33.1%) | 3,080 (0.6%) | 169,030 (33.7%) | 30 (0.0%) | 350 (0.1%) | 69,905 (14.0%) | 12,597 (2.5%) | 500,835 (23.4%) |
| Torontál County | 128,405 (20.9%) | 165,779 (26.9%) | 16,143 (2.6%) | 86,937 (14.1%) | 11 (0.0%) | 4,203 (0.7%) | 199,750 (32.5%) | 13,923 (2.3%) | 615,151 (28.7%) |
| Total | 474,988 (22.2%) | 427,253 (19.9%) | 44,715 (2.1%) | 845,850 (39.5%) | 3,188 (0.1%) | 4,950 (0.2%) | 290,434 (13.6%) | 50,391 (2.4%) | 2,141,769 (10.3%) |
| Transylvania | Hungarian | German | Slovak | Romanian | Ruthenian | Croatian | Serbian | Other | Total |
| Alsó-Fehér County | 39,107 (17.6%) | 7,269 (3.3%) | 184 (0.1%) | 171,483 (77.4%) | 8 (0.0%) | 8 (0.0%) | 18 (0.0%) | 3,541 (1.6%) | 221,618 (8.3%) |
| Beszterce-Naszód County | 10,737 (8.4%) | 25,609 (20.0%) | 37 (0.0%) | 87,564 (68.5%) | 213 (0.2%) | 11 (0.0%) | 6 (0.0%) | 3,666 (2.9%) | 127,843 (4.8%) |
| Brassó County | 35,372 (35.0%) | 29,542 (29.2%) | 184 (0.2%) | 35,091 (34.7%) | 18 (0.0%) | 19 (0.0%) | 22 (0.0%) | 951 (0.9%) | 101,199 (3.8%) |
| Csík County | 125,888 (86.4%) | 1,080 (0.7%) | 85 (0.1%) | 18,032 (12.4%) | 188 (0.1%) | 13 (0.0%) | 3 (0.0%) | 431 (0.3%) | 145,720 (5.4%) |
| Fogaras County | 6,466 (6.8%) | 3,236 (3.4%) | 55 (0.1%) | 84,436 (88.7%) | 20 (0.0%) | 5 (0.0%) | 3 (0.0%) | 953 (1.0%) | 95,174 (3.6%) |
| Háromszék County | 123,518 (83.4%) | 617 (0.4%) | 202 (0.1%) | 22,963 (15.5%) | 144 (0.1%) | 15 (0.0%) | 14 (0.0%) | 607 (0.4%) | 148,080 (5.5%) |
| Hunyad County | 52,720 (15.5%) | 8,101 (2.4%) | 1,024 (0.3%) | 271,675 (79.9%) | 606 (0.2%) | 195 (0.1%) | 140 (0.0%) | 5,674 (1.7%) | 340,135 (12.7%) |
| Kis-Küküllő County | 34,902 (30.1%) | 20,272 (17.5%) | 31 (0.0%) | 55,585 (47.9%) | 1 (0.0%) | 4 (0.0%) | 2 (0.0%) | 5,294 (4.6%) | 116,091 (4.3%) |
| Kolozs County | 111,439 (38.9%) | 8,386 (2.9%) | 169 (0.1%) | 161,279 (56.3%) | 13 (0.0%) | 55 (0.0%) | 44 (0.0%) | 5,302 (1.8%) | 286,687 (10.7%) |
| Maros-Torda County | 134,166 (61.1%) | 8,312 (3.8%) | 79 (0.0%) | 71,909 (32.7%) | 174 (0.1%) | 33 (0.0%) | 25 (0.0%) | 4,891 (2.2%) | 219,589 (8.2%) |
| Nagy-Küküllő County | 18,474 (12.4%) | 62,224 (41.8%) | 63 (0.0%) | 60,381 (40.6%) | 6 (0.0%) | 57 (0.0%) | 4 (0.0%) | 7,617 (5.1%) | 148,826 (5.6%) |
| Szeben County | 10,159 (5.7%) | 49,757 (28.1%) | 154 (0.1%) | 113,672 (64.3%) | 205 (0.1%) | 84 (0.0%) | 95 (0.1%) | 2,795 (1.6%) | 176,921 (6.6%) |
| Szolnok-Doboka County | 52,181 (20.7%) | 6,902 (2.7%) | 42 (0.0%) | 189,443 (75.2%) | 154 (0.1%) | 9 (0.0%) | 7 (0.0%) | 3,198 (1.3%) | 251,936 (9.4%) |
| Torda-Aranyos County | 44,630 (25.6%) | 576 (0.3%) | 62 (0.0%) | 125,668 (72.1%) | 8 (0.0%) | 10 (0.0%) | 3 (0.0%) | 3,418 (2.0%) | 174,375 (6.5%) |
| Udvarhely County | 118,458 (95.4%) | 2,202 (1.8%) | 33 (0.0%) | 2,840 (2.3%) | 1 (0.0%) | 5 (0.0%) | 35 (0.0%) | 599 (0.5%) | 124,173 (4.6%) |
| Total | 918,217 (34.3%) | 234,085 (8.7%) | 2,404 (0.1%) | 1,472,021 (55.0%) | 1,759 (0.1%) | 523 (0.0%) | 421 (0.0%) | 48,937 (1.8%) | 2,678,367 (12.8%) |
| Fiume | Hungarian | German | Slovak | Romanian | Ruthenian | Croatian | Serbian | Other (mostly Italian) | Total |
| Fiume | 6,493 (13.0%) | 2,315 (4.6%) | 192 (0.4%) | 137 (0.3%) | 11 (0.0%) | 12,926 (26.0%) | 425 (0.9%) | 27,307 (54.8%) | 49,806 (0.2%) |
| KINGDOM OF HUNGARY | 9,944,627 (54.4%) | 1,903,357 (10.4%) | 1,946,357 (10.7%) | 2,948,186 (16.1%) | 464,270 (2.5%) | 194,808 (1.1%) | 461,516 (2.5%) | 401,412 (2.2%) | 18,264,533 (87.4%) |
| Croatia-Slavonia | Hungarian | German | Slovak | Romanian | Ruthenian | Croatian | Serbian | Other | Total |
| Belovár-Kőrös County | 14,224 (4.3%) | 4,235 (1.3%) | 386 (0.1%) | 1 (0.0%) | 281 (0.1%) | 253,687 (76.3%) | 44,533 (13.4%) | 15,245 (4.6%) | 332,592 (12.7%) |
| Lika-Korbava County | 22 (0.0%) | 68 (0.0%) | 3 (0.0%) | 2 (0.0%) | 2 (0.0%) | 100,346 (49.0%) | 104,036 (50.8%) | 231 (0.1%) | 204,710 (7.8%) |
| Modrus-Fiume County | 899 (0.4%) | 592 (0.3%) | 64 (0.0%) | 6 (0.0%) | 4 (0.0%) | 152,210 (65.7%) | 74,894 (32.3%) | 2,985 (1.3%) | 231,654 (8.8%) |
| Pozsega County | 16,462 (6.2%) | 13,143 (5.0%) | 3,352 (1.3%) | 154 (0.1%) | 2,888 (1.1%) | 142,616 (53.8%) | 66,783 (25.2%) | 19,874 (7.5%) | 265,272 (10.1%) |
| Szerém County | 29,522 (7.1%) | 68,086 (16.4%) | 13,841 (3.3%) | 587 (0.1%) | 4,642 (1.1%) | 106,198 (25.6%) | 183,109 (44.2%) | 8,249 (2.0%) | 414,234 (15.8%) |
| Varasd County | 1,095 (0.4%) | 1,172 (0.4%) | 41 (0.0%) | 2 (0.0%) | 0 (0.0%) | 300,033 (97.7%) | 2,384 (0.8%) | 2,283 (0.7%) | 307,010 (11.7%) |
| Verőcze County | 37,656 (13.8%) | 40,766 (15.0%) | 3,691 (1.4%) | 64 (0.0%) | 439 (0.2%) | 137,394 (50.4%) | 46,658 (17.1%) | 5,762 (2.1%) | 272,430 (10.4%) |
| Zágráb County | 6,068 (1.0%) | 6,016 (1.0%) | 235 (0.0%) | 30 (0.0%) | 61 (0.0%) | 445,870 (75.1%) | 122,558 (20.6%) | 13,214 (2.2%) | 594,052 (22.7%) |
| Total | 105,948 (4.0%) | 134,078 (5.1%) | 21,613 (0.8%) | 846 (0.0%) | 8,317 (0.3%) | 1,638,354 (62.5%) | 644,955 (24.6%) | 67,843 (2.6%) | 2,621,954 (12.6%) |
| TRANSLEITHANIA | 10,050,575 (48.1%) | 2,037,435 (9.8%) | 1,967,970 (9.4%) | 2,949,032 (14.1%) | 472,587 (2.3%) | 1,833,162 (8.8%) | 1,106,471 (5.3%) | 469,255 (2.2%) | 20,886,487 (100.0%) |
And finally here’s a simplified map of the situation:

and here’s another map showing the numbers:
See also: Hungarian Pamphlet From 1920 Protesting The Treaty of Trianon and United States of Greater Austria: Based On Ethnic Groups In the Austro-Hungarian Empire


Leave a Reply