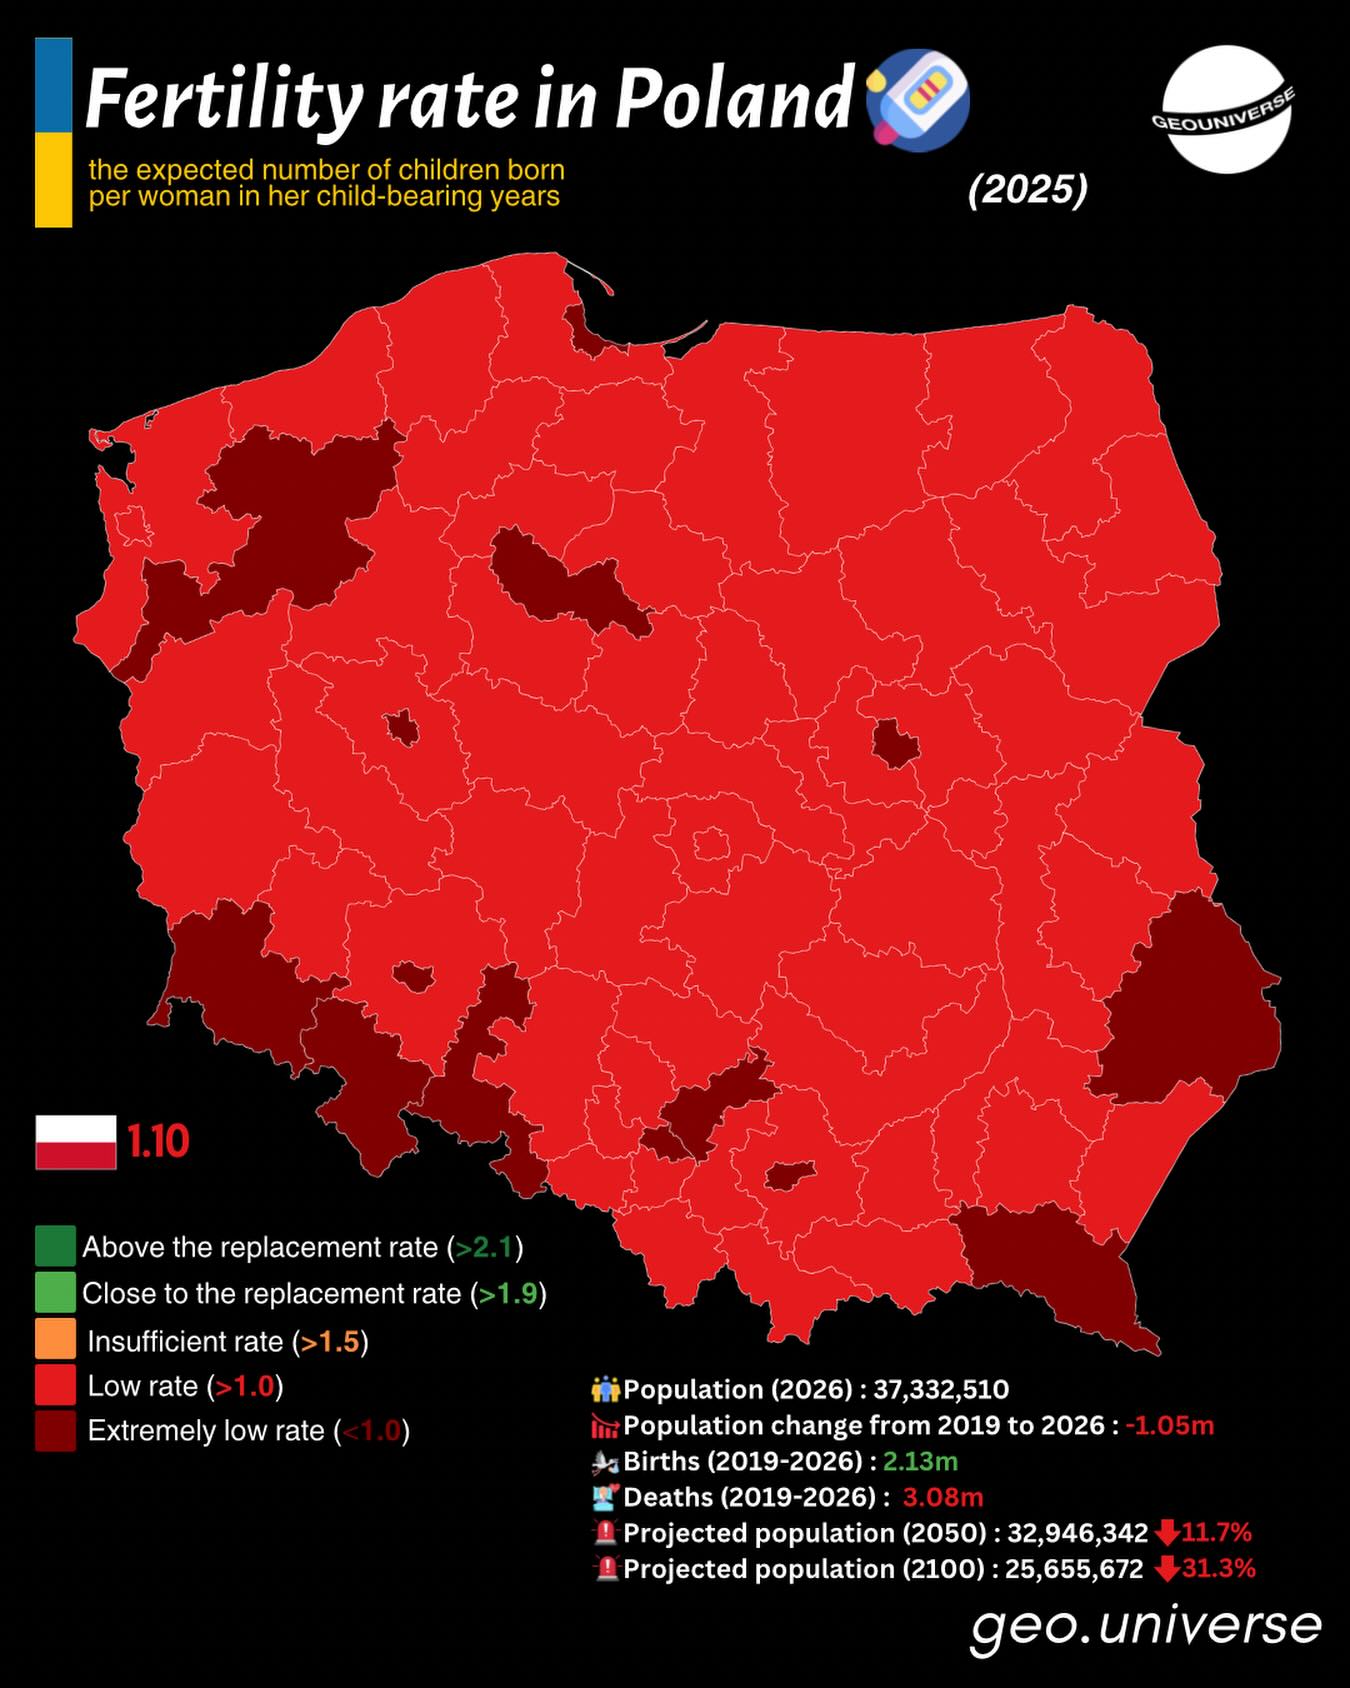
The map above shows a rather socking fact: Poland’s fertility rate has fallen to just 1.10 children per woman in 2025 one of the lowest levels in Europe.
Some more key facts (according to the map author):
👶 Fertility rate (2025): 1.10
👥 Population (2026): 37.3 million
📉 Population change since 2019: −1.05 million
🍼 Births (2019–2026): 2.13 million
⚰️ Deaths (2019–2026): 3.08 million
🔮 Projected population:
• 32.95 million by 2050 (−11.7%)
• 25.66 million by 2100 (−31.3%)
However, you can model out in more details what this means over the long term:
Cohort component projection
Poland in 2100
Poland recorded 238,300 births and 405,500 deaths in 2025, with fertility around 1.06 children per woman. This model ages the country’s real population structure forward in five year steps. Move the sliders to change the assumptions.
Today’s rate, held constant
Nobody arrives, nobody leaves
Reaching 82 for men, 88 for women by 2100
The shape of the country
Men left, women right. The thin outline is Poland as it stands in 2025, held in place so you can see what recedes.
Where the people go
Total population split into children, working age and over 65. The dotted line marks today’s total.
- Under 15
- 15 to 64
- 65 and over




Leave a Reply