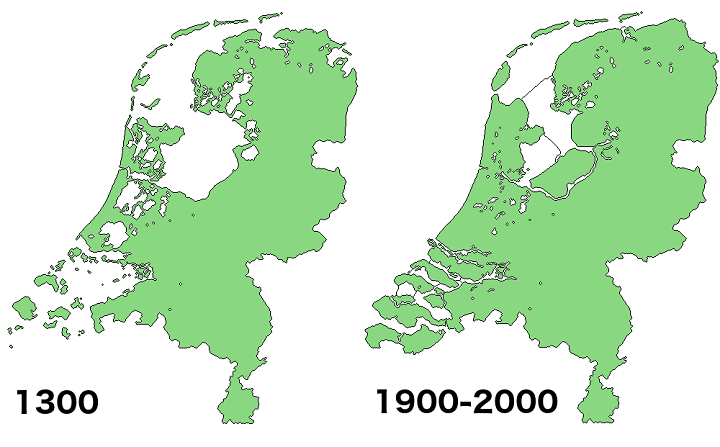
The map comparison above shows what the land area of what makes up the Netherlands today, looked like in 1300 compared to what it looked like in 2000.
Around 17% of the country’s current land area has been reclaimed from the sea or lakes.
You can see a gif of this process below:

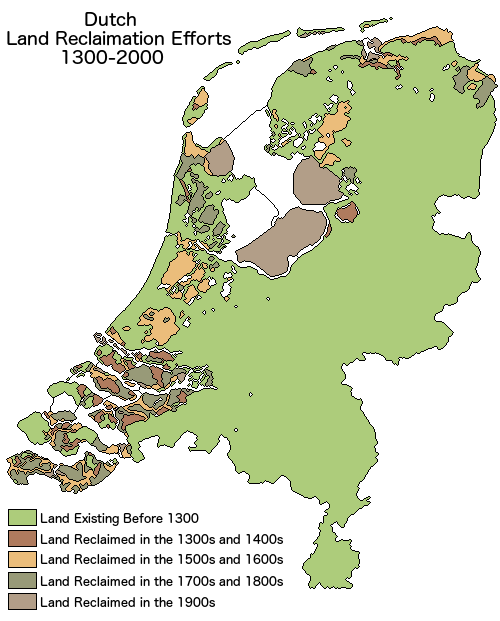
And here’s a map showing during what time period each area was reclaimed:
Here are a few more facts about land area of the Netherlands:
- 26% of its area is located below sea level.
- 21% of its population lives in areas below sea level.
- Only 50% of its area is more than 1 meter above sea level.
- Lowest point: Zuidplaspolder −7 m (−23 ft), below sea level.
- Highest point (In Europe): Vaalserberg 322.7 m (1,059 ft) above sea level.
- Flevoland is the most recent Dutch province and was only created in 1986 on land that was most reclaimed in the 1950s and 1960s.
For more on the Netherlands and Land reclamation have a look at the following books:
- The Dutch and their Delta: Living Below Sea Level
- Dutch Dikes
- Man-made lowlands: History of water management and land reclamation in the Netherlands
Enjoy this map? Please help us by sharing it:
The Map Den says
Love this map of land reclamation and generally loving this web site. Great content, maps and succinct and to the point. Keep up the great work 🙂
Jakki says
Just back from Holland this morning after two weeks holidays. Visited a couple of beautiful historic steam powered pump stations and drove over the IJsselmeer and the Delta Werks dykes. So we saw up close the works. Amazing engineering.
Oliver says
Nice map. However, the Spieringmeer and the Leidsemeer (the two large areas south of Amsterdam) have not been filled in during the 16th century but only much later, in the mid-19th century: Draining the large body of water that by now extended from Haarlem to Leiden only started in 1848. (see e.g. https://en.wikipedia.org/wiki/Haarlemmermeer)
Henk says
The Haarlemmermeer also drew my attention. An area that is missing on the maps is the ´ Middelzee´ in Friesland. Only the northermost part of it is represented on the maps.
Glennert says
I think the third and the fourth color should be switched. All the yellow areas have been reclaimed in the 1800s and 1900s, for example the Haarlemmermeerpolder in 1852 and the Zuidplaspolder in 1840. areas with the fourth color have all been reclaimed in the 1500s and 1600s, for example the Beemster, Schermer and Wijdewormer in 1612, 1635 and 1626 respectively.
George Butiri says
What’s the cost of all of this?
David says
As an alternative: drowning is always free of charge…
James ime Esang says
There is still much reclaimation to be done