
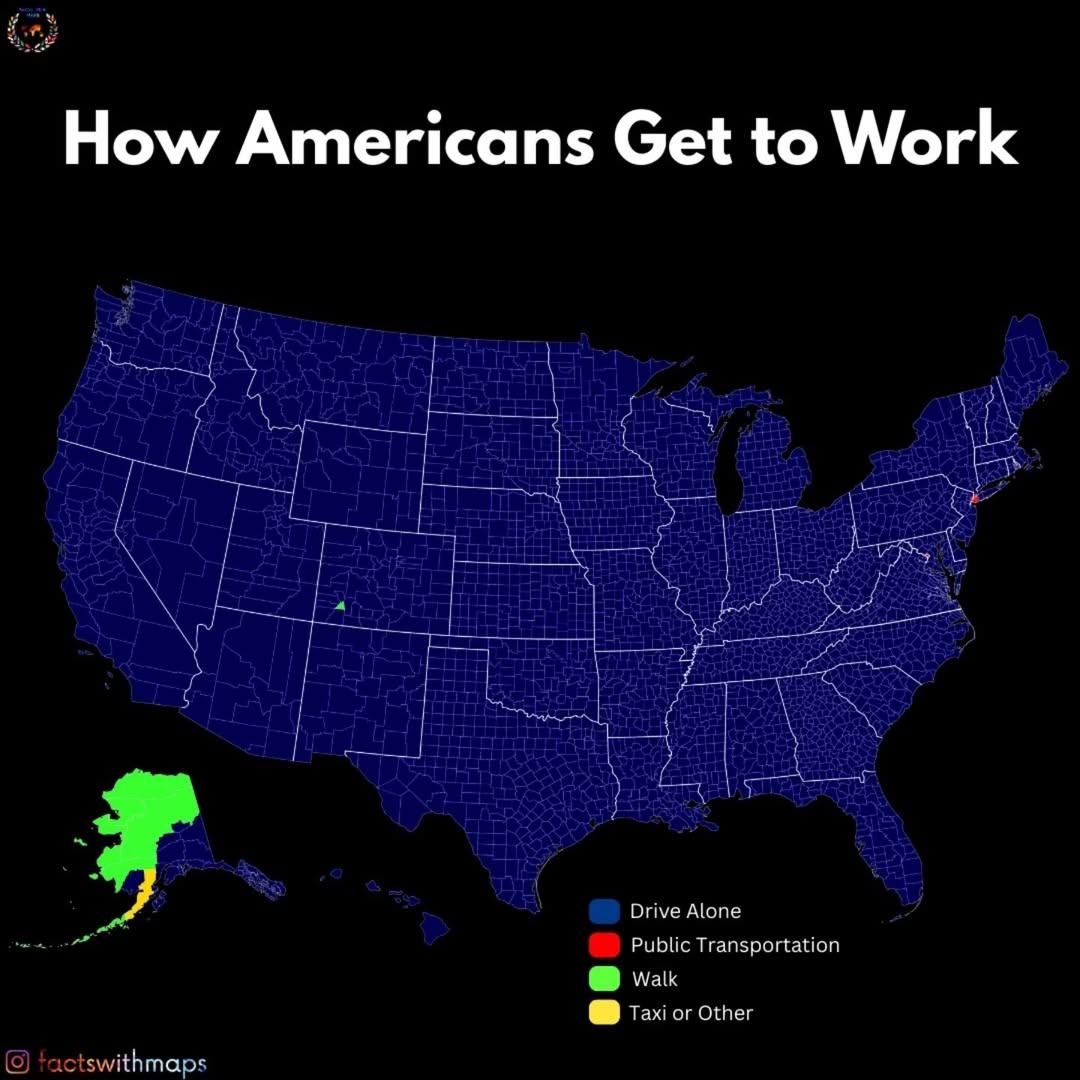
The map above shows how Americans got to work in 2019, just before the pandemic. The one thing that jumps out at you is that driving alone in a car is the most common way almost everywhere.
76% of the country drove alone to work. Public transportation is at 5%, and #1 in NYC, DC, and San Francisco. Interestingly, walking and taxicab/motorcycle are common in Alaska.
However, I was curious how things may have changed post-pandemic. And here are some other maps I found on things have (and haven’t changed).
Here are some maps for the latest 2022 American Community Survey data from Overflow Data (can also see an interactive version there):
Share Of Americans Who Drive To Work Alone

Top Counties Who Drive To Work
- Culberson County, TX – 97.6%
- Kenedy County, TX – 95.7%
- Charlton County, GA – 95.1%
- Glascock County, GA – 94.2%
- Red River Parish, LA – 93.4%
- Union County, MS – 92.6%
- Jefferson County, MS – 92.6%
- Telfair County, GA – 92.2%
- Jasper County, MS – 91.7%
- Webster County, MS – 91.6%
- Escambia County, AL – 91.5%
- Tate County, MS – 91.4%
- Winkler County, TX – 91.3%
- West Carroll Parish, LA – 91.0%
- Tishomingo County, MS – 90.8%
- Pointe Coupee Parish, LA – 90.8%
- Craig County, VA – 90.6%
- Gallatin County, IL – 90.5%
- Clarke County, AL – 90.5%
- Calhoun County, WV – 90.5%
- Monroe County, AL – 90.3%
- Wheeler County, GA – 90.2%
- Mason County, WV – 90.2%
- Franklin County, MS – 90.2%
- Adams County, MS – 90.2%
Share of Americans Who Carpool To Work

Top Counties Who Carpool To Work
- Denali Borough, AK – 31.7%
- Foard County, TX – 28.0%
- Sullivan County, MO – 26.9%
- Lagrange County, IN – 26.9%
- Eureka County, NV – 25.2%
- Sherman County, TX – 23.6%
- Clark County, ID – 23.4%
- Hardee County, FL – 23.2%
- North Slope Borough, AK – 22.4%
- Issaquena County, MS – 22.4%
- Gosper County, NE – 21.3%
- Sevier County, AR – 20.9%
- La Salle Parish, LA – 20.8%
- Coleman County, TX – 20.8%
- Holmes County, OH – 20.7%
- Daviess County, IN – 20.5%
- Humphreys County, MS – 20.1%
- Stillwater County, MT – 19.8%
- Reeves County, TX – 19.7%
- Perry County, KY – 19.6%
- Jackson County, TX – 19.6%
- Randolph County, GA – 19.5%
- Jim Hogg County, TX – 19.4%
- Mellette County, SD – 19.3%
- Costilla County, CO – 19.3%
Share of Americans Who Use Public Transport To Get To Work

Top Counties Using Public Transit
- Bronx County, NY – 54.9%
- Kings County, NY – 50.7%
- New York County, NY – 47.8%
- Queens County, NY – 43.7%
- Hudson County, NJ – 33.5%
- Suffolk County, MA – 25.1%
- Richmond County, NY – 25.1%
- Washington DC – 24.7%
- San Francisco County, CA – 23.9%
- Philadelphia County, PA – 19.8%
- Westchester County, NY – 18.6%
- Arlington County, VA – 18.5%
- Essex County, NJ – 17.0%
- Lander County, NV – 15.8%
- Pitkin County, CO – 14.7%
- Cook County, IL – 14.3%
- Nassau County, NY – 13.6%
- Alexandria city, VA – 13.4%
- Baltimore city, MD – 12.8%
- Bergen County, NJ – 11.7%
- Norfolk County, MA – 10.7%
- Falls Church city, VA – 10.6%
- Alameda County, CA – 10.6%
- Prince George’s, MD – 9.9%
- Elko County, NV – 9.6%
Share of Americans Who Walked To Get To Work

Top Counties Walking To Work
- Aleutians E. Borough, AK – 52.7%
- Skagway, AK – 49.9%
- North Slope Borough, AK – 47.9%
- Hoonah-Angoon, AK – 46.1%
- NW Arctic Borough, AK – 44.2%
- Yukon-Koyukuk, AK – 41.4%
- Kusilvak Census Area, AK – 40.7%
- Denali Borough, AK – 36.7%
- Nome Census Area, AK – 35.3%
- Bethel Census Area, AK – 34.9%
- Aleutians West, AK – 34.8%
- Lake and Peninsula, AK – 34.4%
- Yakutat Borough, AK – 28.9%
- Lexington city, VA – 28.9%
- Hinsdale County, CO – 28.4%
- Dillingham, AK – 27.4%
- Chattahoochee, GA – 23.2%
- San Miguel County, CO – 23.1%
- Pulaski County, MO – 23.1%
- Golden Valley County, MT – 21.0%
- Prince of Wales-Hyder Census Area, AK – 20.6%
- Powder River County, MT – 20.4%
- Petersburg Borough, AK – 19.5%
- Slope County, ND – 19.2%
- Blaine County, NE – 19.0%
Share of Americans Who Commute To Work By Other Means
This category includes taxi, motorcycle and any other vehicle not mentioned above.

Top Counties Commuting To Work By Other Means
- Kusilvak Census Area, AK – 45.2%
- Bethel Census Area, AK – 28.2%
- Nome Census Area, AK – 23.0%
- NW Arctic Borough, AK – 19.3%
- Lake and Peninsula, AK – 17.6%
- Bailey County, TX – 16.9%
- Yukon-Koyukuk, AK – 15.7%
- Holmes County, OH – 14.3%
- Dillingham, AK – 13.5%
- Lagrange County, IN – 12.1%
- Haines Borough, AK – 11.3%
- Presidio County, TX – 11.1%
- Kodiak Island Borough, AK – 10.6%
- Oglala Lakota County, SD – 10.5%
- Monroe County, FL – 10.1%
- Sierra County, NM – 9.5%
- Graham County, KS – 8.7%
- Mackinac County, MI – 8.6%
- Lewis County, WV – 7.8%
- Monterey County, CA – 7.7%
- Davis County, IA – 7.7%
- Pitkin County, CO – 7.6%
- Lake County, CO – 7.5%
- Hoonah-Angoon, AK – 7.5%
- Powder River County, MT – 7.3%
- Copper River Census Area, AK – 7.3%
Share of Americans Who Work From Home
Finally, this is a very interesting category not included in the original map at the top of the page.

Top counties working from home:
- Liberty County, MT – 34.3%
- Ziebach County, SD – 32.4%
- Carter County, MT – 31.3%
- Garfield County, MT – 31.1%
- Perkins County, SD – 30.5%
- Corson County, SD – 30.4%
- Harding County, SD – 29.2%
- Custer County, ID – 28.0%
- Trinity County, CA – 27.2%
- Petroleum County, MT – 27.2%
- Arlington County, VA – 27.0%
- Falls Church city, VA – 26.8%
- Campbell County, SD – 26.4%
- Marin County, CA – 25.9%
- Forsyth County, GA – 25.8%
- Washington DC – 25.0%
- Prairie County, MT – 24.5%
- Judith Basin County, MT – 24.4%
- Boulder County, CO – 24.4%
- Douglas County, CO – 24.2%
- Alpine County, CA – 24.1%
- Cottle County, TX – 23.7%
- Loudoun County, VA – 23.5%
- Jackson County, CO – 23.5%
- San Francisco County, CA – 23.4%
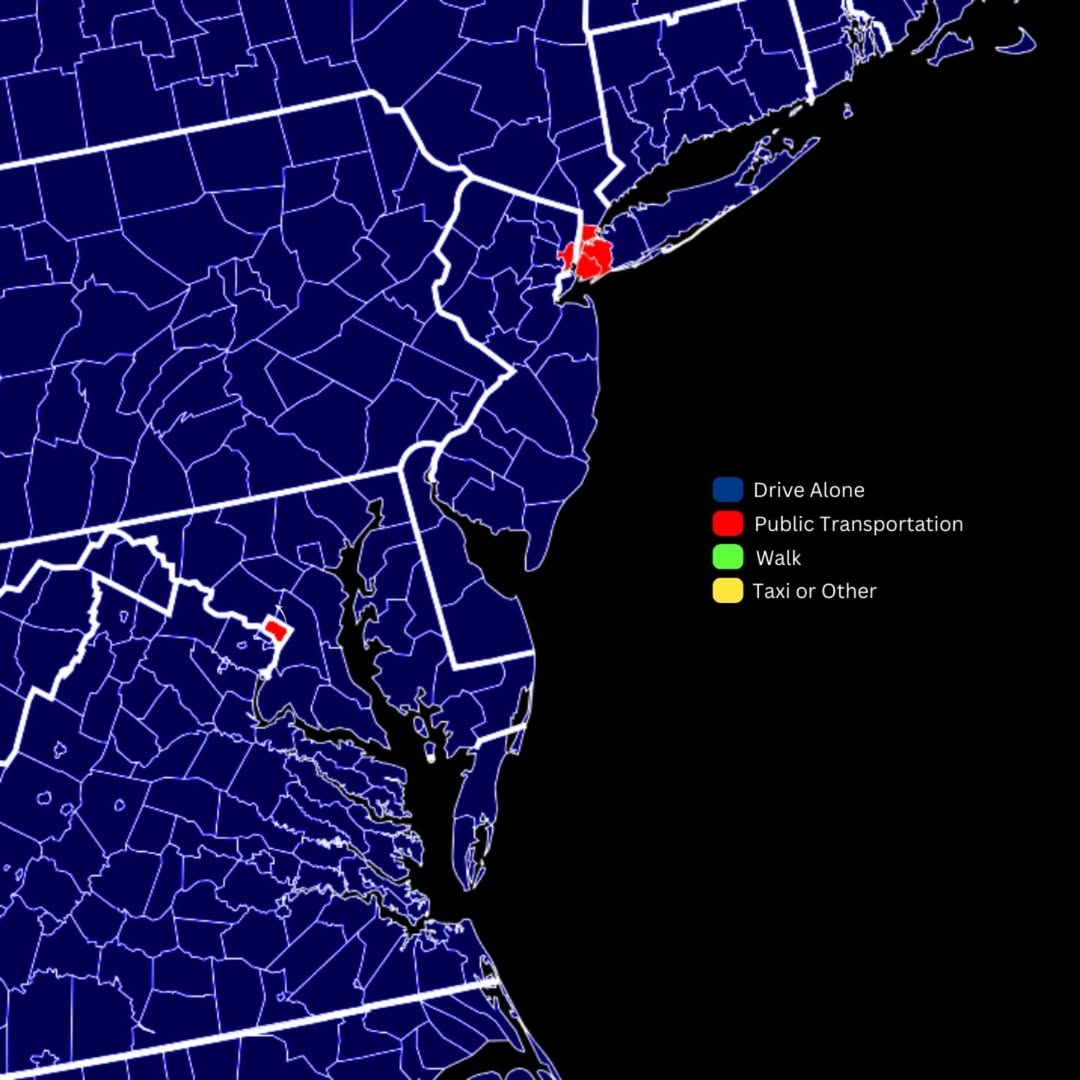
Finally, here are some more versions of the original map created by factswithmaps.
Does any of the above surprise you?


Leave a Reply