
However, its strategic situation and ability to continue the war were collapsing, which made surrender inevitable despite the apparent size of its empire.
Making Sense Of The World, One Map At A Time
However, its strategic situation and ability to continue the war were collapsing, which made surrender inevitable despite the apparent size of its empire.

Here’s a full list.

More about that period below:
The video above shows the rise and now fall of Japan’s population by prefecture between 1920 and 2020. Japan’s population today is still 125% higher than it was a century ago, but as is well known has started to decline in recent years.
The maps and video are all the work of Wikimedia users Monaneko and Pekachu.
Here are the numbers:

The map above shows a hypothetical post-WWII occupation plan for Japan based on how the allies divided Germany.
In our timeline, the atomic bombings of Hiroshima on 6 August 1945 and Nagasaki on 9 August 1945, likely forced a quicker end to the war than would have happened without them.

The map above shows which perfecters are losing people the fastest in Japan.
46 of 47 Japanese Prefectures experienced population decline in 2023, of which 15 experienced a grater than 1% drop.
Tokyo was the sole prefecture to see population increase, due in part to increasing immigration numbers.
Here are the numbers by prefecture:
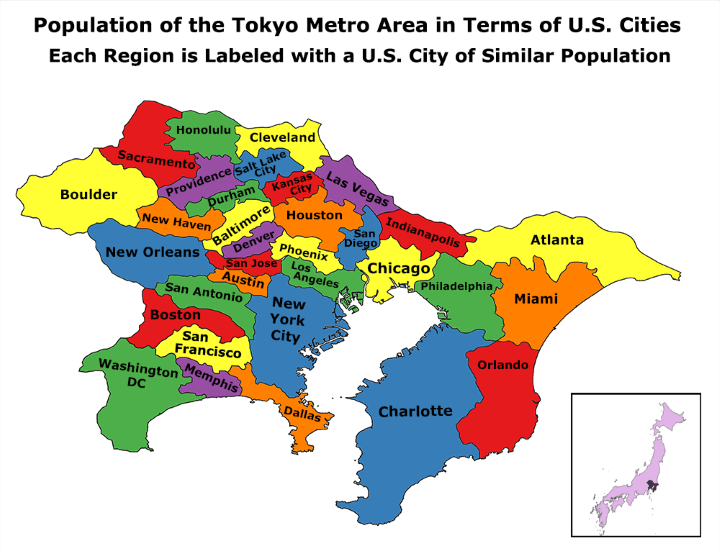
Please note this map was made in 2014:
According to the UN, Tokyo is the world’s most populous metropolitan area with an estimated 37.8 million people in 2014 (38,140,000 in 2026).
The next closest is the Seoul National Capital Area with a population of 25.6 million people or over 10 million fewer than Tokyo!
So how does this compare to US cities?