
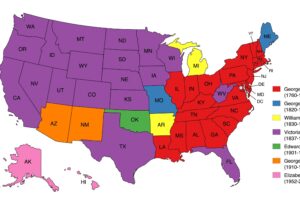
The map above shows what a United States of Greater Austria might have looked like.
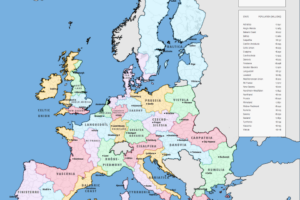
It’s based a proposal conceived by the lawyer and politician Aurel Popovici in 1906. The proposal has been superimposed on a map of the ethnic groups of Austria-Hungary in 1910 which is based on “Distribution of Races in Austria-Hungary” from the Historical Atlas by William R. Shepherd, 1911.
As the map above shows, Austria-Hungary in 1910 was one of the most ethically diverse countries in history. It was also the second largest country in Europe (behind the Russian Empire) and the third most populous (behind the Russian and German Empires).
Overall, the Empire had a population of nearly 52 million people, who spoke the following languages (percentage shows most commonly used everyday language):
- German: 23.36%
- Hungarian: 19.57%
- Czech: 12.54%
- Serbo-Croatian: 10.94%
- Polish: 9.68%
- Ruthenian (Ukrainian): 7.78%
- Romanian: 6.27%
- Slovak: 3.83%
- Slovene: 2.44%
- Italian: 1.50%
- Other: 2.09%
It was split into 3 regions with percentage of population:
- Austrian lands (Cisleithania): 55.6%
- Hungarian lands (Transleithania): 40.6%
- Bosnia and Herzegovina (join control): 3.8%
Austria-Hungary was only formed in 1867, as a result of the Austro-Hungarian Compromise of 1867. The compromise was direct result of The Austrian Empire’s complete defeat during the Austro-Prussian War, which left it on the verge of total collapse.
The compromise of 1867 both saved the Habsburg Monarchy and transformed Austria into a dual monarchy where both the Austrian and Hungarian crowns were equal. The compromise, on the whole, worked reasonably well for the Austrians and Hungarians living in the Empire, but didn’t give much representation to the Empire’s other minorities.
Given that the German speaking Austrians and Hungarians together only made up 42.93% of the Empire’s population, the compromise was not exactly a recipe for long term stability.
Ultimately, the Empire was unable to survive the strains of World War One and finally collapsed in 1918.
So the map above shows an Austria and Europe that might have been had there been more of willingness and ability to compromise between different groups.
Following the total devastation of the Second World War, Europeans did in fact start coming together. Forming the European Economic Community in 1957, Schengen Agreement in 1985, European Union in 1993 and Euro in 2002.
You can learn more about the Austro-Hungarian Empire from the following books:
- The Habsburg Empire: A New History
- The Austro-Hungarian Empire: A Political Sketch of Men and Events Since 1866 (Classic Reprint)
- Fall of the Double Eagle: The Battle for Galicia and the Demise of Austria-Hungary
Enjoy this map, then please help us by sharing it:


Tibor Varga says
Very interesting but it is too late and I like the EU more, particularly if it incorporate local autonomy’s for South Tirol, Szekler Land, Catalonia, Corsica, Bask Country, Bretagne, Sicily, etc. along the model of the Swiss Confederacy. USAu may work better as a regional interest group like as an expanded Visegrad 4 countries. Tibor
Attila Kovács says
This map clearly shows why the concept of Austria-Hungary was not sustainable.