Brilliant Maps

Making Sense Of The World, One Map At A Time

  • BOOK!
  • Newsletter
  • Tourist Maps
  • Quizzes
  • Polls
  • Tools

Maps and the 20th Century: Drawing the Line Review

Last Updated: March 3, 2023 Leave a Comment

Click To Get My 10 Best Brilliant Maps For Free:

A propaganda poster published in Germany in 1919

A propaganda poster published in Germany in 1919

If you’re in London at some point before 1 March 2017, you need to head over to the British Library and check out Maps and the 20th Century: Drawing the Line. (and if not you should buy the book instead).

It is quite simply the best map exhibit I’ve ever seen.

The exhibition is divided into 5 sections, outlined briefly below.

1. Mapping a New World
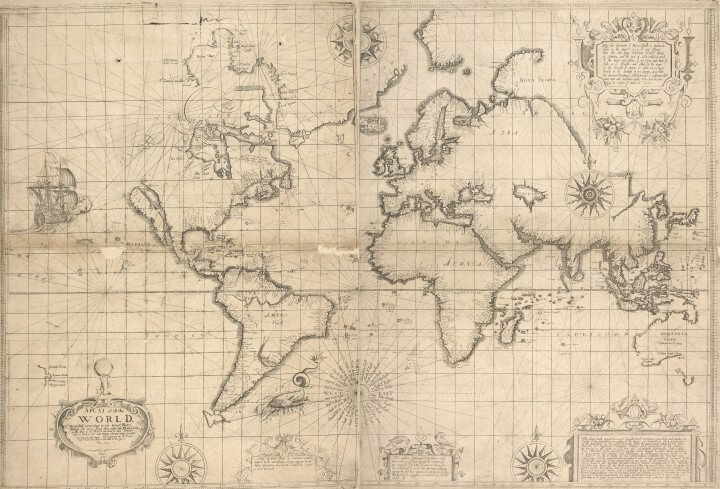
Edward Wright 1599 world map using Mercator's projection

Edward Wright 1599 world map using Mercator’s projection

This section serves as the introduction to the exhibit and includes many maps that reflect the momentous changes in society that occurred during the 20th century. It includes a little bit of everything from comic maps to mass production to the motivation of cartographers to create maps in the first place.

Navy League Map of the British Empire in 1901

Navy League Map of the British Empire in 1901

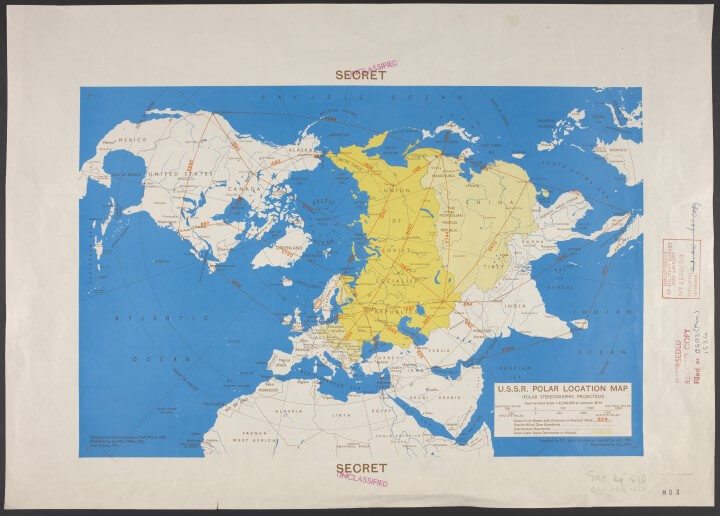
2. Mapping War

1951 Cold War map showing the world as seen from the north pole

1951 Cold War map showing the world as seen from the north pole

This section looks at maps related to war. Every year of the 20th century witnessed armed conflict somewhere on earth. While there is obviously a heavy emphasis on World Wars 1 & 2, along with the Cold War, it also includes propaganda maps, and maps of more minor conflicts as well.

3. Mapping Peace?

1942 world map by Maurice Gomberg showing how the world might look like following World War 2

1942 world map by Maurice Gomberg showing how the world might look like following World War 2

This section looks at maps after conflicts have ended. The question mark is included because these maps could sometimes be used as the basis for future conflicts. This is perhaps the most interesting section of the exhibit.

Two notable maps that stood out for me, were a 1947 tourist map of Hiroshima that showed the devastation caused by the A-bomb that was dropped just two years earlier and Michelin Guide Books printed in 1917/18 that showed tourists where to go see the battle sites of World War I. Both are proof that disaster tourism is nothing new.

4. Mapping the Market

1932 Trade route map of the British Empire

1932 Trade route map of the British Empire

This section looks at maps that tell stories about the economy. While there are many interesting maps in this section a particular highlight is Mercator’s Atlas.

5. Mapping Movement

1931 Harry Beck's Original sketch for the London Underground Railways Map

1931 Harry Beck’s Original sketch for the London Underground Railways Map.
Copyright V&A Museum & TFL.

The final section looks at mapping movements and contained my favourite map of the whole exhibit, Harry Beck’s original sketch for what would become the world famous Tube Map (see above). It also includes a map of Tolkien’s Middle Earth along with examples of how changing technology is reshaping the way we use and interact with maps.

Anyone who loves maps will love this show. We give it a 5 out of 5.

Key information:

  • When: The show runs until 1 Mar 2017. (See opening hours here)
  • Where: PACCAR Gallery, The British Library, 96 Euston Road, London, NW1 2DB
  • How much: Tickets are £12 per person with concessions available.
  • Contact Details: Phone: +44 (0)1937 546546, e-mail: boxoffice@bl.uk, website

Finally, if you can’t make the show, but would like to see all the maps, you can buy a copy of the accompanying book: Maps and the 20th Century: Drawing the Line, available in Hardcover (£40) and Paperback (£20)..

Filed Under: Other Tagged With: review

Click To Get My 10 Best Brilliant Maps For Free:


Other Popular Maps

  • Least Useful (And Vaguely Racist) Ethnic Map Ever

    Least Useful (And Vaguely Racist) Ethnic Map Ever

  • 4 Maps Showing East Asia’s Demographic Collapse

    4 Maps Showing East Asia’s Demographic Collapse

  • Elon Musk’s Net Worth Compared To The Total Household Wealth Of Various Countries

    Elon Musk’s Net Worth Compared To The Total Household Wealth Of Various Countries

  • Railway Lines In the United States On The Eve Of The Civil War

    Railway Lines In the United States On The Eve Of The Civil War

  • Map & List of Strange European Laws

    Map & List of Strange European Laws

  • Largest Stadium By Capacity In Each Country

    Largest Stadium By Capacity In Each Country

  • Watch World War I In 60 Seconds

    Watch World War I In 60 Seconds

  • Pig Farms In Europe

    Pig Farms In Europe

Leave a Reply Cancel reply

Your email address will not be published. Required fields are marked *

This site uses Akismet to reduce spam. Learn how your comment data is processed.


Product Reviews · World Atlas · Map Posters · Settlers of Catan · Risk · Game of Thrones · Coloring Books · Globes · Monopoly · Star Wars · Game of Life · Pandemic · Ticket To Ride · Drinks Cabinets
Size Comparisons · US Locations · Flight Maps · Fleet Management
Copyright © 2026 · Privacy Policy · Fair Use, Attribution & Copyright · Contact Us
Follow Us: Newsletter · Facebook · Youtube · Twitter · Threads · BlueSky · LinkedIn · Instagram · Pinterest · Flipboard