You can see how it compares to the 2016 map here.
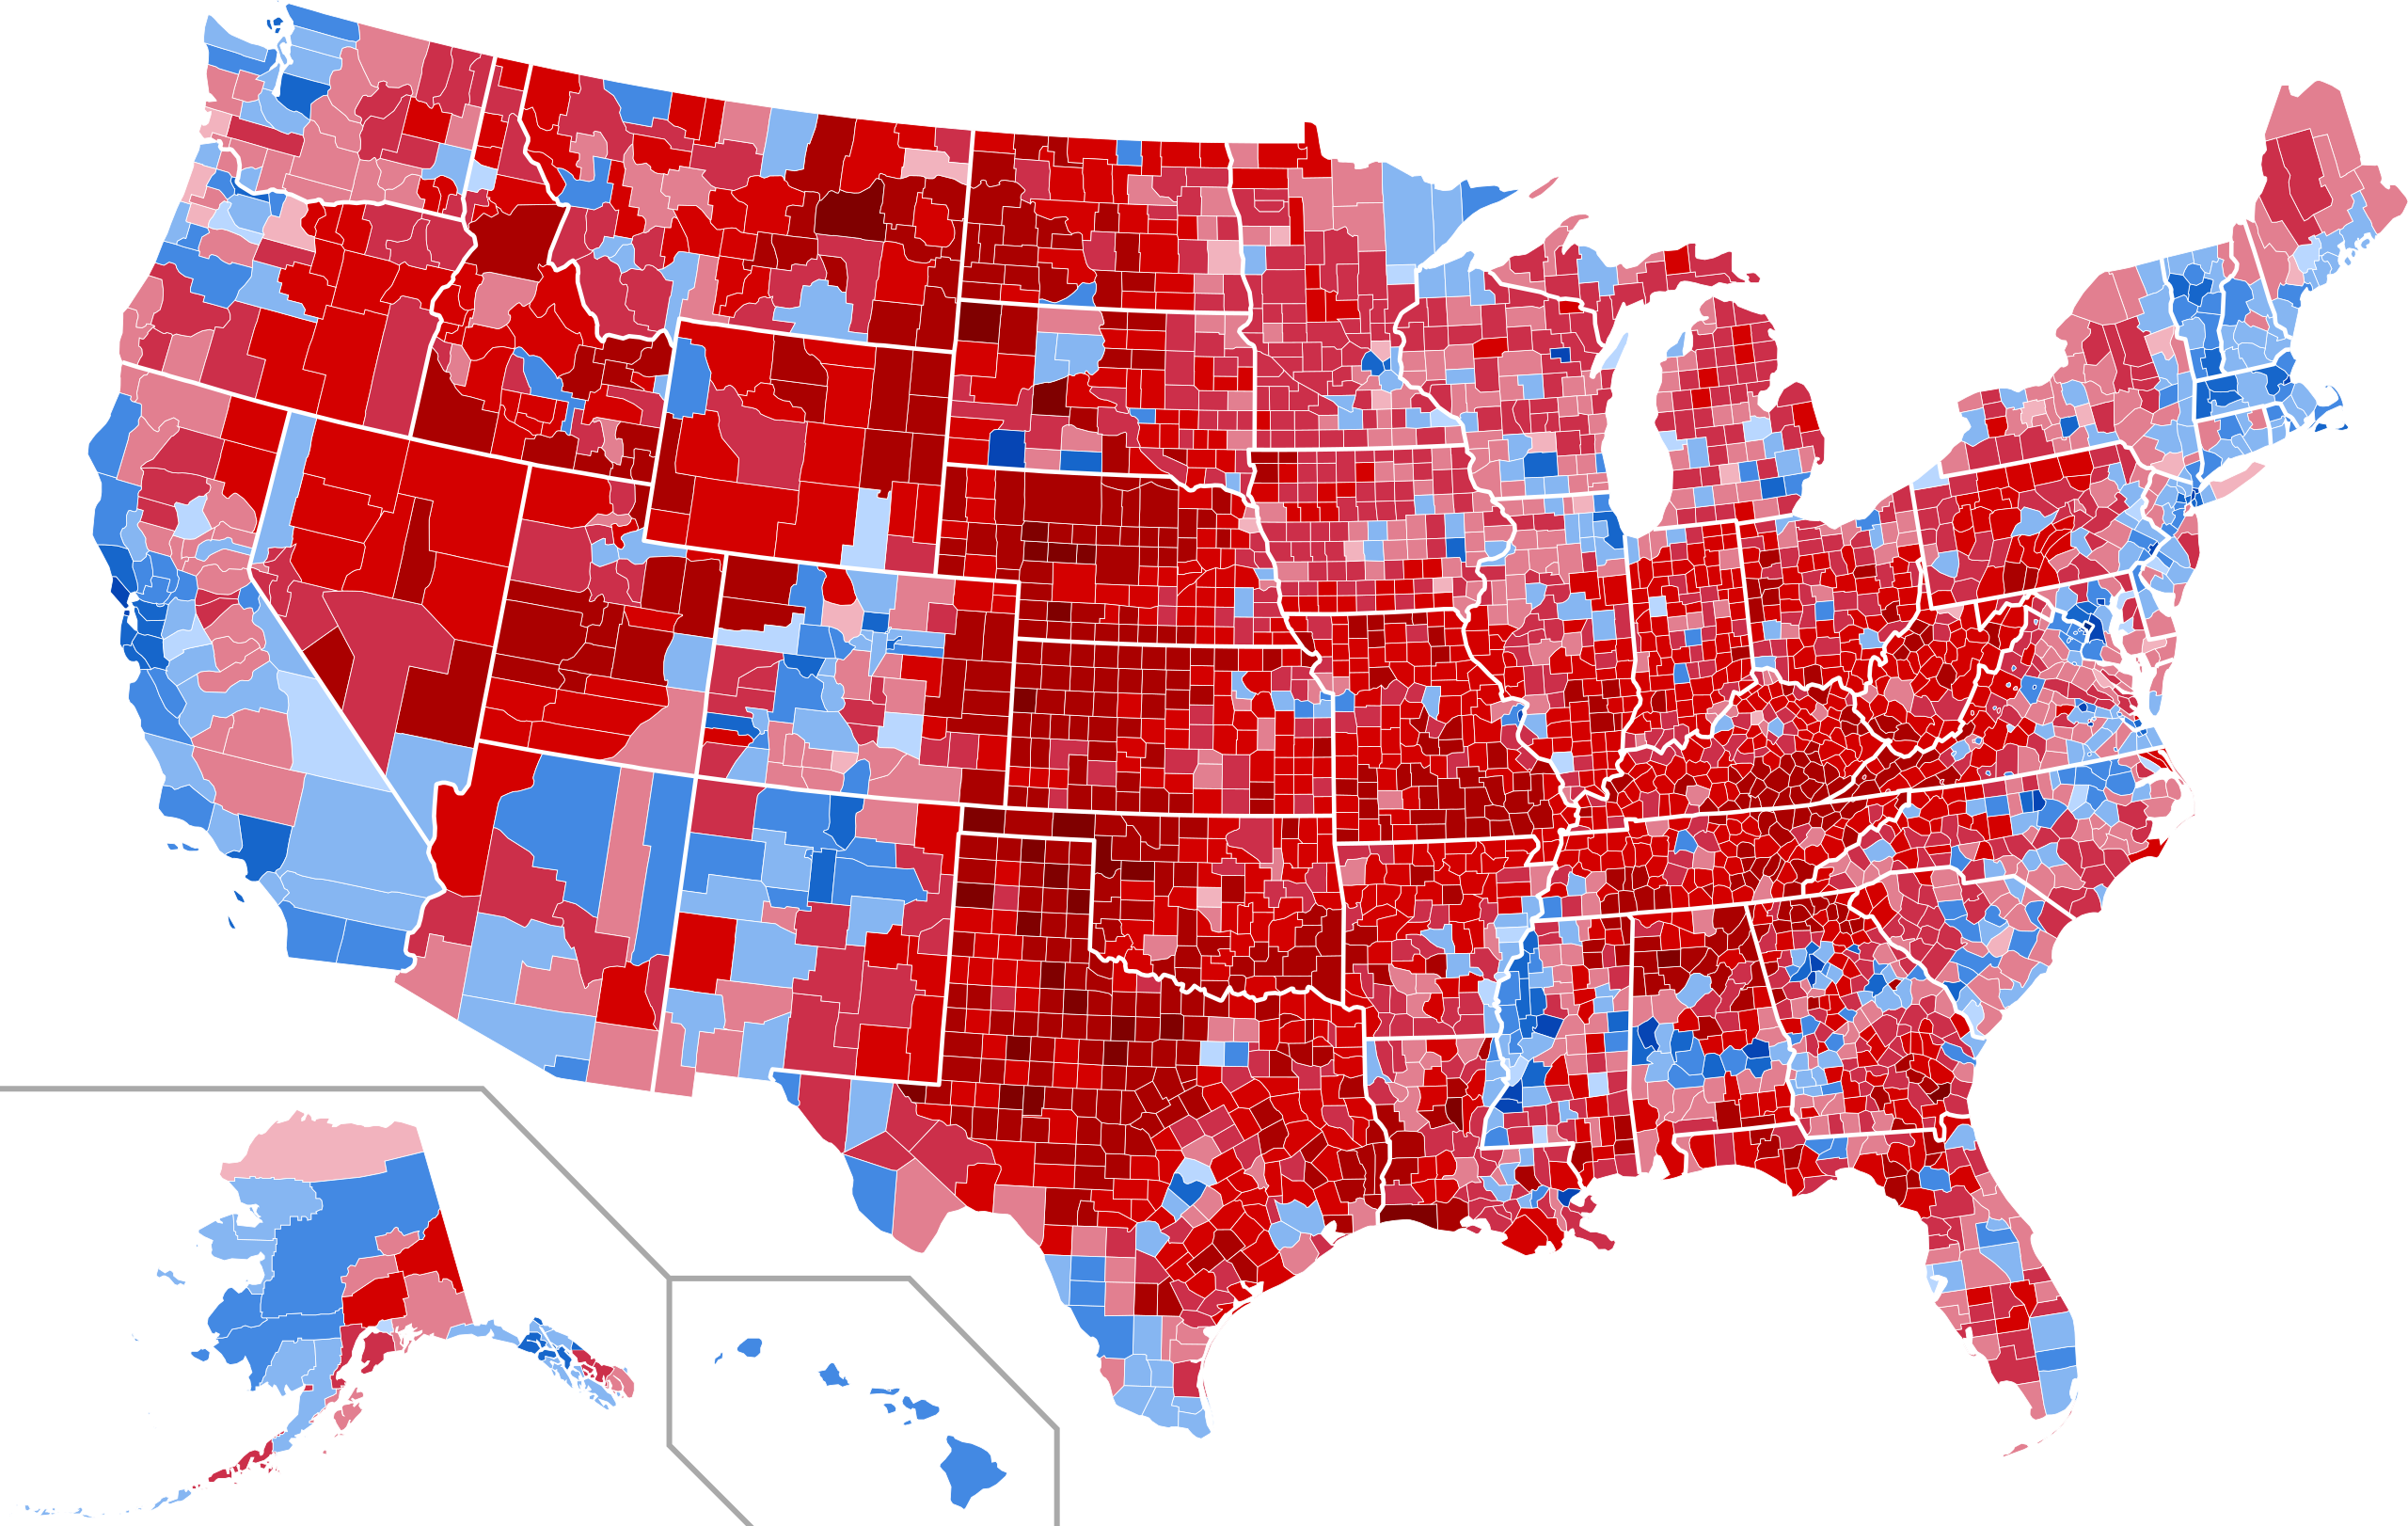
In total, out of the 3,153 counties/districts/independent cities in the US, Trump won the popular vote in 2,595 of them (82.30%) while Biden carried only 558 (17.70%).
So how did Biden win?
The counties Biden won have a lot of people in them. Take Los Angeles county, by far the nation’s most populous at 10 million people.
Biden won it 71.03% (3,028,885 votes) to Trump’s 26.86% (1,145,530).
This means that Biden got more votes in Los Angeles county alone than the entire population of North Dakota, Alaska, Vermont and Wyoming combined!
Therefore, while overall the map doesn’t look too dissimilar from 2016, the results in many ways couldn’t be more different. First and foremost Biden won whereas Clinton lost.
Biden received 15 million more votes than Clinton and 18 million more votes than Trump did in 2016.
However, Trump also did better in 2020 than 2016 winning 11 million more votes than he did 4 years earlier, and 8 million more than Clinton did that year.
The difference of course is primarily down to the enormous increase in voter turnout 66.9% in 2020 vs just 55.7% in 2016.
This means Biden won 306 electoral college votes compared to 232 for Trump an almost complete switch from 2016 where he won 304 electoral college votes to 227 for Clinton (there were 7 faithless electors in 2016).
However, in terms of geography the pattern from 2016 largely remained the same. Biden won the majority of the people, Trump won the majority of the land.
According to NPR: “In 2020, just 77 counties total have flipped so far, and Biden won 59 of them.”
And according to the Brookings Institute: “Biden-voting counties equal 70% of America’s economy.”
This means Biden won the the presidency with the fewest counties (Obama won 689 in 2012), but also the largest number of votes in history.
This is part of a long-term trend where the Democrats are more and more concentrated geographically.
This would not be a problem for them if the presidency were decided by poplar vote. But the Electoral College favours small states at the expense of big ones, which means they are facing an increasingly difficult structural challenge.
This is a problem both for presidential elections and for hopes of regaining control in the Senate.
If you enjoyed this map you may also be interested in: If “Did Not Vote” Had Been A Candidate In The 2020 US Presidential Election
And if you’re wondering what factors lead to Biden’s win here are some of the most common explanations:
- COVID-19 Pandemic:
- The pandemic was a central issue of the election. Many voters were critical of Trump’s handling of the crisis, including his downplaying of the virus, mixed messaging, and the federal government’s response to testing, PPE distribution, and vaccination development.
- Biden promised a more science-based and coordinated federal response, which appealed to voters concerned about the pandemic.
- Economic Concerns:
- The economic fallout from the pandemic, including high unemployment rates and business closures, influenced voters’ perceptions of Trump’s economic management.
- Biden’s platform included plans for economic recovery, job creation, and support for small businesses, which resonated with many voters.
- Racial and Social Justice Issues:
- The summer of 2020 saw significant protests following the killing of George Floyd and other instances of police violence. Trump’s response to these events, including his use of federal troops to disperse protesters, was polarizing.
- Biden’s message of unity and his commitment to addressing systemic racism and police reform appealed to many voters seeking change.
- Suburban and Female Voters:
- Trump lost significant support among suburban voters, particularly suburban women, who were crucial to his 2016 victory. Issues like healthcare, education, and Trump’s rhetoric played a role in this shift.
- Biden’s more moderate and empathetic approach attracted these voters.
- High Voter Turnout:
- The 2020 election saw record voter turnout, with more than 159 million Americans casting ballots. Efforts to increase voter registration and turnout, particularly among young people and minority communities, benefited Biden.
- Mail-in voting and early voting options were expanded in response to the pandemic, making it easier for more people to vote.
- Campaign Strategy:
- Biden’s campaign focused heavily on swing states and rebuilding the “blue wall” in the Midwest (Michigan, Wisconsin, Pennsylvania) that Trump had won in 2016.
- The campaign’s messaging emphasized Biden as a unifying figure who would restore decency and normalcy to the White House, contrasting with Trump’s often divisive and chaotic approach.
- Coalition Building:
- Biden successfully built a broad coalition that included not only traditional Democratic voters but also independents and disaffected Republicans.
- Endorsements from prominent Republicans and figures like former President Barack Obama helped consolidate support.
- Media and Public Perception:
- Trump’s contentious relationship with the media and his handling of press interactions often generated negative coverage.
- Biden, with his long political career and familiarity to many Americans, was able to position himself as a steady and experienced leader.
These factors combined to give Biden a decisive victory in both the popular vote and the Electoral College.
Now the big question for 2024 is how important any of these factors are for voters this time around.
What do you think? Leave your comments below:


Clint says
Maps showing county fluctuations in voter turnout could tell an interesting story.
Billy Goat says
I have this information
Palmetto95 says
It’s Jan 2021 now, can you update the counties for Biden and Trump, please?
Grant says
They cant cause it will show a red map
Tom Terwilliger says
“This would not be a problem for them if the presidency were decided by poplar vote. But the Electoral College favours small states at the expense of big ones, which means they are facing an increasingly difficult structural challenge.
This is a problem both for presidential elections and for hopes of regaining control in the Senate. ”
This is not a “problem” at all, but rather a “design feature” that was deliberately built into our nation, and which, had it not been for this, we never would have had a nation in the first place.
Stop all the bellyaching!
MB says
Um, it was originally by popular vote. The “design feature” fell by the wayside when Repubs capped our representation.
LookitUp says
EC been around since 1789 you dumb a$$
JRL says
Read the Constitution, specifically Article II, Section 1.
GL says
MB is like many liberals, very misinformed and misguided. The electoral college was part of the Great Compromise that allowed small states to have a voice. If we ditched the electoral college system, “flyover country” would have no voice and a small handful of states would decide every national election.
Brooke says
“Flyover country would have no voice”: Wyoming has a population of 581,381. California has over sixty-five times as many people.
In other words, if the entire state of Wyoming became part of California, it would be like about 9000 new people becoming part of Wyoming.
A family member of mine grew up near Pittsburgh, kinda close to McKeesport, Pennsylvania. It has a population of about 17,000. In other words, if it suddenly became part of Wyoming, it would have nearly twice as much of an influence as if the entire freaking state of Wyoming just moved to California. The reason Flyover Country would have no voice is because it has no people. (Or comparatively few.)
“A small handful of states would decide every national election”: According to the US Census (census.gov/popclock) the top ten states by population have over 180 million people — significantly over half the US population. In a democracy, where you live shouldn’t matter. Someone shouldn’t exert more power over the US if they move to Wyoming for a job versus if they move to California. But they do. A small handful of states have most of the people, shouldn’t they have most of the votes?
But they don’t. The number of House votes of California, Texas, Florida, New York, Pennsylvania, Illinois, Ohio, Georgia, South Carolina, and Michigan (the top ten states) combined is 234, which is over half (I believe by less than it should be, but I’m not confident of this)–but in the Senate they have just 20 votes, which means in the Electoral College, which is relevant here, they have 254 votes. Half of 538 is 269, so they are underrepresented in the Electoral College.
kenan bulut says
“Capped our representation”? What are you talking about? Nothing has changed about the electoral college.
Geo says
Amen brother!
joseph salvo says
We will stop our bellyaching , after Mike proves that he did not get anywhere near votes they claim. I am talking legal votes . Mike will prove to Supreme.. C.ourt on thanks giving weekend . that he lost and now the whole country has lost. He making our citzens pooorer while the are thosands sleeping on the street , including vets. This man and his family is in pockets of China ,Russia George soros Who by the way his son is married to Chelsa. now he wants big money to buy local officals to change local voting laws and put in there marxist just like happed in all 7 swing state . For taking millons from them he owes them. Hoping C linton ends up behind bars ,just like there doing to the so called insurection. not one gun or weapon. show me in history were that occured. This IDIOT is a Marxist. He must Go Now .
Geoff says
how did the “supreme court case go?’ right, it didn’t. Because in court, unlike on twitter, saying something untrue carries real life penalties like contempt of court, disbarment and the like.
kenan bulut says
Who’s Mike?
SM says
If Electoral votes are done with States, then why don’t they do it for the Counties? For example… Have every County/County equivalent get one vote. That way it doesn’t deal with big or small States. Also… The whole State is not controlled by their big city…. Chicago/Cook County controls the whole state in voting. And they wonder why the rest of the State has a low turn out at Election time.
Wyo Guy says
There are 12 counties in Nebraska with fewer than 1000 people. You want to give one of those counties the same weight as Douglas County, which has over 1/2 million people? Or Dallas County Texas that has 2.5 million??? Talk about disincentivizing voting. Real estate should not be given a voice. People should. Popular vote only. One vote = one vote.
My little Wyoming vote should not have far more weight than someone that lives in New York. With the current electoral college system, my vote is the heaviest in the nation (assuming I vote Republican).
In the end, if you want rural issues to matter to densely populated cities, get your word out on why it matters. Yapping about stolen elections, emails, laptops, and gun rights doesn’t speak to the majority.
Bob says
I think the elections would be better by having the larger number of counties per state wins the electoral vote for the state.
Some states for example in the north east will be solid vote for Democrat. Where other states having large cities with large democratic voters takes the state by popular vote. Example Wisconsin 90 percent of the state voted Republicans.
However the large democratic cities help win the states. This makes for a unfavorable out come for every vote counting. If large population of one or two cities control the voting for state. Why should other voters in other parts or in the smaller cities or counties feel that their vote never counts.
Erich Goode says
How does the user access each county in the US and find out what percent in each and every county voted for Trump vs. Biden? Erich Goode, NYC
Hector Garcia says
https://www.nytimes.com/interactive/2021/upshot/2020-election-map.html?fbclid=IwAR1Do9xQS_jvW9juLHGGmobS8P8IM3Ca3w05gCr0gUy7Ol066B3u6z_iIcU
Eric Xxyyzz says
Where can we access the raw data?
Dr. Scott Brown says
Your writers would do well to dig deeper into the Brookings Institute’s assertion that “Biden-voting counties equal 70% of America’s economy.” This poorly researched statistic really means that the profits of farmers whose wheat, barley or corn had a “bumper year,” pale in relation to the profits realized by the banks that carried loans, the grain buyers who then sell to the refiners or breweries, the brewers’ and refiners’ profits, and so on. In fact, all who benefit most from the efforts of the rural communities reside in cities. It is the rural counties that produce the nation’s necessities. The urban counties–buyers, bankers, brokers, breweries, refiners, bakeries–would be nowhere without the rural producers! A more accurate statistical analysis will demonstrate that, without rural producers and rural communities, there is no economy at all!
John Bland says
I think the democrat that run this site knows he’s spreading misinformation about the fraudster we have as president now . You know the guy who didn’t win the 2020 general election Joe Biden, and instead of being prosecuted and sentenced to life in prison along with the rest of the democrat activists who allowed him to enter the White House .
Kind of like home invasion belongs a major loser and cheater like joe Biden only deserves life in prison or or the death penalty for committing treason against the American people and the true winner of the 2020 general election President Donald J Trump!
But don’t waste your breathe here this guy is a clown!
Brilliant Maps says
I’m a Canadian living in the UK so am neither a Democrat nor a Republican.
Eric says
Nicely done map. It resembles a work of art with tiles for each county. Quite beautiful actually!
Trip Moore says
This map is proof the electoral college system, although its intentions are fair has failed the rural population of America. And is controlled by large population of major city constituents.
Scot Dowler says
The fact that people vote, not land is always a distortion in these type of electoral maps. It leads many people to draw the wrong conclusion. Vox news has a map that shows a map of US states where the state size is proportional to the population. If we showed the election results on this map it would help people understand where the votes are. Here is a link to that map.
https://www.vox.com/2015/8/19/9178979/united-states-population
L says
Interesting concept of 10 year old data.