
Here’s desfirsit explaining what he did:
Click for high resolution!
Made in R, using the tmap package, and shapefiles from euratlas.net.
The borders are for “sovereign states” (according to Euratlas), and are shown in 100 year increments.
In other words, the map shows the borders for the year 1000, 1100, 1200, 1300, 1400, 1500, 1600, 1700, 1800, 1900 and 2000.
Borders are drawn with some transparency, so more solid borders are borders that have stayed the same for longer.
Unfortunately this is the extent of the shapefiles provided, so apologies to everyone in the nordic countries 🙁
Edit: Thanks for the silver and upvotes! Many have pointed out missing lines, especially in France, for instance around Bretagne or Normandy.
I have followed euratlas determination of “sovereign states”.
In their data, Bretagne – for instance – is coded as part of “West Frankia” in the early period.
When English kings held parts of France, they technically did so with the french king as their overlord.
De facto, it was a part of the Angevin empire. But – I thought that me making judgements about what is part of state or other would be more arbitrary and open to criticism, so I simply followed the definitions in the data I used.
Also, people have pointed out that the concept of a “nation state” was around in medieval times.
That is absolutely correct – I used the term “national borders” in the title as I thought it was the easiest to understand at a glance. But more correct, and probably better, would have been “state borders” for instance.
And here are the ages of Europe’s current borders:
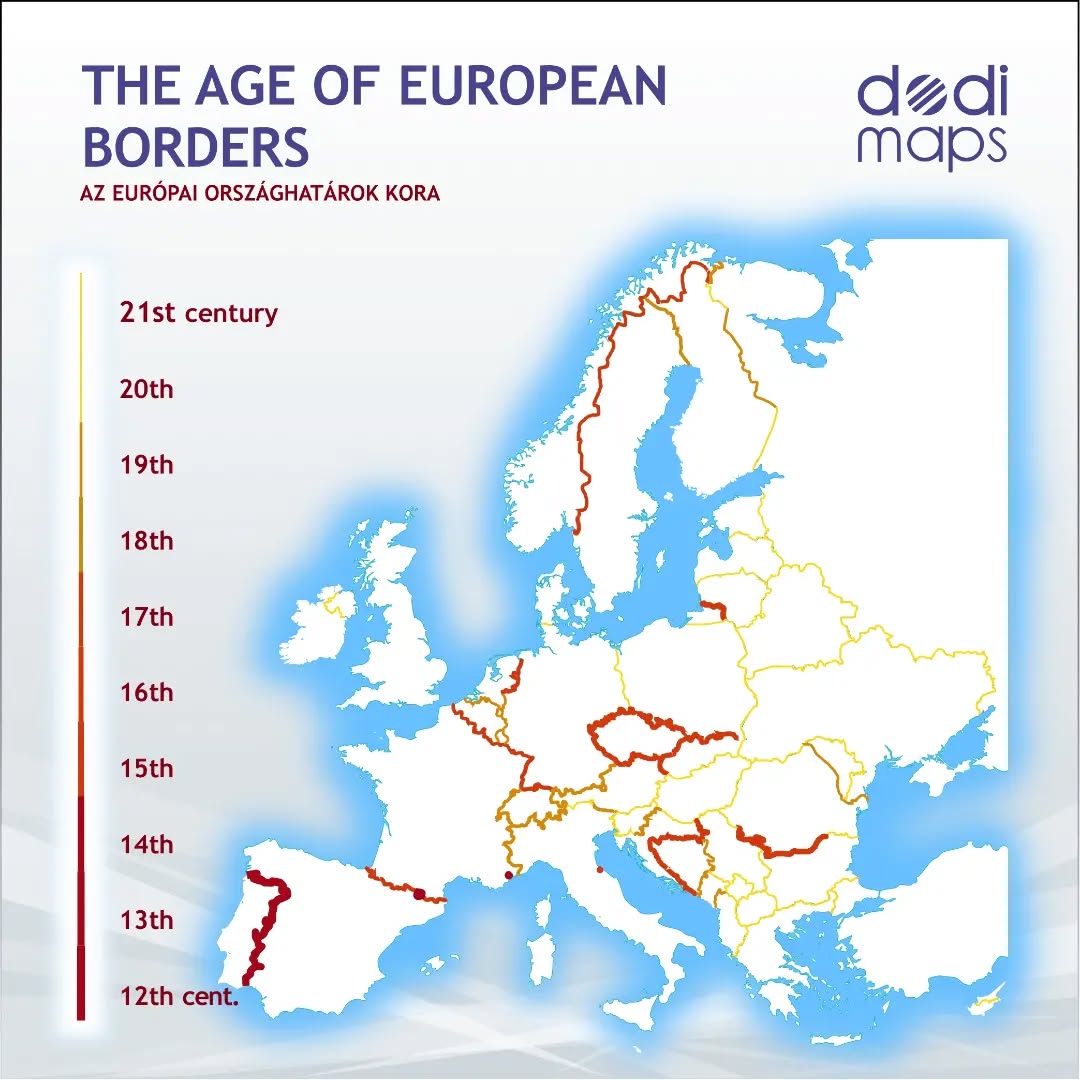
Which one surprises you the most?


Leave a Reply