
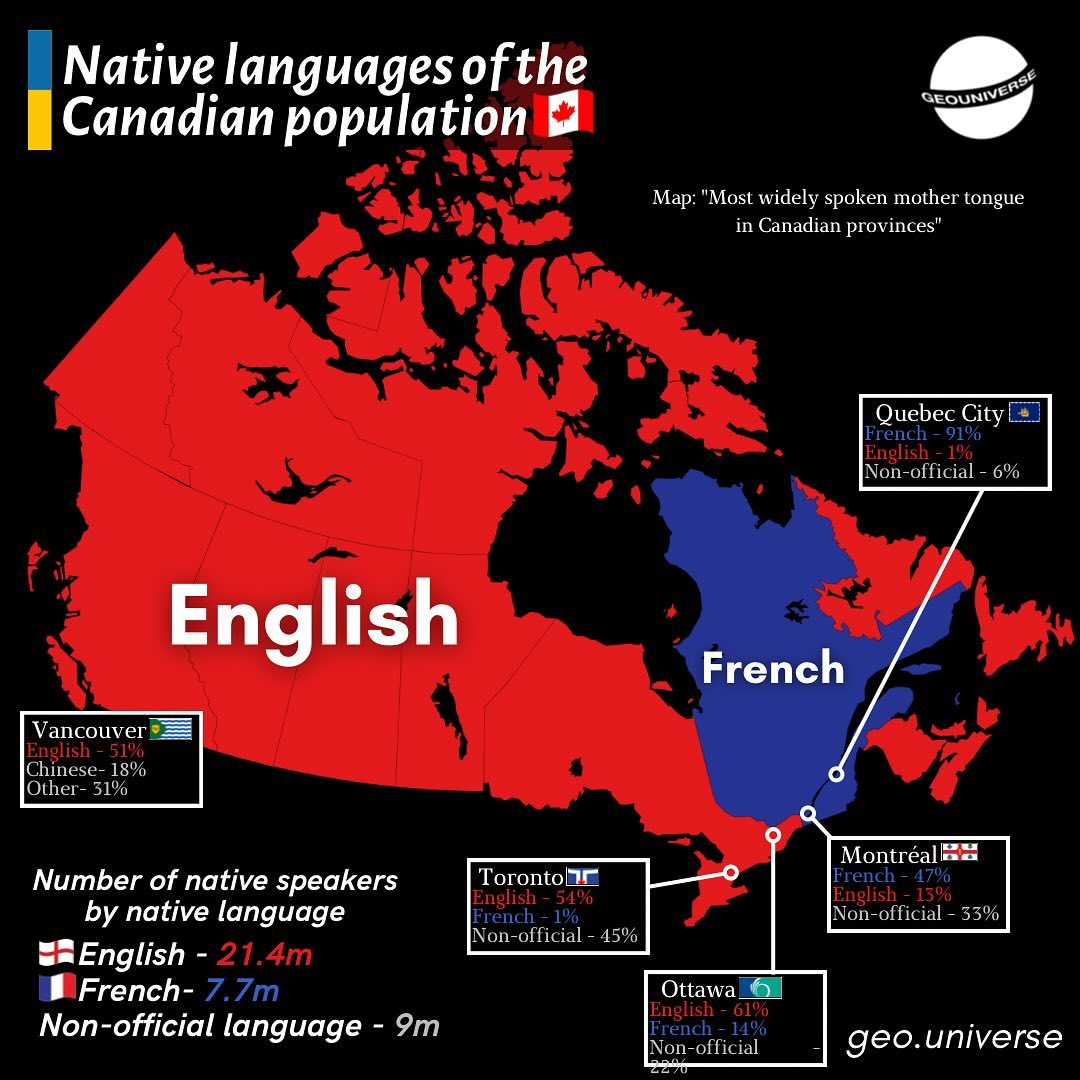
The map is from 2016, but here’s the breakdown of the percentage of people who can speaker English, French or who can speak both (Bilingual Speakers) by province in 2021:
| Province or territory | French-speaking population | English-speaking population | Bilingual population (English and French) |
|---|---|---|---|
| Newfoundland and Labrador | 2,283 (0.5%) | 501,818 (99.4%) | 25,950 (5.1%) |
| Prince Edward Island | 4,558 (3.0%) | 146,473 (96.1%) | 19,385 (12.7%) |
| Nova Scotia | 27,935 (2.9%) | 928,020 (96.8%) | 98,940 (10.3%) |
| New Brunswick | 231,850 (30.3%) | 531,070 (69.5%) | 260,120 (34.0%) |
| Quebec | 7,074,328 (84.1%) | 1,253,578 (14.9%) | 3,898,980 (46.4%) |
| Ontario | 533,560 (3.8%) | 13,228,670 (93.8%) | 1,519,365 (10.8%) |
| Manitoba | 38,378 (2.9%) | 1,271,893 (95.9%) | 110,435 (8.3%) |
| Saskatchewan | 12,243 (1.1%) | 1,095,598 (98.2%) | 51,970 (4.7%) |
| Alberta | 72,203 (1.7%) | 4,085,898 (96.8%) | 258,335 (6.1%) |
| British Columbia | 65,568 (1.3%) | 4,727,268 (95.5%) | 326,865 (6.6%) |
| Yukon | 1,895 (4.8%) | 37,805 (94.9%) | 5,660 (14.2%) |
| Northwest Territories | 1,213 (3.0%) | 39,133 (96.5%) | 4,295 (10.6%) |
| Nunavut | 623 (1.7%) | 34,003 (92.8%) | 1,390 (3.8%) |
| Total | 8,066,633 (22.0%) | 27,881,228 (76.1%) | 6,581,680 (18.0%) |
Source: StatsCan
And here’s the breakdown of Canada’s 4 biggest cities:
- Toronto:
- English: 51%
- French: 1%
- Other: 44%
- Montreal:
- English: 17%
- French: 46%
- Other: 33%
- Vancouver:
- English: 54%
- French: 1%
- Other: 42%
- Ottawa:
- English: 61%
- French: 14%
- Other: 22%
Now the numbers above are only for number of people who can speak the two official languages in Canada: English and French.
Many Canadians have another language as their mother tongue and here’s how those numbers breakdown by province:
| Province/territory | Total population | English | % | French | % | Other languages | % | Official language(s) |
|---|---|---|---|---|---|---|---|---|
| Ontario | 13,312,870 | 9,255,660 | 69.52% | 568,345 | 4.27% | 3,865,780 | 29.04% | English (de facto) |
| Quebec | 8,066,555 | 718,985 | 8.91% | 6,377,080 | 79.06% | 1,173,345 | 14.54% | French |
| British Columbia | 4,598,415 | 3,271,425 | 71.14% | 71,705 | 1.56% | 1,360,815 | 29.59% | English (de facto) |
| Alberta | 4,026,650 | 3,080,865 | 76.51% | 86,705 | 2.15% | 952,790 | 23.66% | English |
| Manitoba | 1,261,615 | 931,410 | 73.83% | 46,055 | 3.65% | 316,120 | 25.06% | English |
| Saskatchewan | 1,083,240 | 910,865 | 84.09% | 17,735 | 1.64% | 173,475 | 16.01% | English |
| Nova Scotia | 912,300 | 838,055 | 91.86% | 33,345 | 3.66% | 49,165 | 5.39% | English (de facto) |
| New Brunswick | 736,280 | 481,690 | 65.42% | 238,865 | 32.44% | 25,165 | 3.42% | English, French |
| Newfoundland and Labrador | 515,680 | 501,350 | 97.22% | 3,020 | 0.59% | 13,035 | 2.53% | English (de facto) |
| Prince Edward Island | 141,020 | 128,975 | 91.46% | 5,395 | 3.83% | 7,670 | 5.44% | English (de facto) |
| Northwest Territories | 41,380 | 32,545 | 78.65% | 1,365 | 3.30% | 8,295 | 20.05% | Cree, Dënësųłıné, Dene Yatıé / Zhatıé, English, French, Gwich’in, Inuinnaqtun, Inuktitut, Inuvialuktun, Sahtúgot’įné Yatı̨́ / K’ashógot’įne Goxedǝ́ / Shíhgot’įne Yatı̨́, Tłįchǫ |
| Yukon | 35,555 | 29,765 | 83.72% | 1,815 | 5.10% | 4,665 | 13.12% | English, French |
| Nunavut | 35,695 | 11,745 | 32.90% | 640 | 1.79% | 24,050 | 67.38% | Inuit Language (Inuktitut, Inuinnaqtun), English, French |
| Canada | 34,767,255 | 20,193,340 | 58.08% | 7,452,075 | 21.43% | 7,974,375 | 22.94% | English, French |
And here’s how they breakdown by total number of speakers:
| Language | Total Number of Speakers | Percent of Canada's Population |
|---|---|---|
| English | 31,628,570 | 87.06% |
| French | 10,563,235 | 29.08% |
| Chinese Languages (Mandarin, Cantonese and others) | 1,528,860 | 4.21% |
| Hindi and/or Urdu | 1,176,295 | 3.24% |
| Spanish | 1,171,450 | 3.22% |
| Punjabi | 942,170 | 2.59% |
| Arabic | 838,045 | 2.31% |
| Tagalog | 737,565 | 2.03% |
| Italian | 547,655 | 1.51% |
| German | 419,195 | 1.15% |
| Portuguese | 336,865 | 0.93% |
| Persian | 330,725 | 0.91% |
| Russian | 309,235 | 0.85% |
| Tamil | 237,890 | 0.65% |
| Vietnamese | 232,800 | 0.64% |
| Gujarati | 209,410 | 0.58% |
| Polish | 204,460 | 0.56% |
| Korean | 203,885 | 0.56% |
| Serbo-Croatian | 155,775 | 0.43% |
| Greek | 145,060 | 0.40% |
| Haitian Creole | 134,895 | 0.37% |
| Ukrainian | 131,655 | 0.36% |
| Bengali | 120,605 | 0.33% |
| Romanian | 116,520 | 0.32% |
| Dutch | 107,985 | 0.30% |
| Cree | 105,850 | 0.29% |
| Japanese | 98,070 | 0.27% |
| Hebrew | 83,205 | 0.23% |
| Turkish | 78,500 | 0.22% |
| Malayalam | 77,910 | 0.21% |
| Hungarian | 64,625 | 0.18% |
| Ilocano | 61,680 | 0.17% |
| Somali | 59,005 | 0.16% |
| Swahili | 57,295 | 0.16% |
| Telugu | 54,685 | 0.15% |
However, as the map at the top shows there are also many Indigenous languages found in Canada as can be seen on the following map:

| Province/Territory | Percentage of Population (%) | Number of Speakers |
|---|---|---|
| Nunavut (NU) | 69.6 | 25,655 |
| Northwest Territories (NT) | 12.2 | 5,385 |
| Saskatchewan (SK) | 3.1 | 35,070 |
| Manitoba (MB) | 2.56 | 34,400 |
| Yukon (YT) | 2.04 | 822 |
| Alberta (AB) | 0.77 | 32,905 |
| Nova Scotia (NS) | 0.61 | 5,930 |
| Quebec (QC) | 0.59 | 50,165 |
| Newfoundland and Labrador (NL) | 0.52 | 2,670 |
| New Brunswick (NB) | 0.39 | 3,570 |
| Prince Edward Island (PE) | 0.39 | 150 |
| British Columbia (BC) | 0.33 | 16,555 |
| Ontario (ON) | 0.21 | 29,845 |
| Canada (total) | 0.65 | 243122 |
10 Most Common Indigenous languages of Canada
| Indigenous languages | No. of speakers | Mother tongue | Home language |
|---|---|---|---|
| Cree | 99,950 | 78,855 | 47,190 |
| Inuktitut | 35,690 | 32,010 | 25,290 |
| Ojibwemowin | 32,460 | 11,115 | 11,115 |
| Innu–Naskapi | 11,815 | 10,970 | 9,720 |
| Denesuline | 11,130 | 9,750 | 7,490 |
| Oji-Cree (Anishininimowin) | 12,605 | 8,480 | 8,480 |
| Mi'kmawi'simk | 8,750 | 7,365 | 3,985 |
| Siouan languages (Dakota/Nakota) | 6,495 | 5,585 | 3,780 |
| Atikamekw | 5,645 | 5,245 | 4,745 |
| Blackfoot | 4,915 | 3,085 | 3,085 |
And here’s a final language map of Canada:


Leave a Reply