
Key Features of the Map:
- Color Scale: The map uses a gradient color scale ranging from purple (indicating the fewest comfortable days) to red (indicating the most comfortable days). Specifically:
- Purple/Blue Zones (0-100 days): Represent areas with few comfortable days.
- Green/Yellow Zones (100-300 days): Represent areas with a moderate number of comfortable days.
- Orange/Red Zones (300+ days): Represent areas with a high number of comfortable days.
Geographic Trends:
- Pacific Northwest: “The PNW scores well, but this doesn’t take into account sun or rainy days!”
- West Coast (South Oregon to Oxnard): “The west coast from south Oregon to Oxnard scores the best – 350+ days are comfortable.”
- Southern California (Los Angeles/San Diego): “LA/SD has 280 nice days with inland areas lowering the score – but even the coast has some humid days.”
- Southwest (elevation areas): “Elevation increases the number of nice days in the southwest.”
- Hawaii: “Hawaii is humid for most of the year, ironically making it the 2nd worst state.”
- Alaska: “Alaska ranks the worst of all states.”
- South Texas: “South Texas has the highest heat indices in the mainland US.”
- South Florida: “South Florida is humid for most of the year.”
- Southeast (Upstate South Carolina and Charlotte area): “A southeast optimum band has good weather roughly from Sept-May, peaking at 280 nice days near Upstate SC & Charlotte.”
- Northeast (Boston to Chicago): “A northeast optimum band from Boston to Chicago has nice summers but poor winters. Further north from here, the winters get significantly longer.”
- Philadelphia Area: “A local minimum in Philly where neither winters nor summers are nice – but it’s on the edge so this would change with different thresholds.”
- Central US: “The central US is further from moderating influences and so scores poorly.”
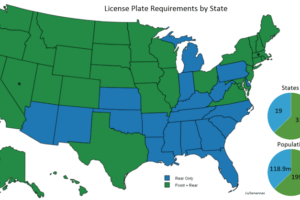
What do you think the best place to live in the US is?


Leave a Reply