
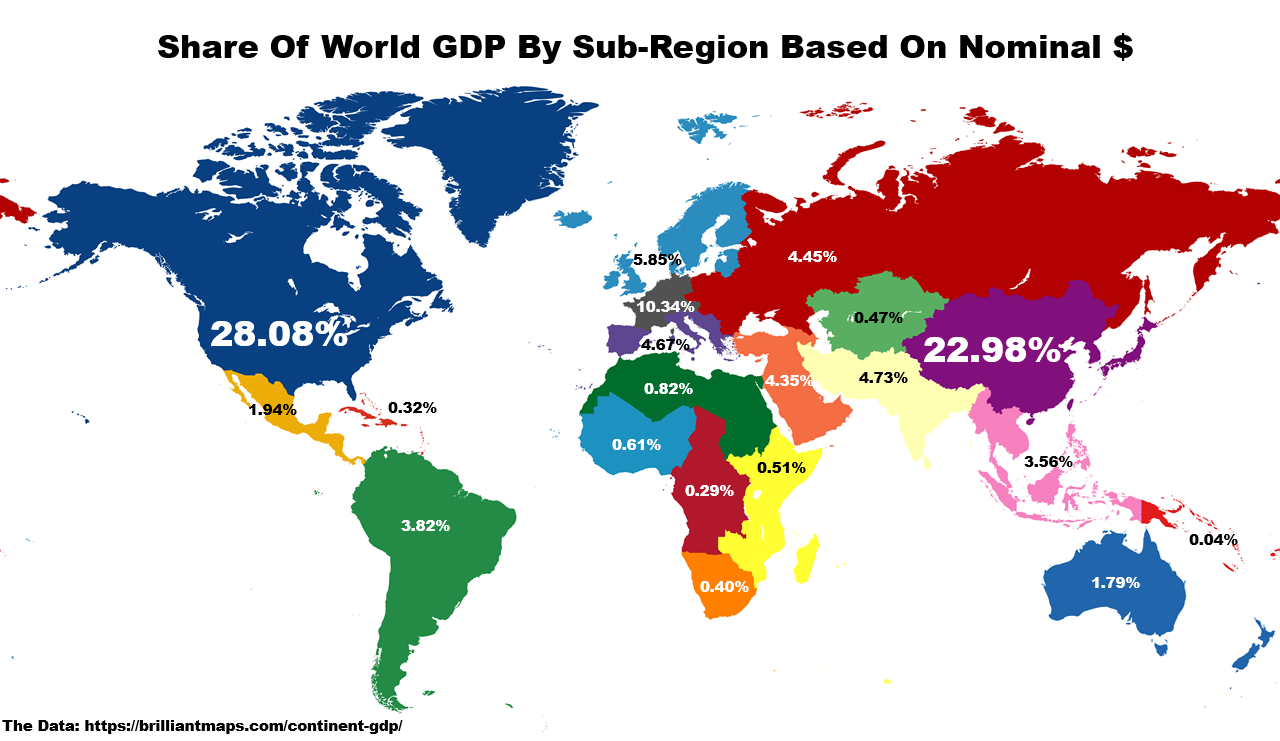
The map above shows the share of world GDP for each continent in the world based on nominal exchange rates.
In total, World GDP was $117.165 Trillion $ USD. (Or $208 Trillion in PPP)
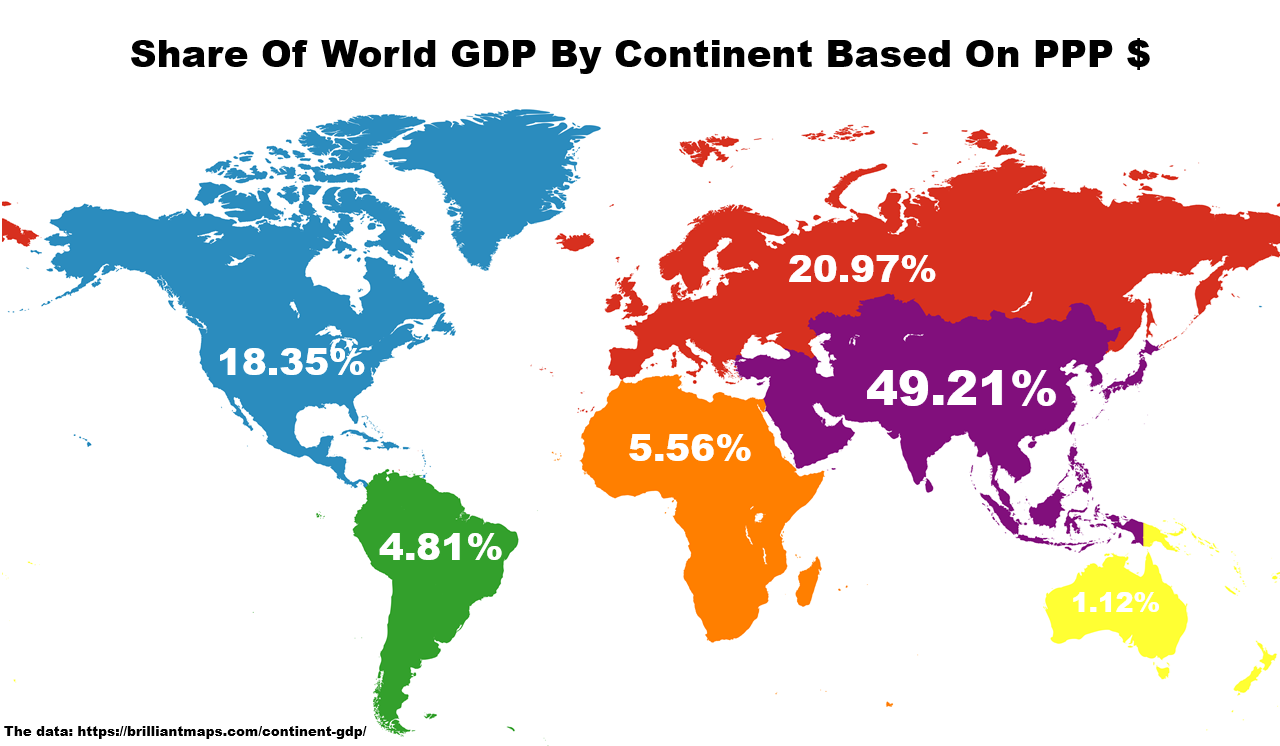
Below you can see data in PPP $ and maps and data based on UN Subregions.
Share Of World GDP By Continent Based On PPP $
Share Of World GDP By Subregions Based On Nominal $
Share Of World GDP By Subregions Based On PPP $

The Data By Continent
| Continent | GDP (Nominal) (Trillions of $) | Nominal Share(%) | GDP (PPP) (Trillions of Int. $) | PPP Share(%) |
|---|---|---|---|---|
| Asia | $42.279 | 36.08% | $102.830 | 49.21% |
| North America | $35.550 | 30.34% | $38.339 | 18.35% |
| Europe | $29.650 | 25.31% | $43.813 | 20.97% |
| South America | $4.476 | 3.82% | $10.057 | 4.81% |
| Africa | $3.071 | 2.62% | $11.612 | 5.56% |
| Oceania | $2.138 | 1.82% | $2.350 | 1.12% |
| World | $117.165 | 100% | $208.956 | 100% |
The Data By Subregion
| Subregion | GDP (Nominal) (billions of $) | Nominal Share(%) | GDP (PPP) (billions of Int. $) | Share(%) PPP |
|---|---|---|---|---|
| Northern America | $32,899.34 | 28.08% | $33,338.54 | 15.95% |
| Eastern Asia | $26,927.08 | 22.98% | $53,888.04 | 25.79% |
| Western Europe | $12,111.55 | 10.34% | $14,832.89 | 7.10% |
| Northern Europe | $6,859.03 | 5.85% | $7,883.62 | 3.77% |
| Southern Asia | $5,540.87 | 4.73% | $23,695.85 | 11.34% |
| Southern Europe | $5,476.55 | 4.67% | $8,388.21 | 4.01% |
| Eastern Europe | $5,211.89 | 4.45% | $12,716.25 | 6.09% |
| Western Asia | $5,094.86 | 4.35% | $10,439.92 | 5.00% |
| South America | $4,476.38 | 3.82% | $10,057.12 | 4.81% |
| South-Eastern Asia | $4,169.46 | 3.56% | $13,140.71 | 6.29% |
| Central America | $2,276.65 | 1.94% | $4,331.62 | 2.07% |
| Australia and New Zealand | $2,092.42 | 1.79% | $2,278.64 | 1.09% |
| Northern Africa | $959.80 | 0.82% | $4,120.82 | 1.97% |
| Western Africa | $709.95 | 0.61% | $3,426.78 | 1.64% |
| Eastern Africa | $598.63 | 0.51% | $1,937.45 | 0.93% |
| Central Asia | $546.84 | 0.47% | $1,665.87 | 0.80% |
| Southern Africa | $467.85 | 0.40% | $1,139.86 | 0.55% |
| Caribbean | $374.20 | 0.32% | $669.28 | 0.32% |
| Middle Africa | $334.49 | 0.29% | $986.68 | 0.47% |
| Melanesia | $42.07 | 0.04% | $66.59 | 0.03% |
| Polynesia | $1.89 | 0% | $2.61 | 0% |
| Micronesia | $1.63 | 0% | $1.69 | 0% |
| World | $117,165.39 | 100% | $208,956.28 | 100% |
All data is based on 2025 IMF figures accessed from StatisticsTimes.com.
Which one surprises you the most?


Leave a Reply