
The 3 areas in blue above, contain roughly 50% of Australia’s population, which means that the area in white contains the other 50%.
For those that don’t know their Australian geography the 3 areas are:
- Sydney: 4,840,628 (20.61% of Australia’s population)
- Melbourne: 4,440,328 (18.90%)
- Brisbane: 2,274,460 (9.68%)
Total: 11,555,416 (49.19%)
So to be fair it’s just under half live in those three areas but how does this compare to other countries?
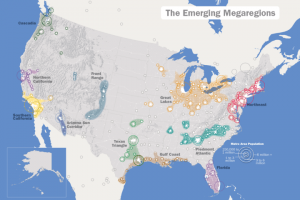
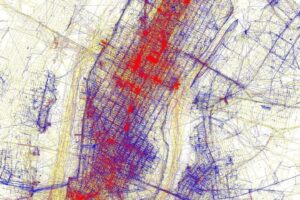
United States (by metropolitan area):
- New York: 20,092,883 (6.3%)
- Los Angeles: 13,262,220 (4.2%)
- Chicago: 9,554,598 (3.0%)
Total: 42,909,701 (almost 2X Australia) but only 13.5% of the US population.
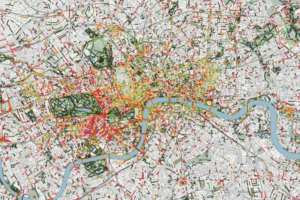
United Kingdom (by urban areas):
- London: 9,787,426 (15.3%)
- Manchester: 2,553,379 (4.0%)
- Birmingham: 2,440,986 (3.8%)
Total: 14,781,791 but only 23.1% of the UK’s population
Canada (by metropolitan area):
- Toronto: 5,583,064 (15.9%)
- Montreal: 3,824,221 (10.9%)
- Vancouver: 2,313,328 (6.6%)
Total: 11,720,613, just slightly more than Australia’s 3 biggest cities, but still only 33.1% of Canada’s population.
New Zealand (by urban areas):
- Auckland: 1,413,700 (31.6%)
- Wellington: 393,600 (8.8%)
- Christchurch: 375,200 (8.4%)
Total: 2,182,500, smaller than even the smallest city above. And, while Auckland is the city with highest proportion of its country’s people, the 3 biggest combined still only make up 48.8% of New Zealand’s population.
Therefore, Australia is somewhat unique for having such a high concentration of it’s population located in its 3 biggest cities.
Please leave your comments below:
Damien Cummins says
If you did another map called “85% of Australia lives here”, or even “90% …”, the shaded areas would not actually grow that much. We’re a land of wide open spaces, “a green-edged desert”, etc., but also on various measures, the most urbanised society in the world.
Tomasz Pluskiewicz says
Yeah, and what would it look like if you added Perth?
Peter Murphy says
Either you need to redraw the map, or you need to be cleared which regions belong to which cities. Sounds like you’ve included Wooloongong, the Gold Coast and Geelong in the blue areas; these are seperate cities to Sydney, Brisbane and Melbourne.
Lushington Brady says
Being from Geelong, it is always galling then Melbourne-based media try and bill the Avalon airshow as being in Melbourne.
Phil says
Fair call. ‘Melbourne’ seems to cover a large chunk. As a Ballarat native I get it.
Zoe says
“The 3 areas in blue above, contain roughly 50% of Australia’s
population, which means that the area in white contains the other 50%.”
There are three different blues on that map!
Rodrigo Almeida says
It’s the one that oulines Australia itself. People there like to live in a “human-cord” type of deal.
Lennerd says
0.4% difference between AU and NZ – not really unique, but a good illustration.
Peter Aird says
Why not just show the entire population on a color scale.
At 50% Australia is not significantly different to NZ.
I suspect Brazil would have similar concentration around its major cities.
At the end of the day, population density is driven by topography and access to the sea and water.
Abili Side says
The three largest metropolitan areas of Brazil correspond to 20% of the country’s population.
Only the metropolitan region of São Paulo, which is the largest, corresponds to half that value.
Willis says
good to know
Graeme says
Oups! These population statistics are for some countries a little bit old.
Sydney, Australia, is now 4 920 970
https://www.populationdata.net/pays/australie/
Toronto, Canada, is now 6,2 M people
Montreal, Canada, is now 4,1 M
https://www.populationdata.net/pays/canada/
Etc.
Phil says
I thought a third of all Aussies lived in Earls Court.
Rose Tierney says
I don’t live in a City in Australia and one of the biggest problems is the lack of infrastructure and services.
bob says
not much different , the island continent of Australia is the driest on earth , it is essentially a desert , the only water is subterranean and deleted by various activities