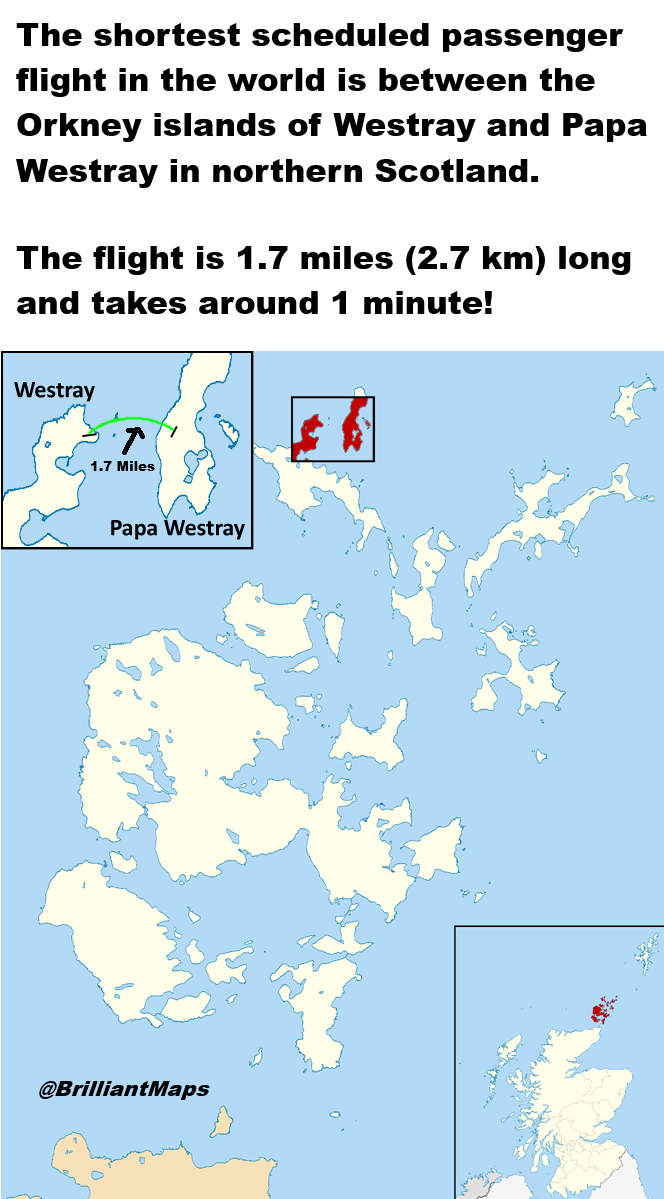
The map above shows the shortest scheduled passenger flight in the world is between the Orkney islands of Westray and Papa Westray in northern Scotland, the flight is 1.7 miles (2.7 km) long and takes around 1 minute!
But why does it exist?
Making Sense Of The World, One Map At A Time
The map above shows the shortest scheduled passenger flight in the world is between the Orkney islands of Westray and Papa Westray in northern Scotland, the flight is 1.7 miles (2.7 km) long and takes around 1 minute!
But why does it exist?
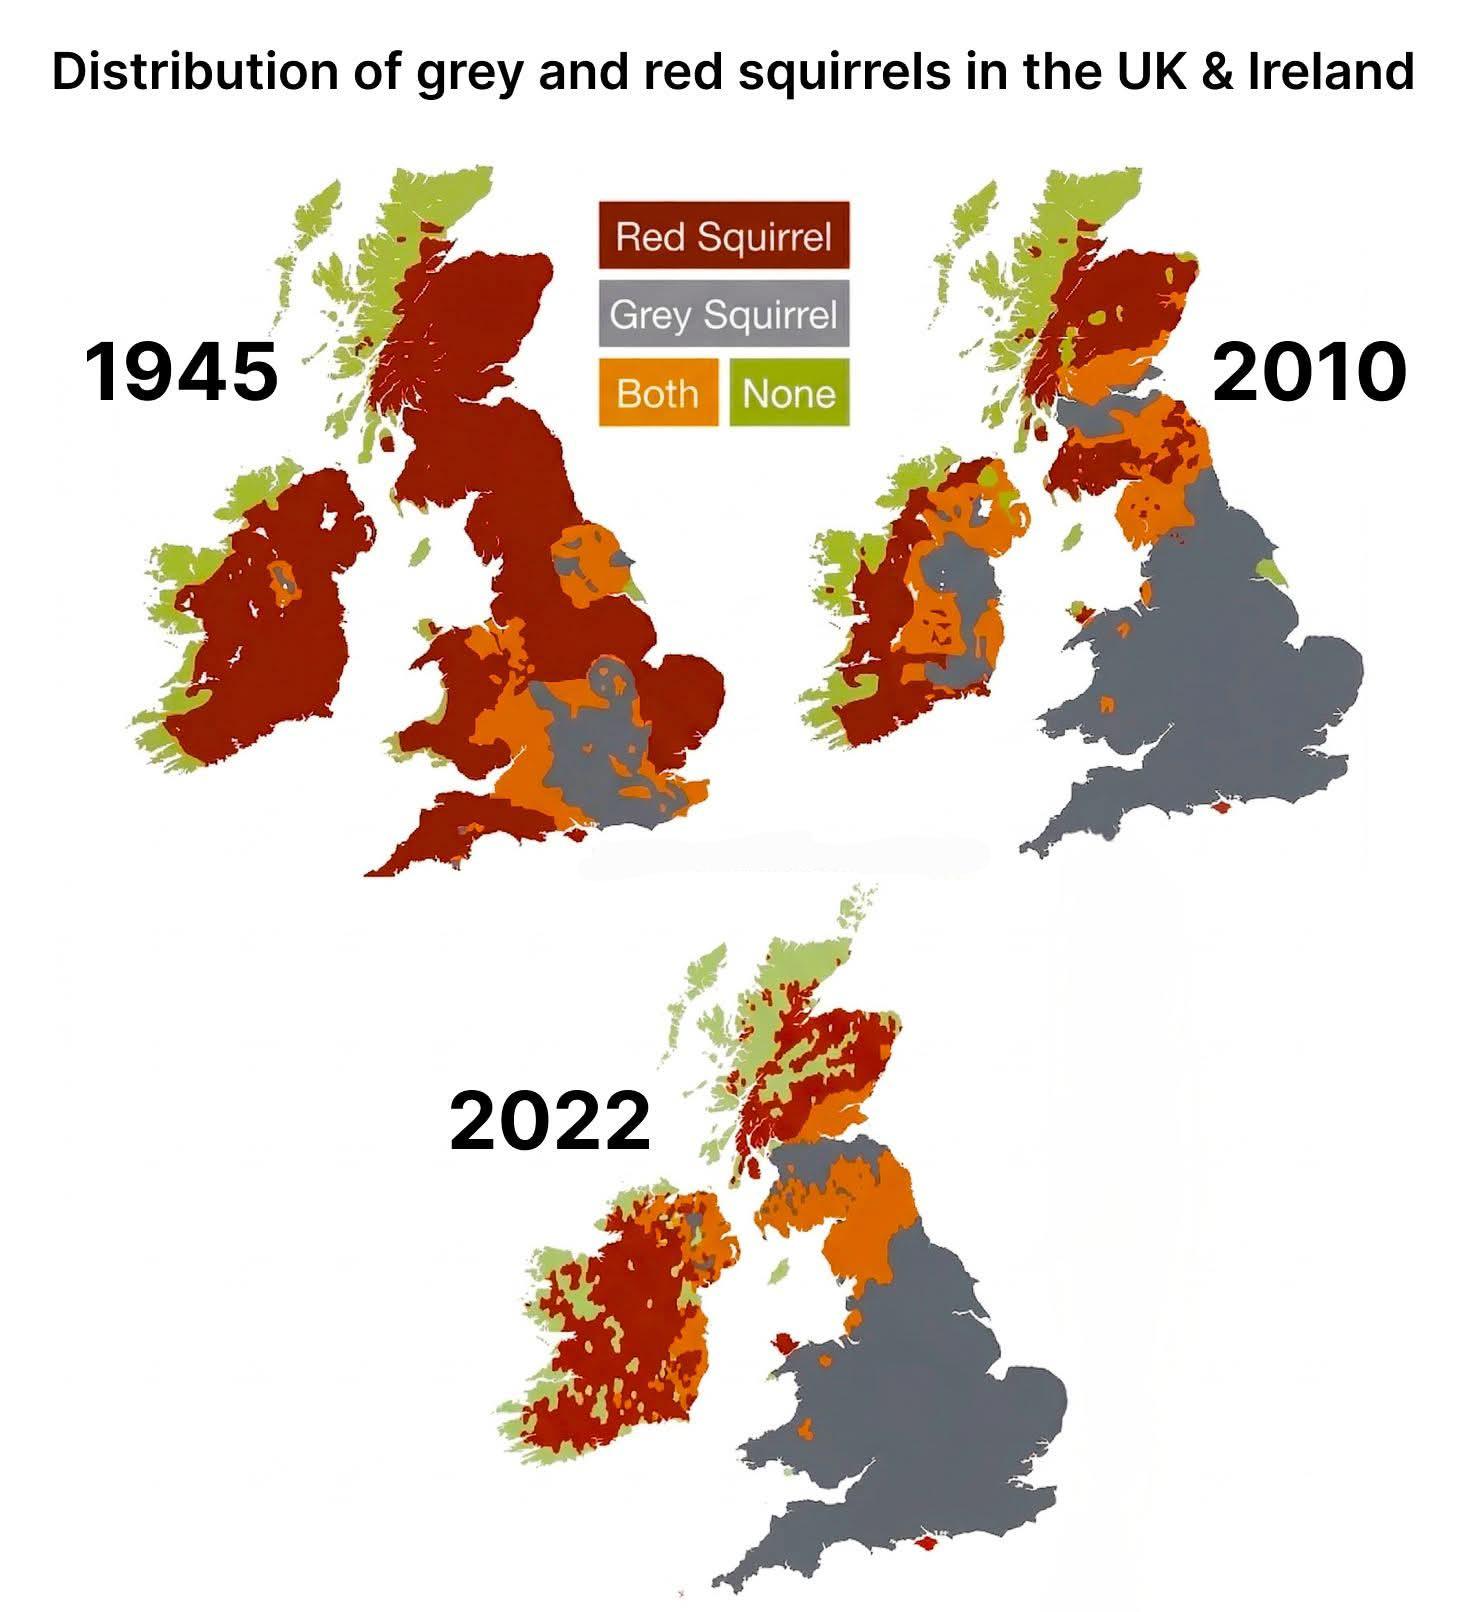
The map above shows the distribution of Grey vs Red Squirrels In The UK & Ireland Between 1945 & 2022.
I’m not 100% sure of the original source of the map a version with 1945 & 2010 can be found on Research Gate here, and I found this version on reddit.
If you created this version of the map please do get in touch so I can provide proper credit.
In the meantime here’s what happened and why:

You can learn more about each section on the National Trails website here.
More about it below:

They explain that:

The map above comes from diamond geezer’s wonderful post about the busiest national rail stations. Amazingly the top 12 stations in the UK are all in London, and most of them are on the central section of the Elizabeth Line.
The reason is quite simple: “Any interchange between tube and Crossrail [Elizabeth Line] counts as entering or exiting a National Rail station so some mighty distortions are skewing the numbers.”
Full list of all UK stations below with rankings (data comes from ORR here):


The map above comes from bustimes.org (click for interactive map) and shows the different colours of buses across the UK and Ireland.
Heres’ why:

Here is more about all of them:

The map above looks at the change in demographics on the island of Ireland in 1841 (just before the Great potatoes famine) and 2021/22 the date of the last censuses for the two parts of the island today.
In 1841 the island was firmly part of the United Kingdom of Great Britain and Ireland. Today the island is divided between the Republic of Ireland and Northern Ireland (part of the United Kingdom).
More about the comparison below:

You can see an interactive version of the map here which includes the location of 1,000 castles.
Or buy a map here.
Also from the author: