The maps below show the most common non-English languages (or non-Welsh in Wales) spoken at home across local authorities in England and Wales.
The data comes from the 2021 UK Census.
At the bottom you’ll find a list of the top 3 foreign languages by local authority.
Number of Welsh speakers (outside of Wales)
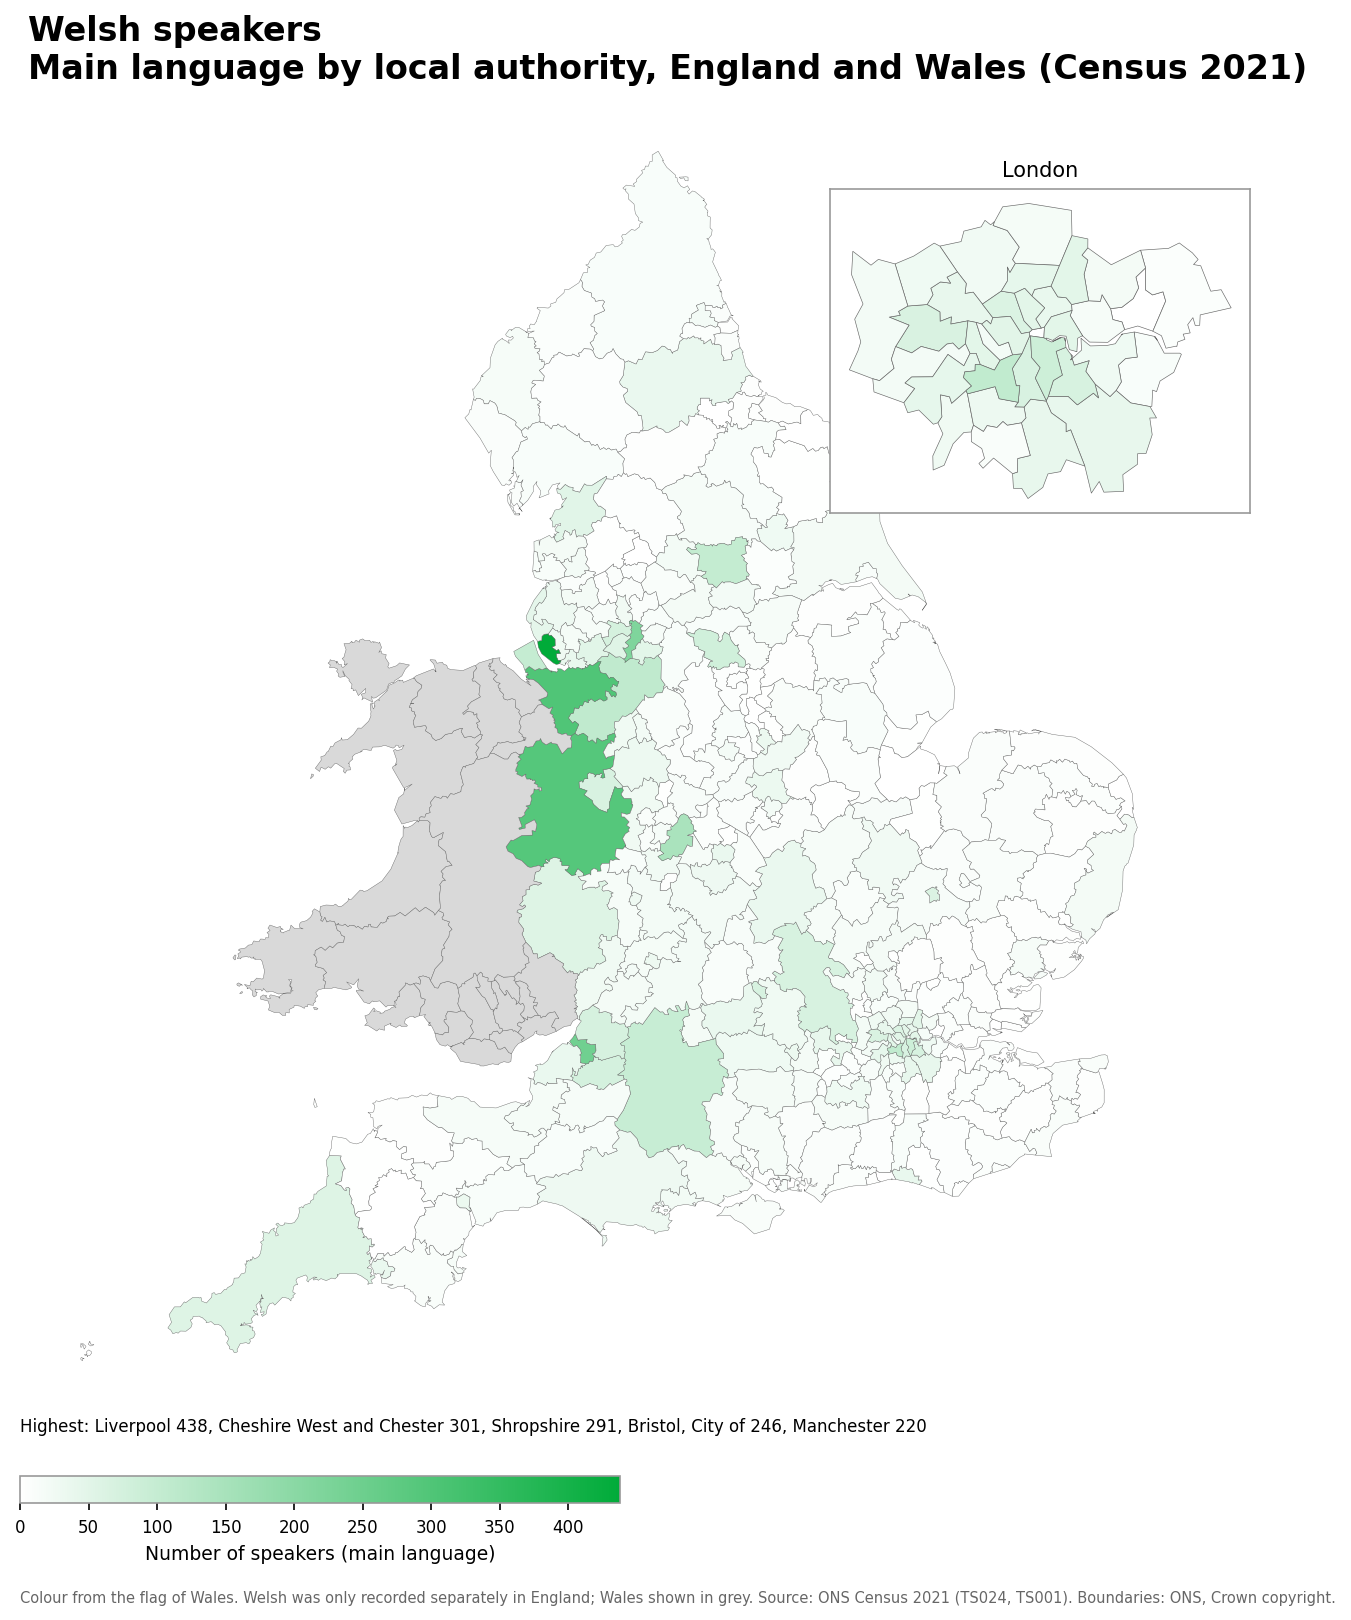
- Liverpool: 438
- Cheshire West and Chester: 301
- Shropshire: 291
- Bristol: 246
- Manchester: 220
Welsh speakers as a share of the population
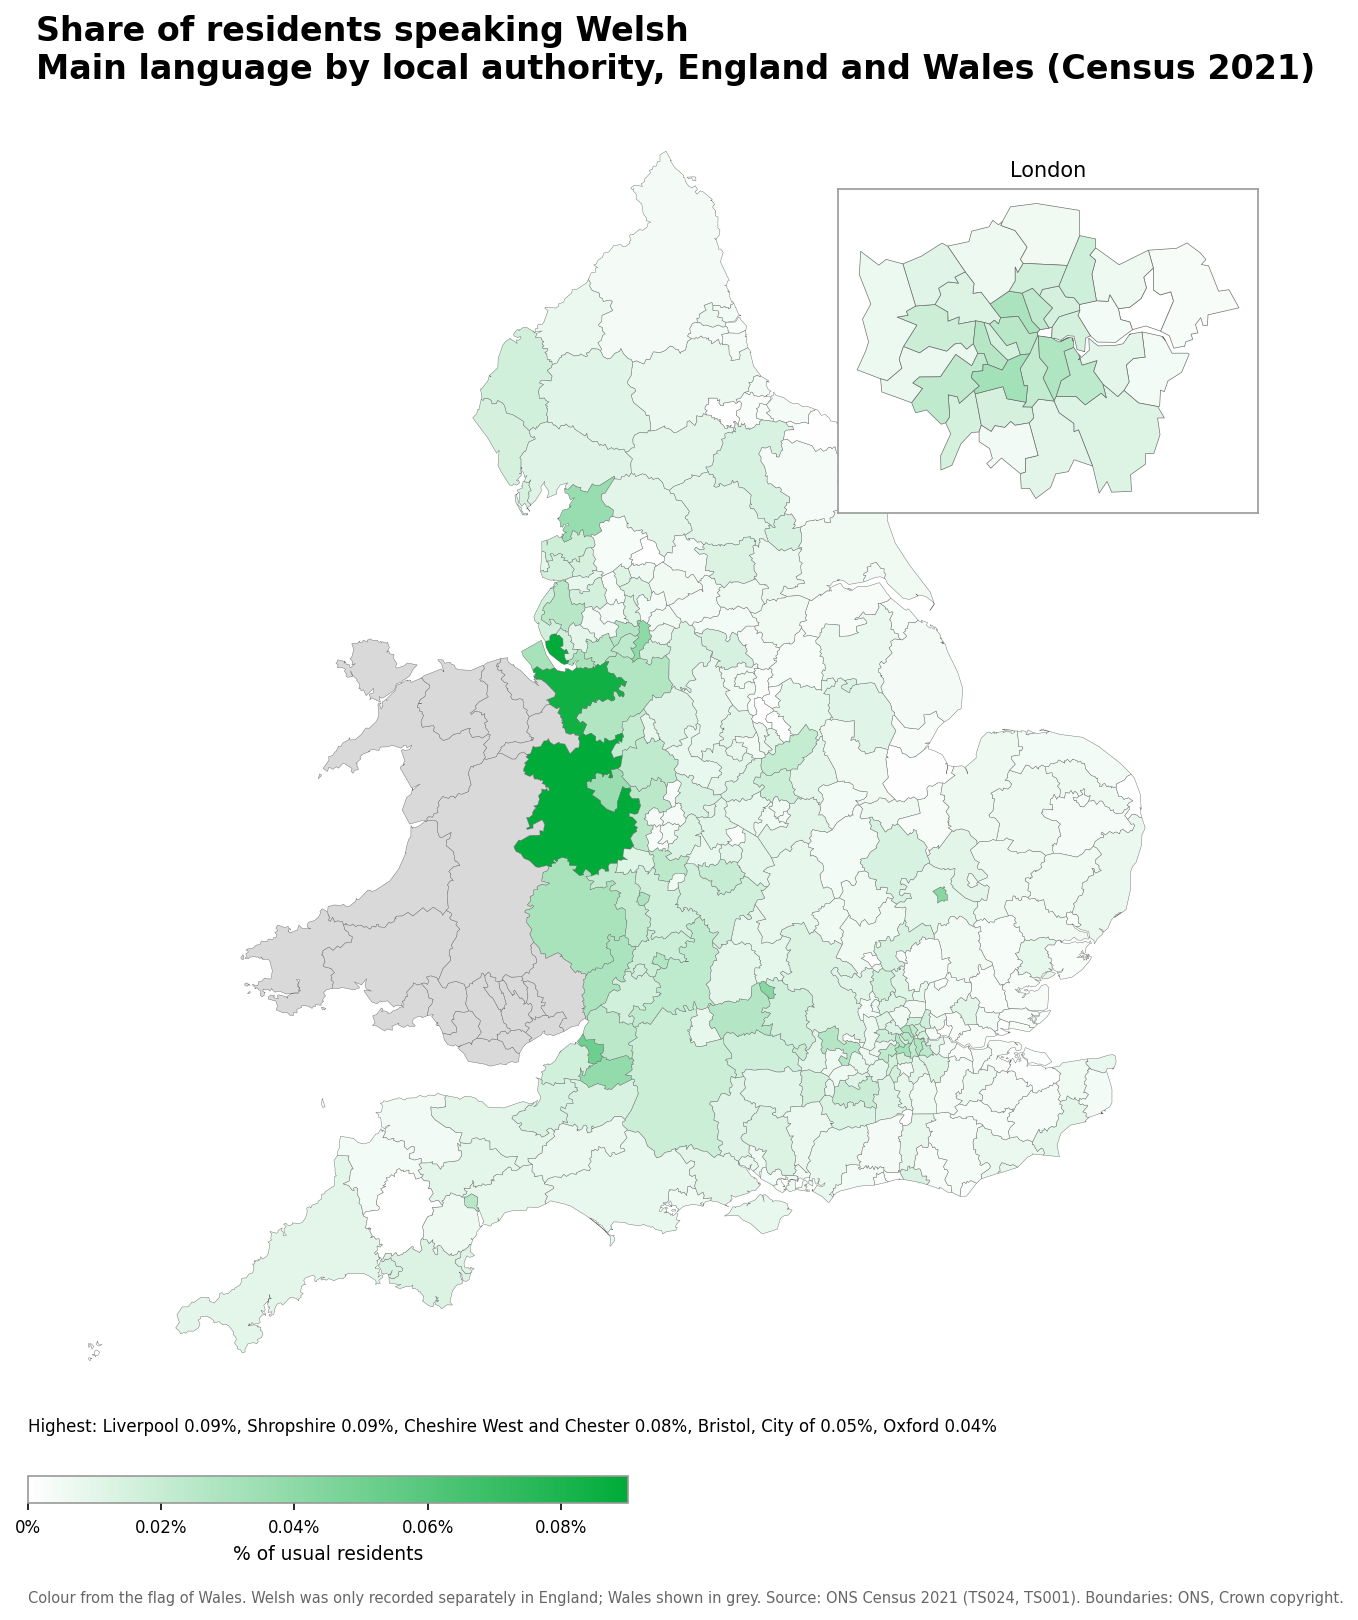
- Liverpool: 0.09% (438 speakers)
- Shropshire: 0.09% (291 speakers)
- Cheshire West and Chester: 0.08% (301 speakers)
- Bristol: 0.05% (246 speakers)
- Oxford: 0.04% (69 speakers)
Number of Irish speakers
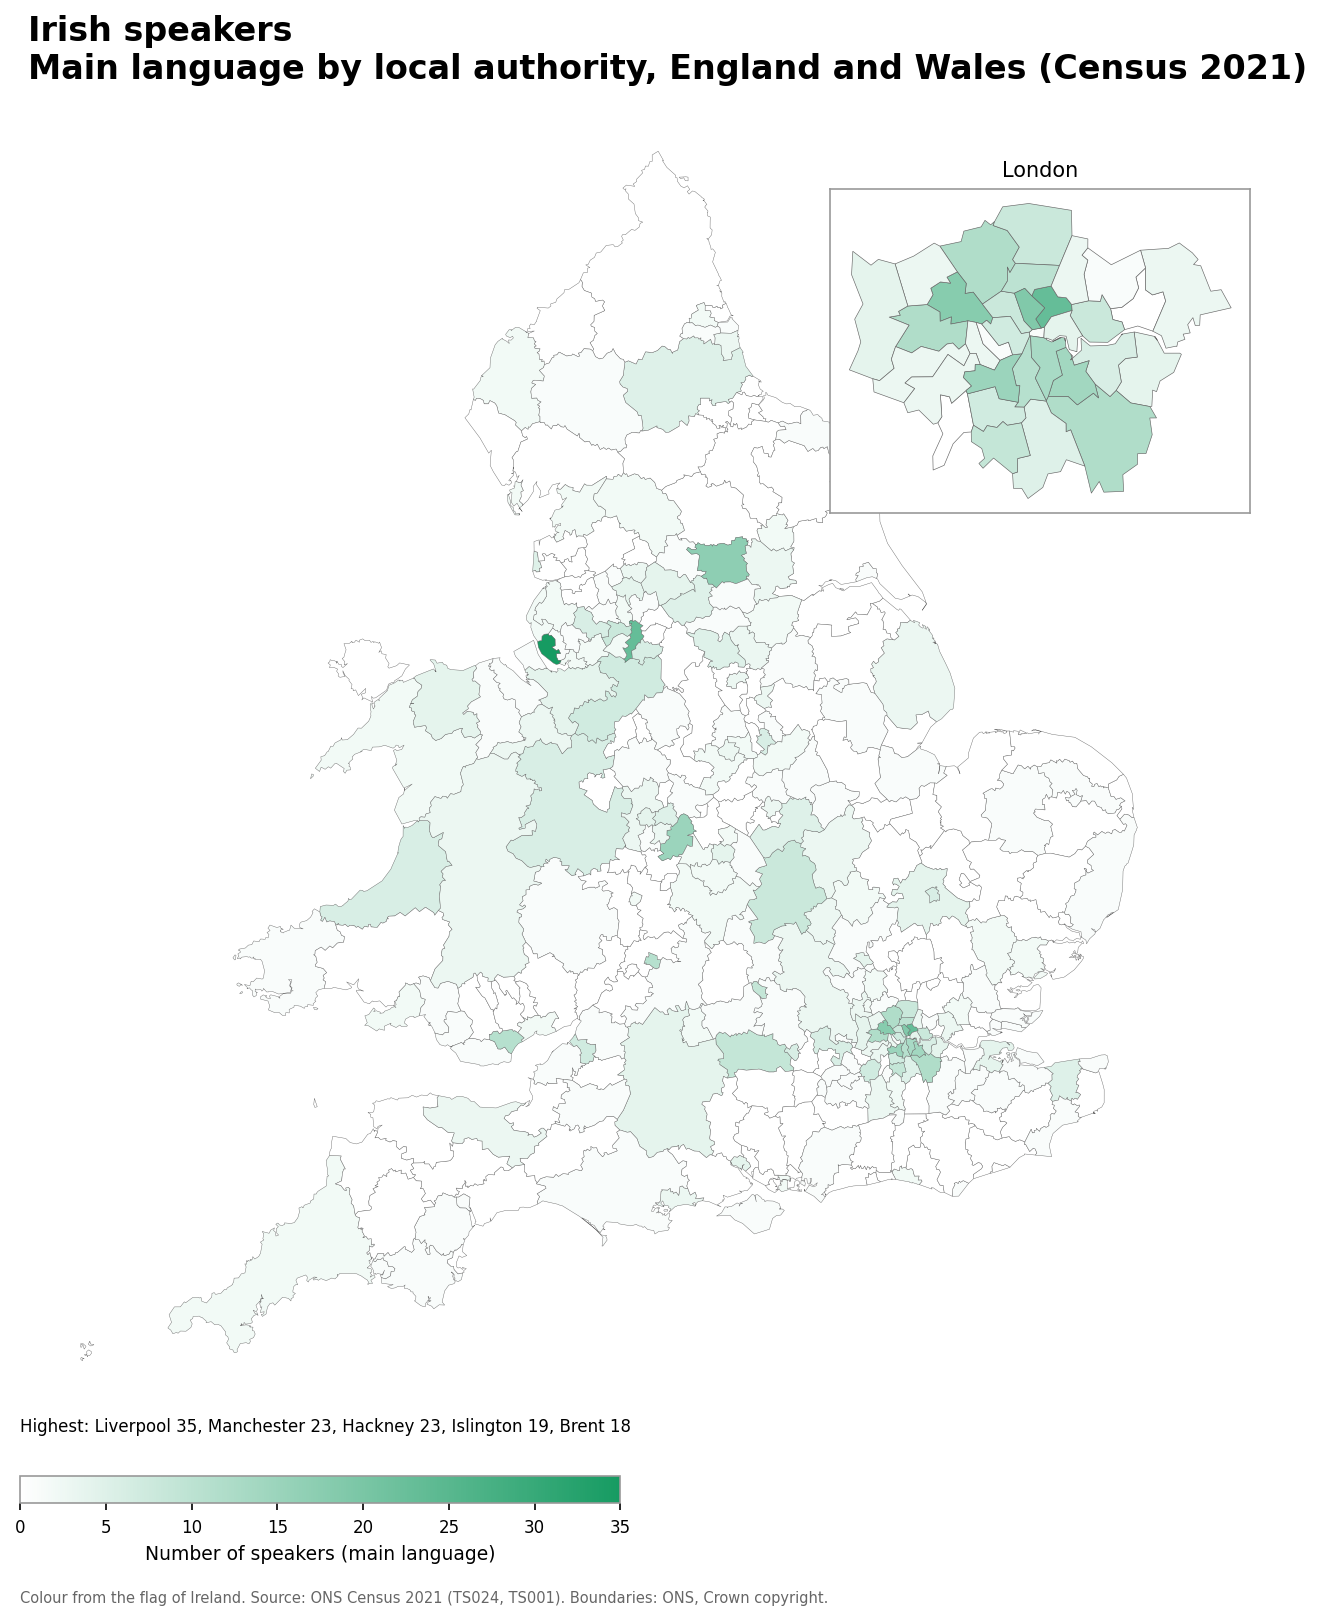
- Liverpool: 35
- Manchester: 23
- Hackney: 23
- Islington: 19
- Brent: 18
Irish speakers as a share of the population
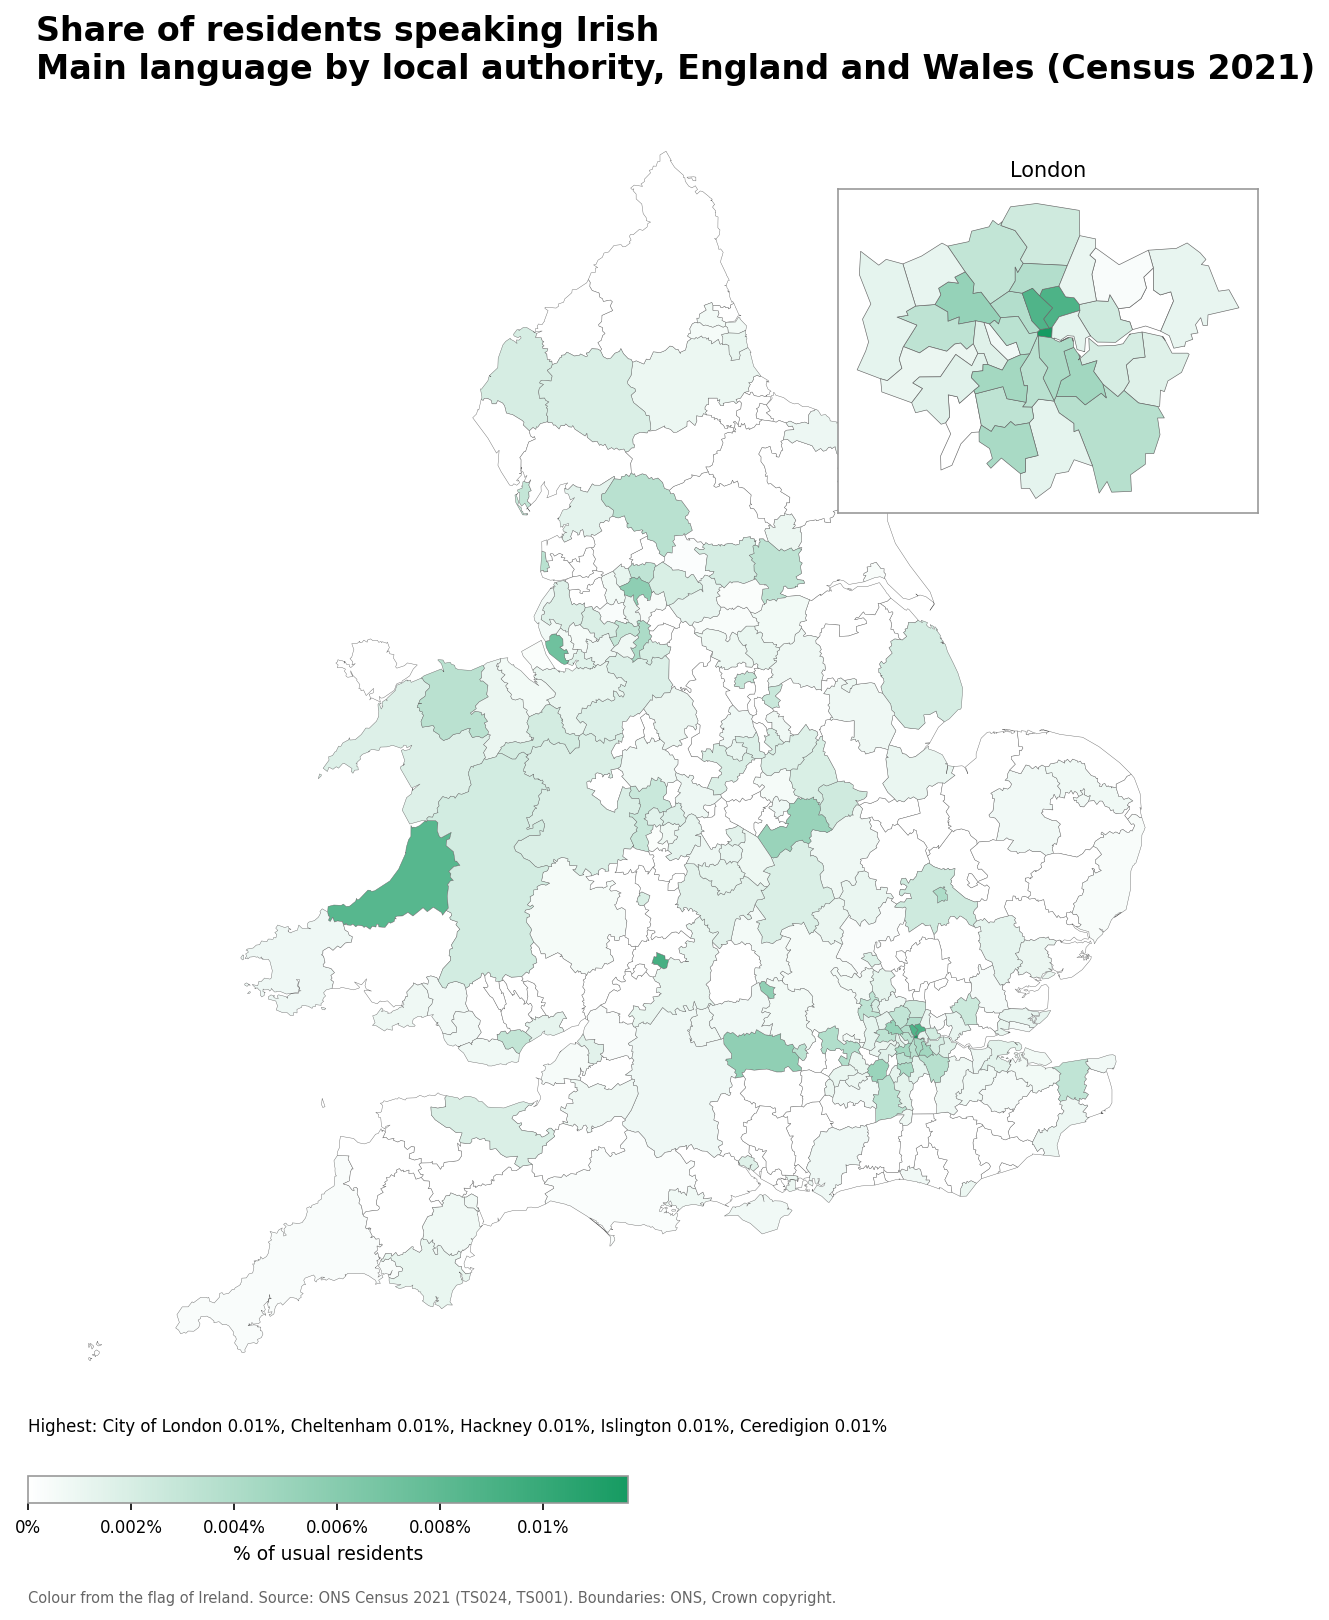
- City of London: 0.01% (1 speakers)
- Cheltenham: 0.01% (11 speakers)
- Hackney: 0.01% (23 speakers)
- Islington: 0.01% (19 speakers)
- Ceredigion: 0.01% (6 speakers)
Number of Scottish Gaelic speakers
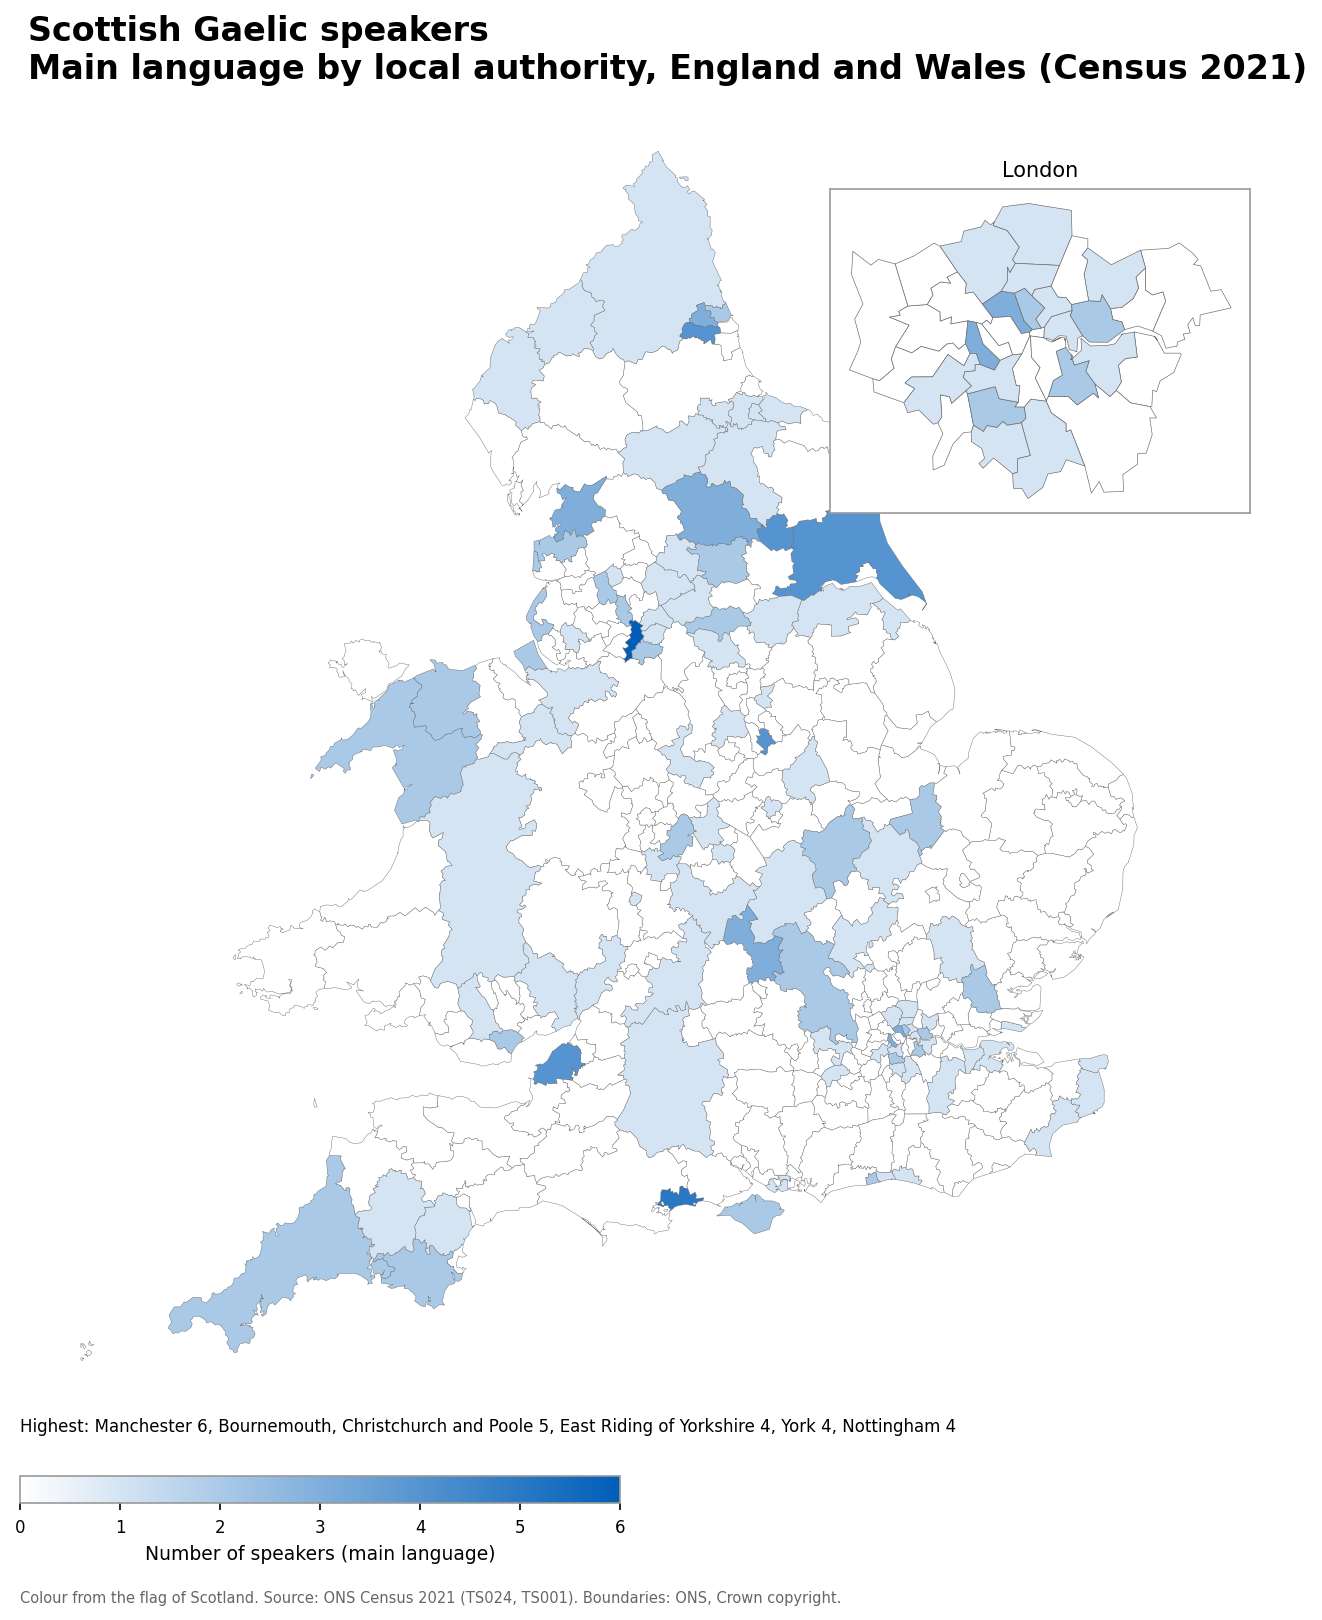
- Manchester: 6
- Bournemouth, Christchurch and Poole: 5
- East Riding of Yorkshire: 4
- York: 4
- North Somerset: 4
Scottish Gaelic speakers as a share of the population
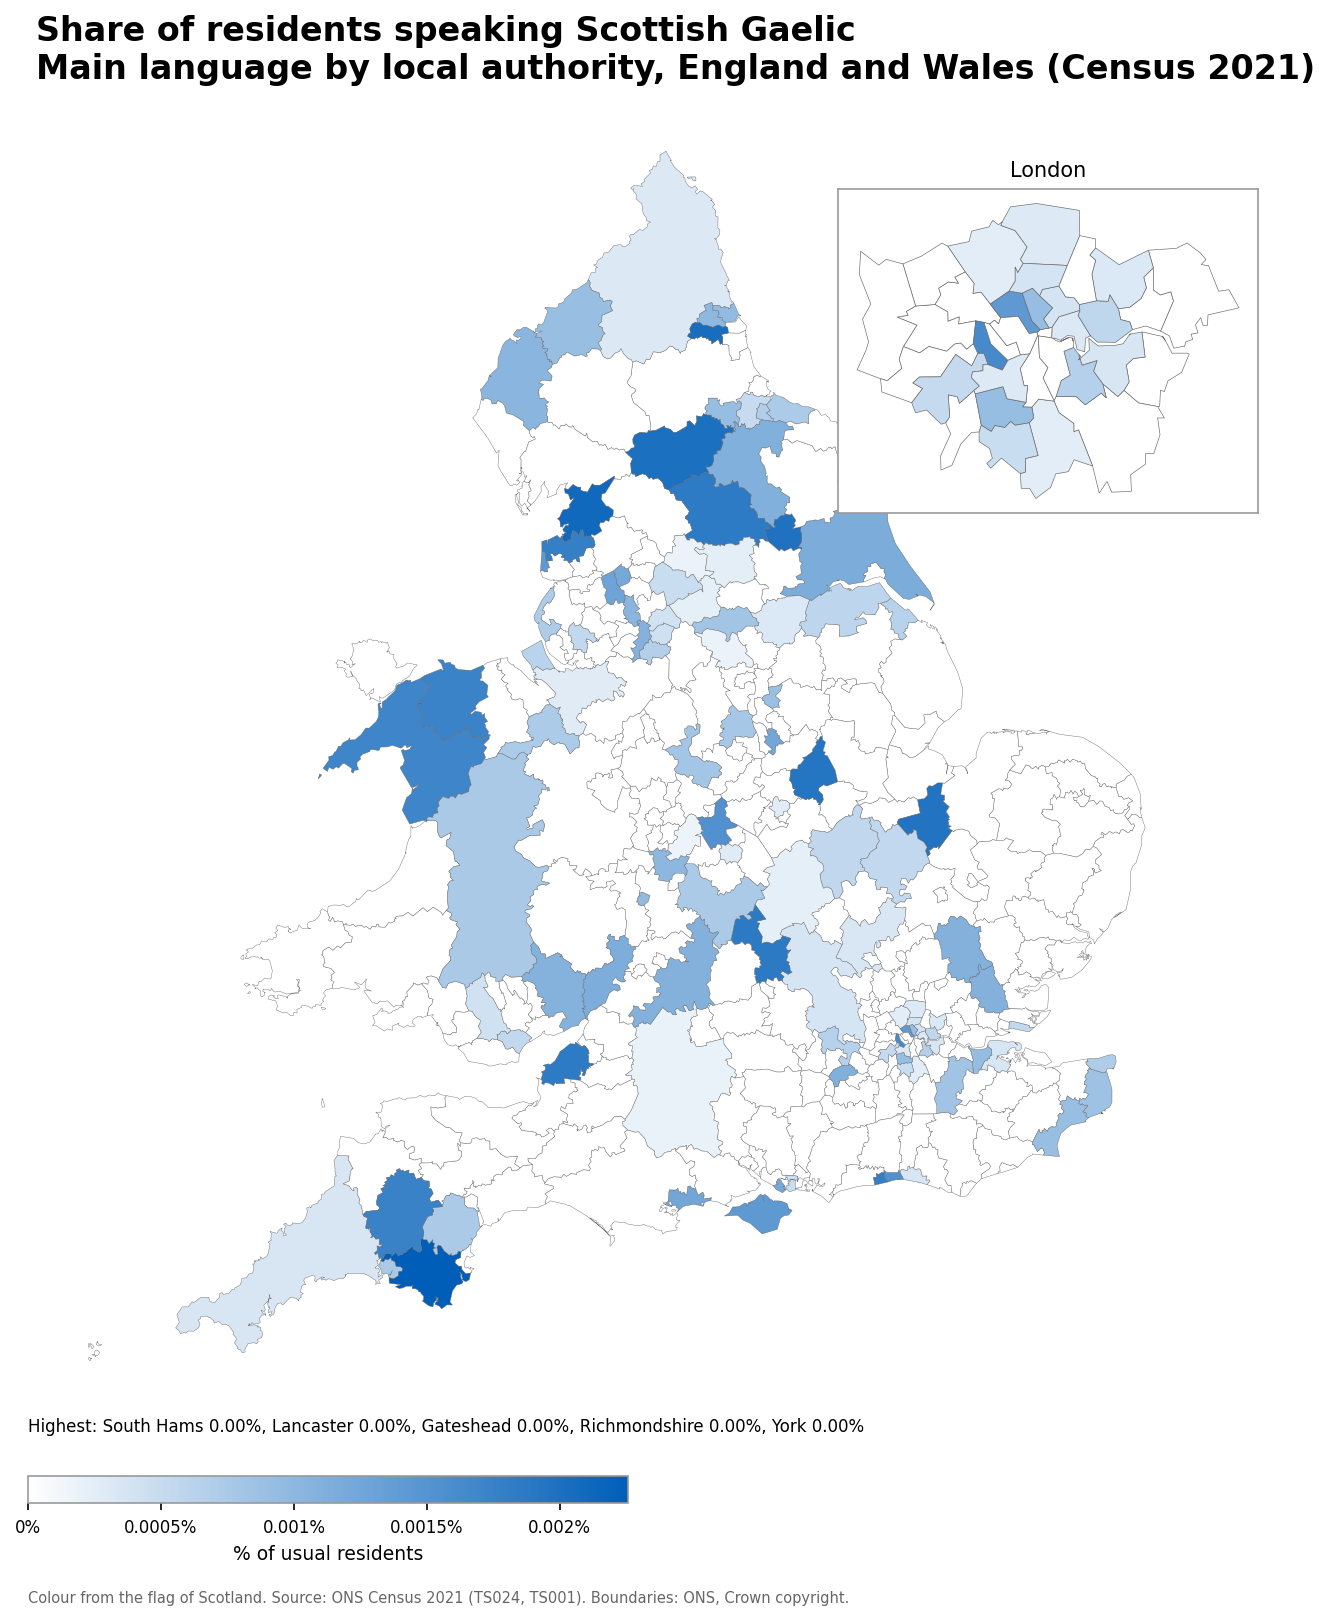
- South Hams: 0.00% (2 speakers)
- Lancaster: 0.00% (3 speakers)
- Gateshead: 0.00% (4 speakers)
- Richmondshire: 0.00% (1 speakers)
- York: 0.00% (4 speakers)
Number of Manx Gaelic speakers
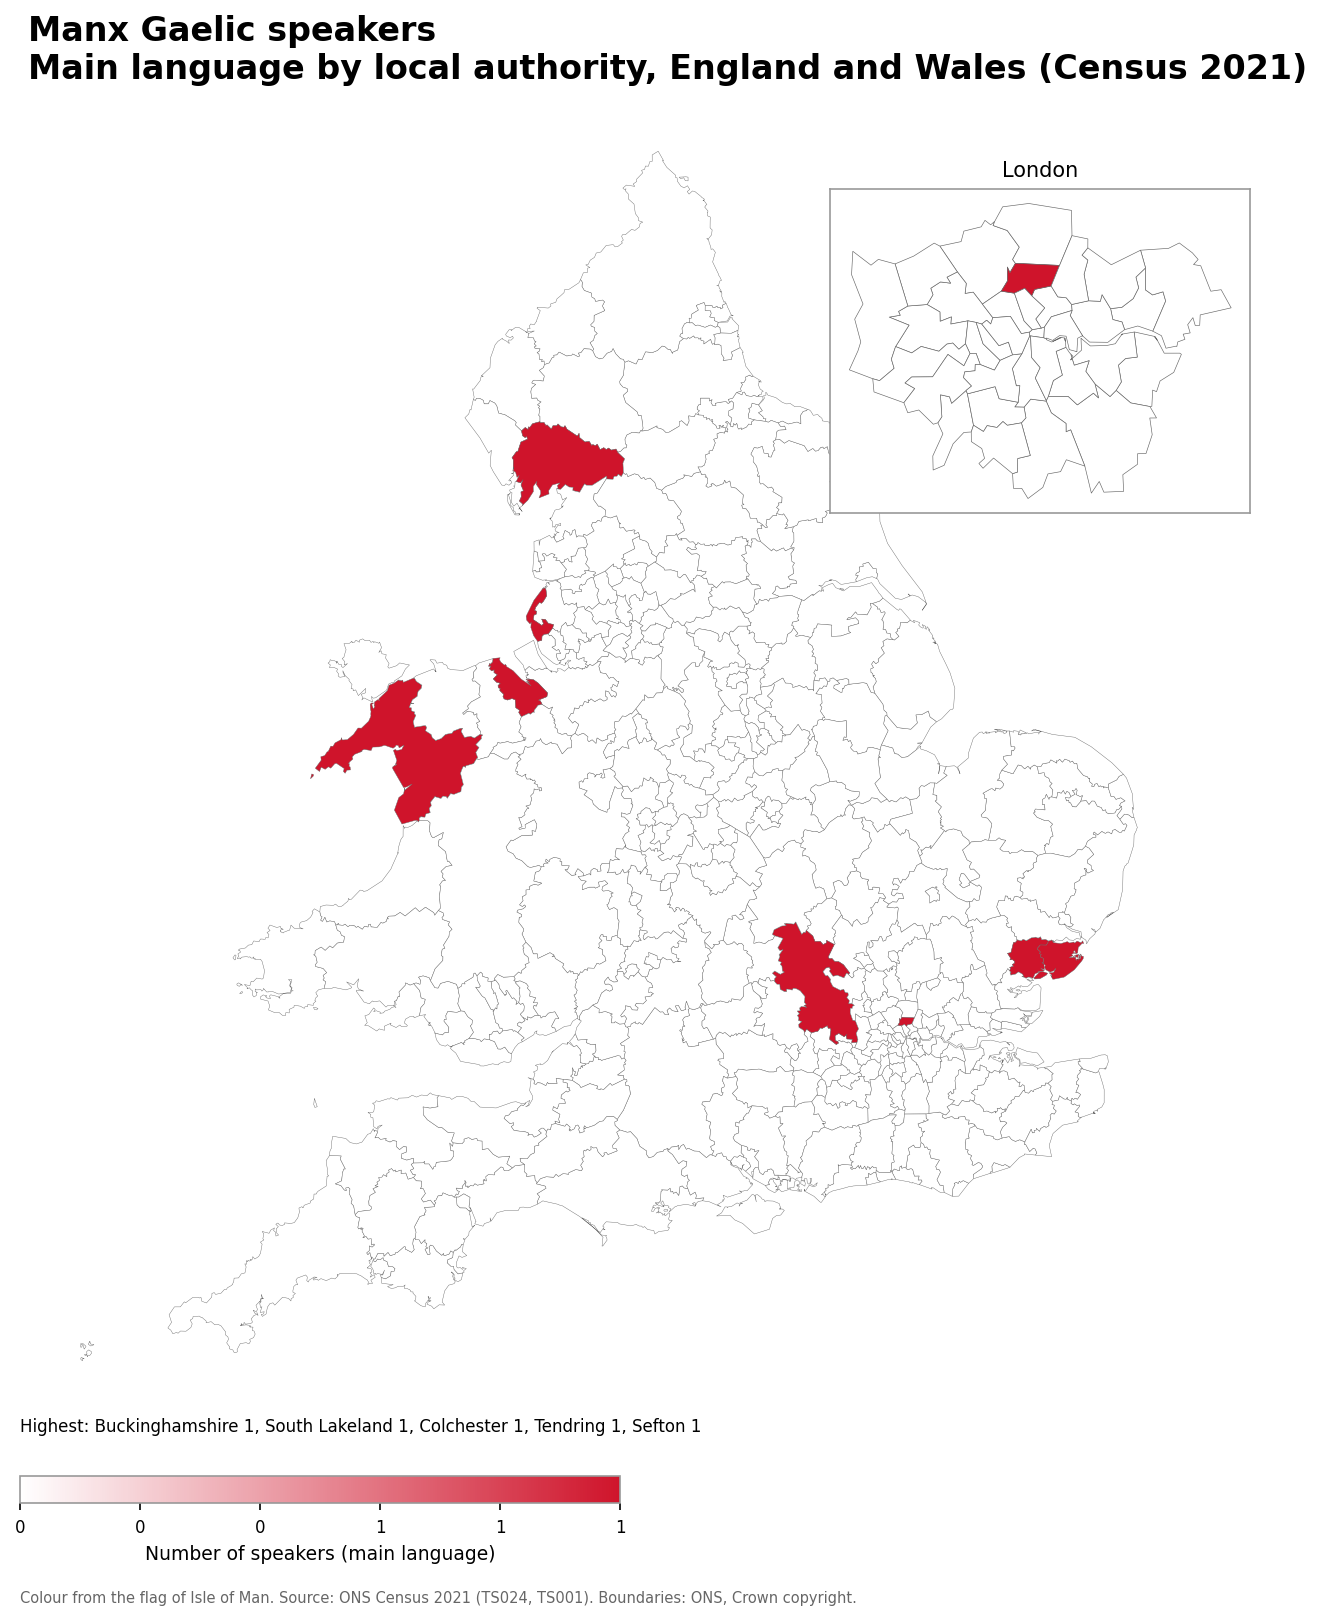
- Buckinghamshire: 1
- South Lakeland: 1
- Colchester: 1
- Tendring: 1
- Sefton: 1
Manx Gaelic speakers as a share of the population
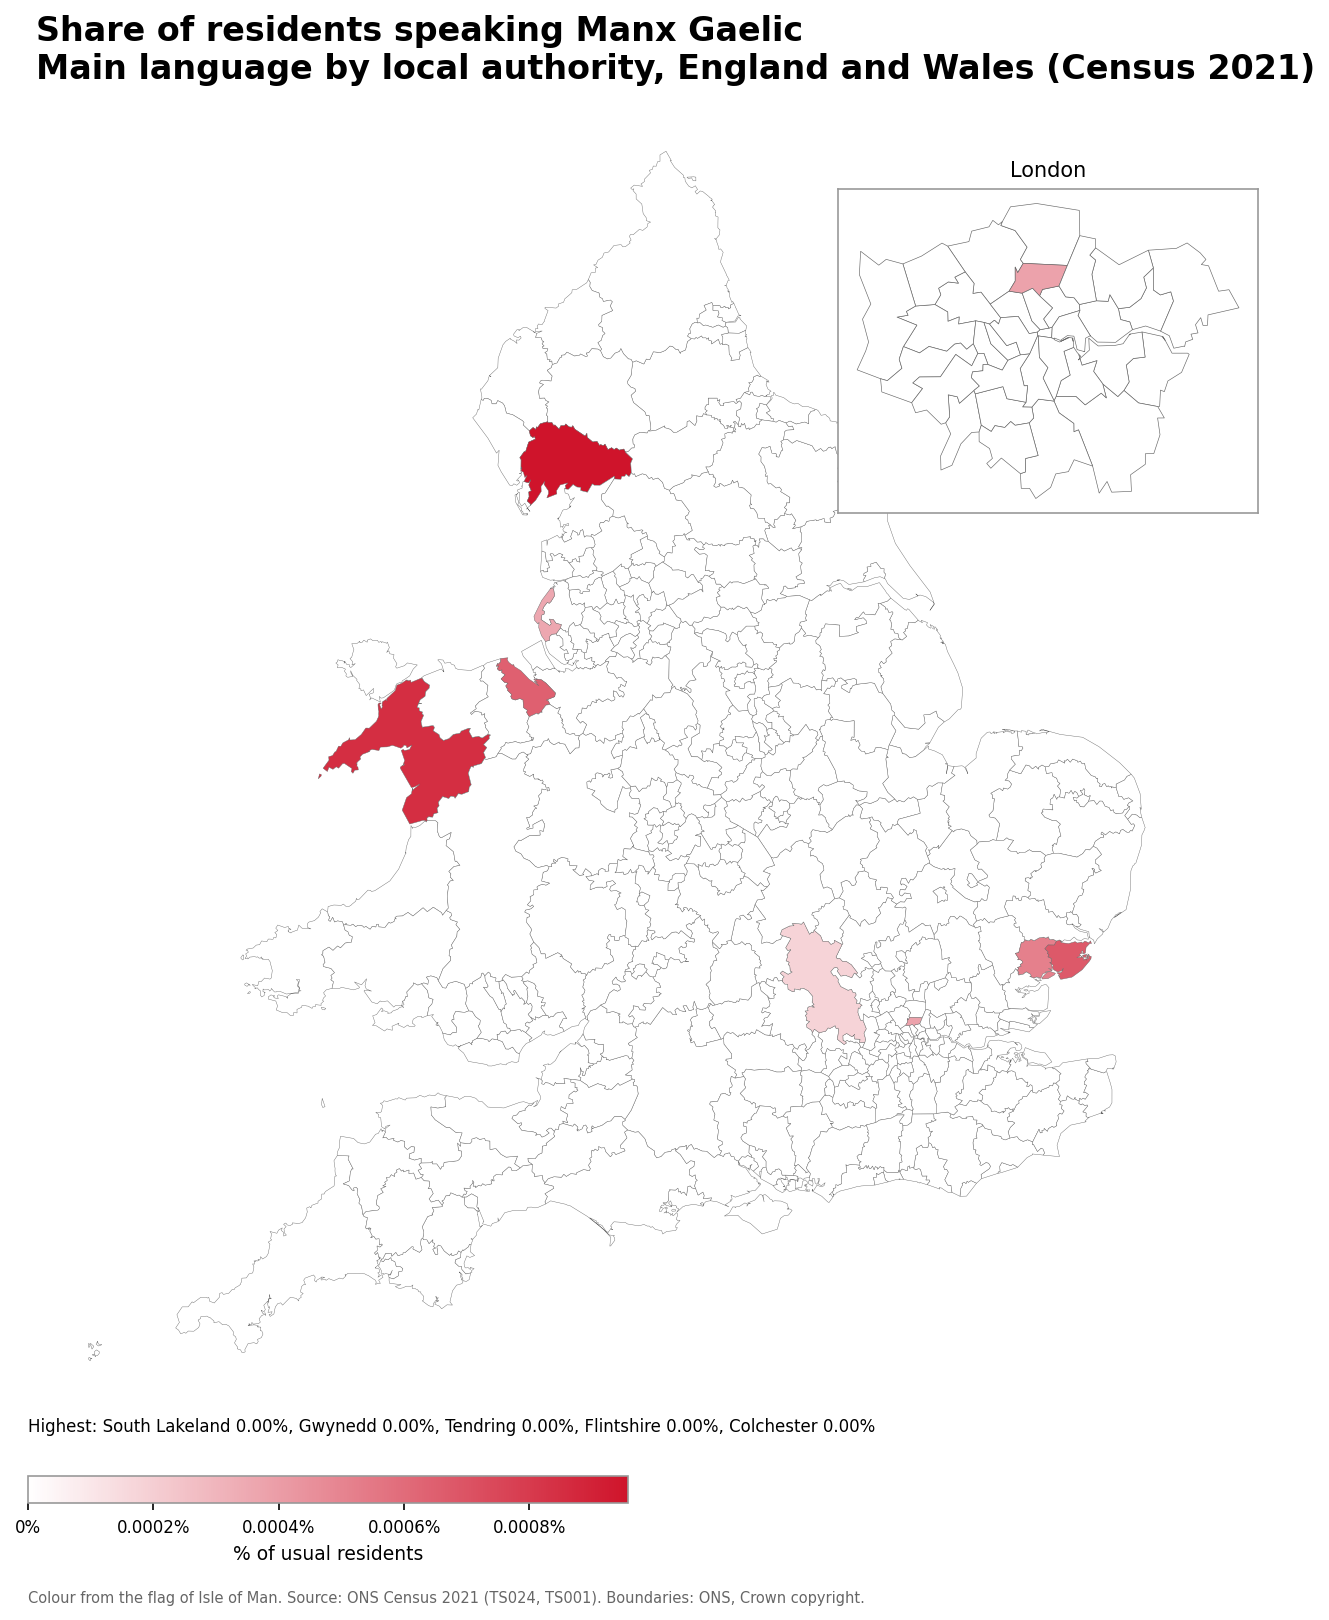
- South Lakeland: 0.00% (1 speakers)
- Gwynedd: 0.00% (1 speakers)
- Tendring: 0.00% (1 speakers)
- Flintshire: 0.00% (1 speakers)
- Colchester: 0.00% (1 speakers)
Number of Cornish speakers
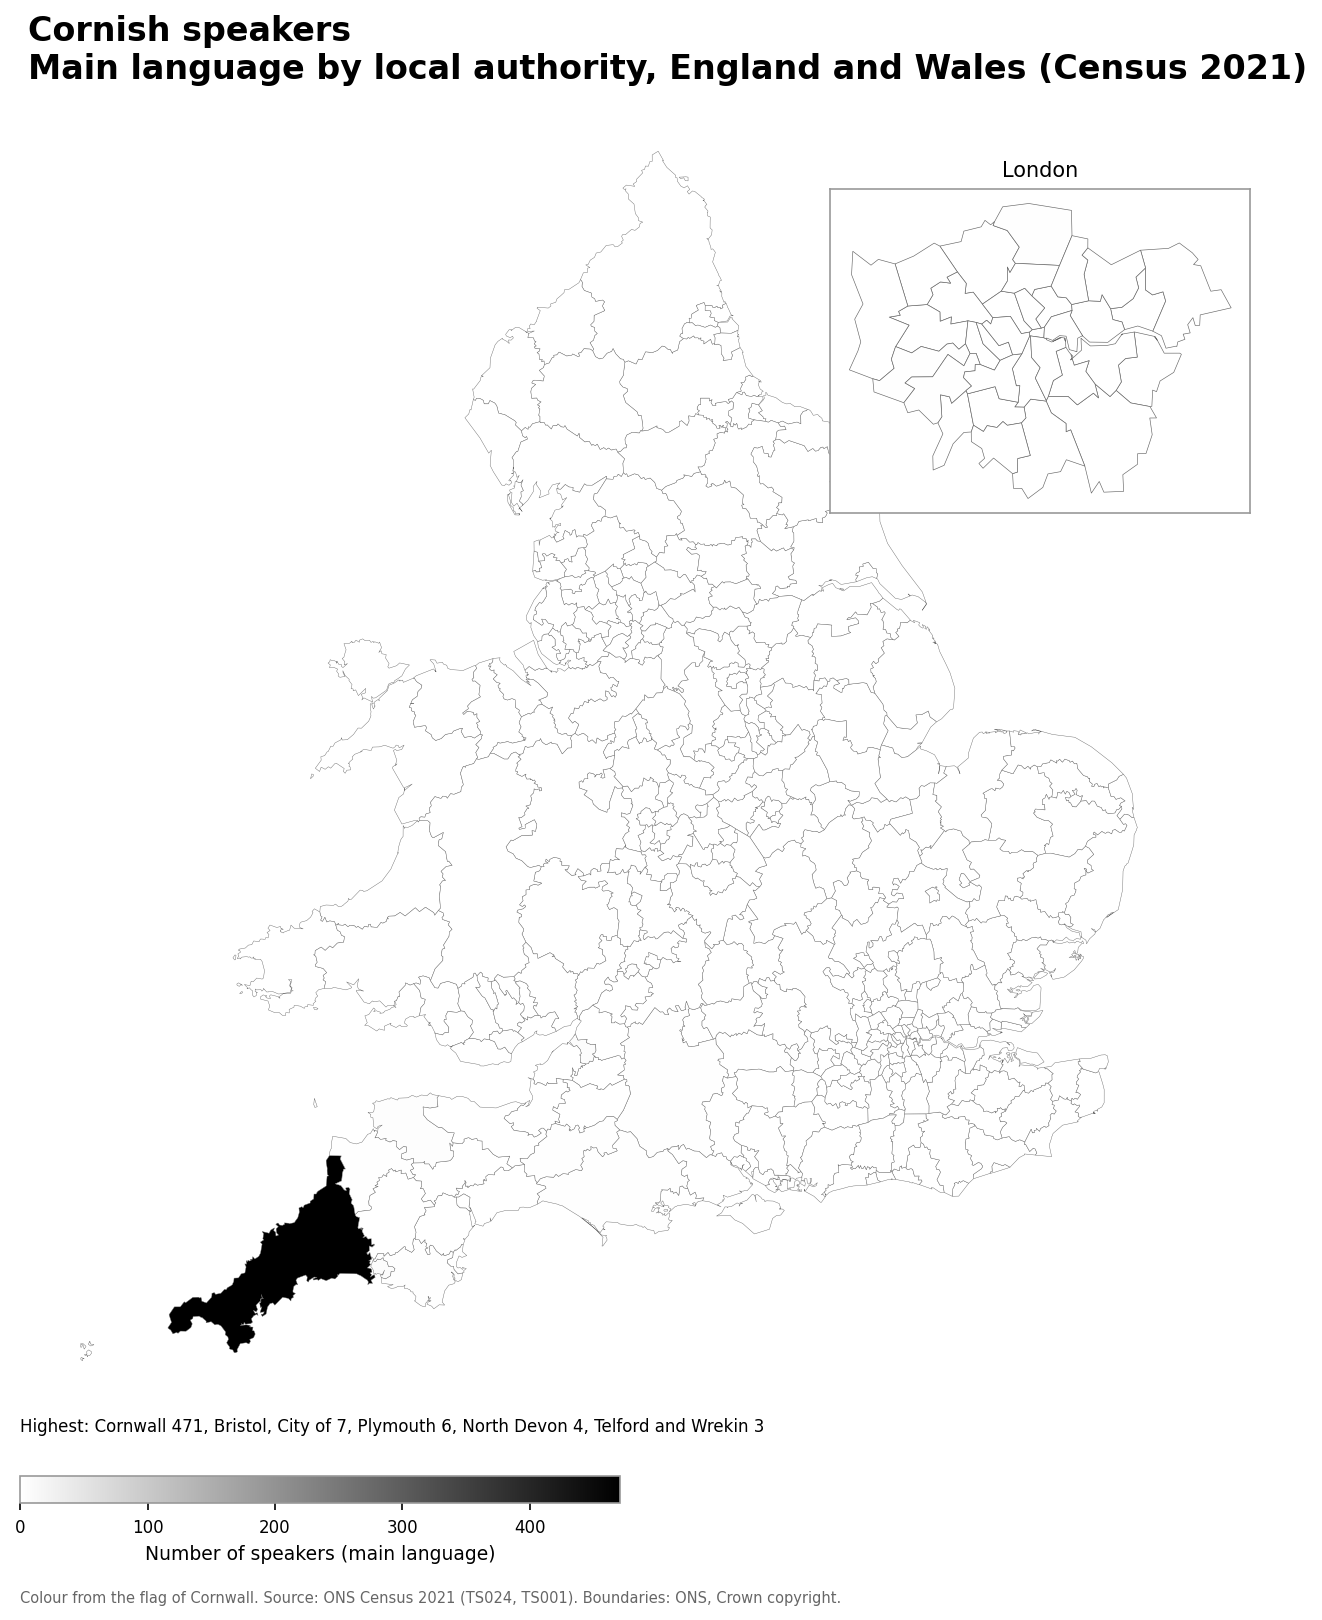
- Cornwall: 471
- Bristol: 7
- Plymouth: 6
- North Devon: 4
- Telford and Wrekin: 3
Cornish speakers as a share of the population
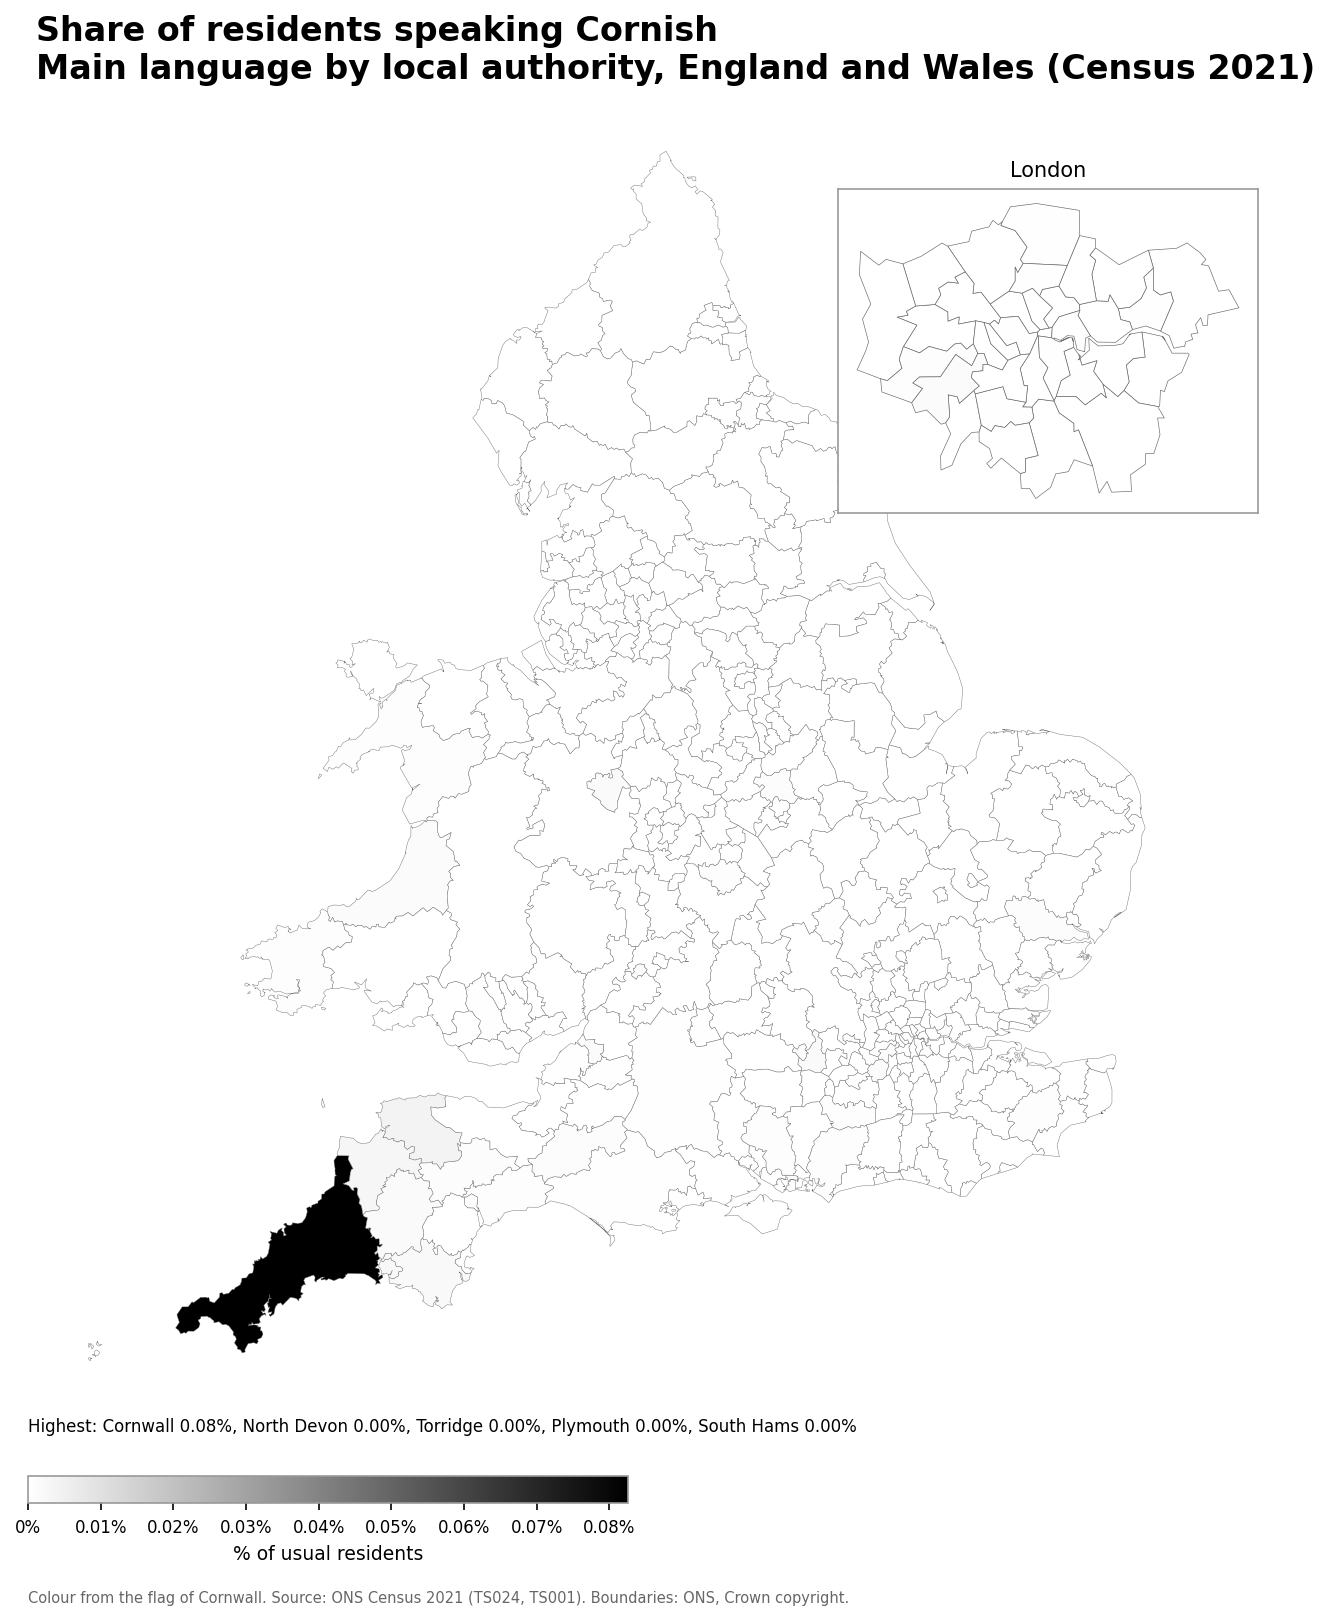
- Cornwall: 0.08% (471 speakers)
- North Devon: 0.00% (4 speakers)
- Torridge: 0.00% (2 speakers)
- Plymouth: 0.00% (6 speakers)
- South Hams: 0.00% (2 speakers)
Number of Scots speakers
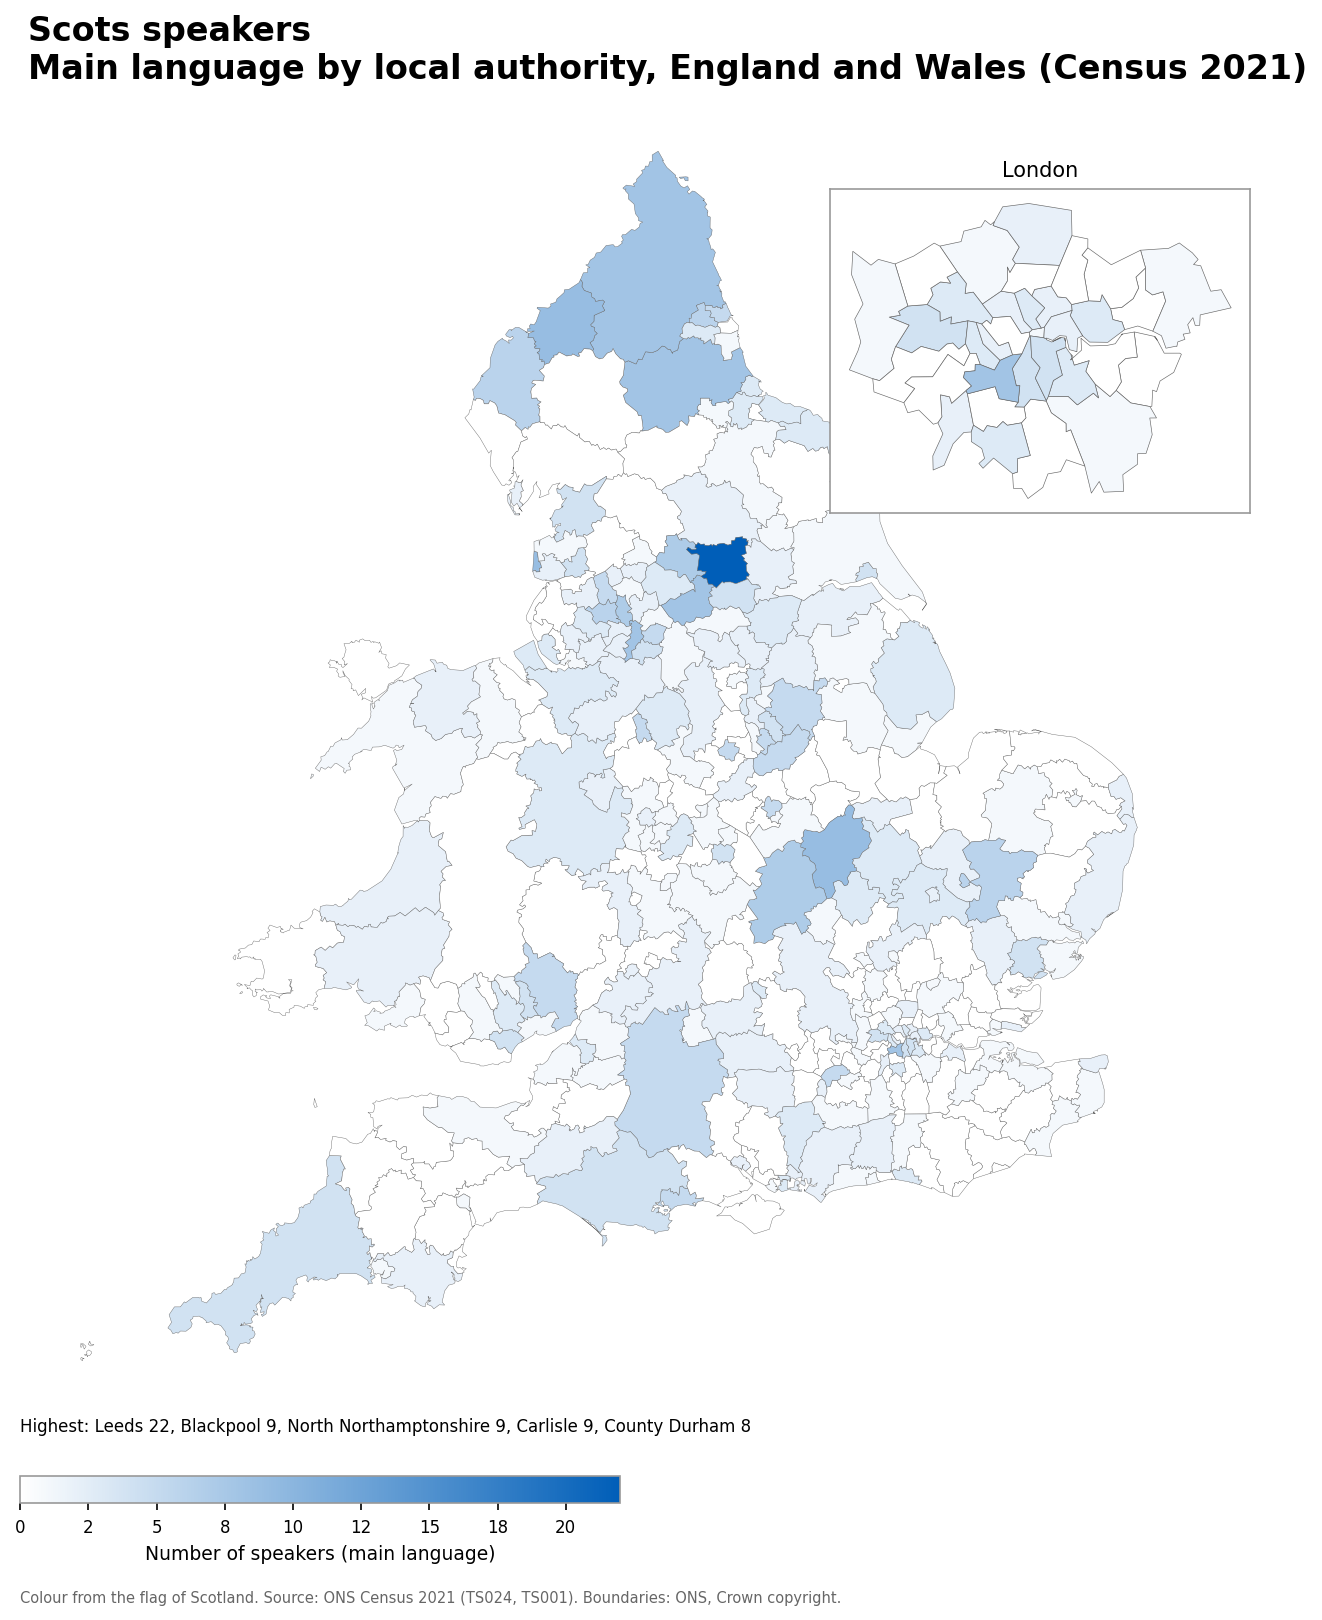
- Leeds: 22
- Blackpool: 9
- Carlisle: 9
- North Northamptonshire: 9
- County Durham: 8
Scots speakers as a share of the population
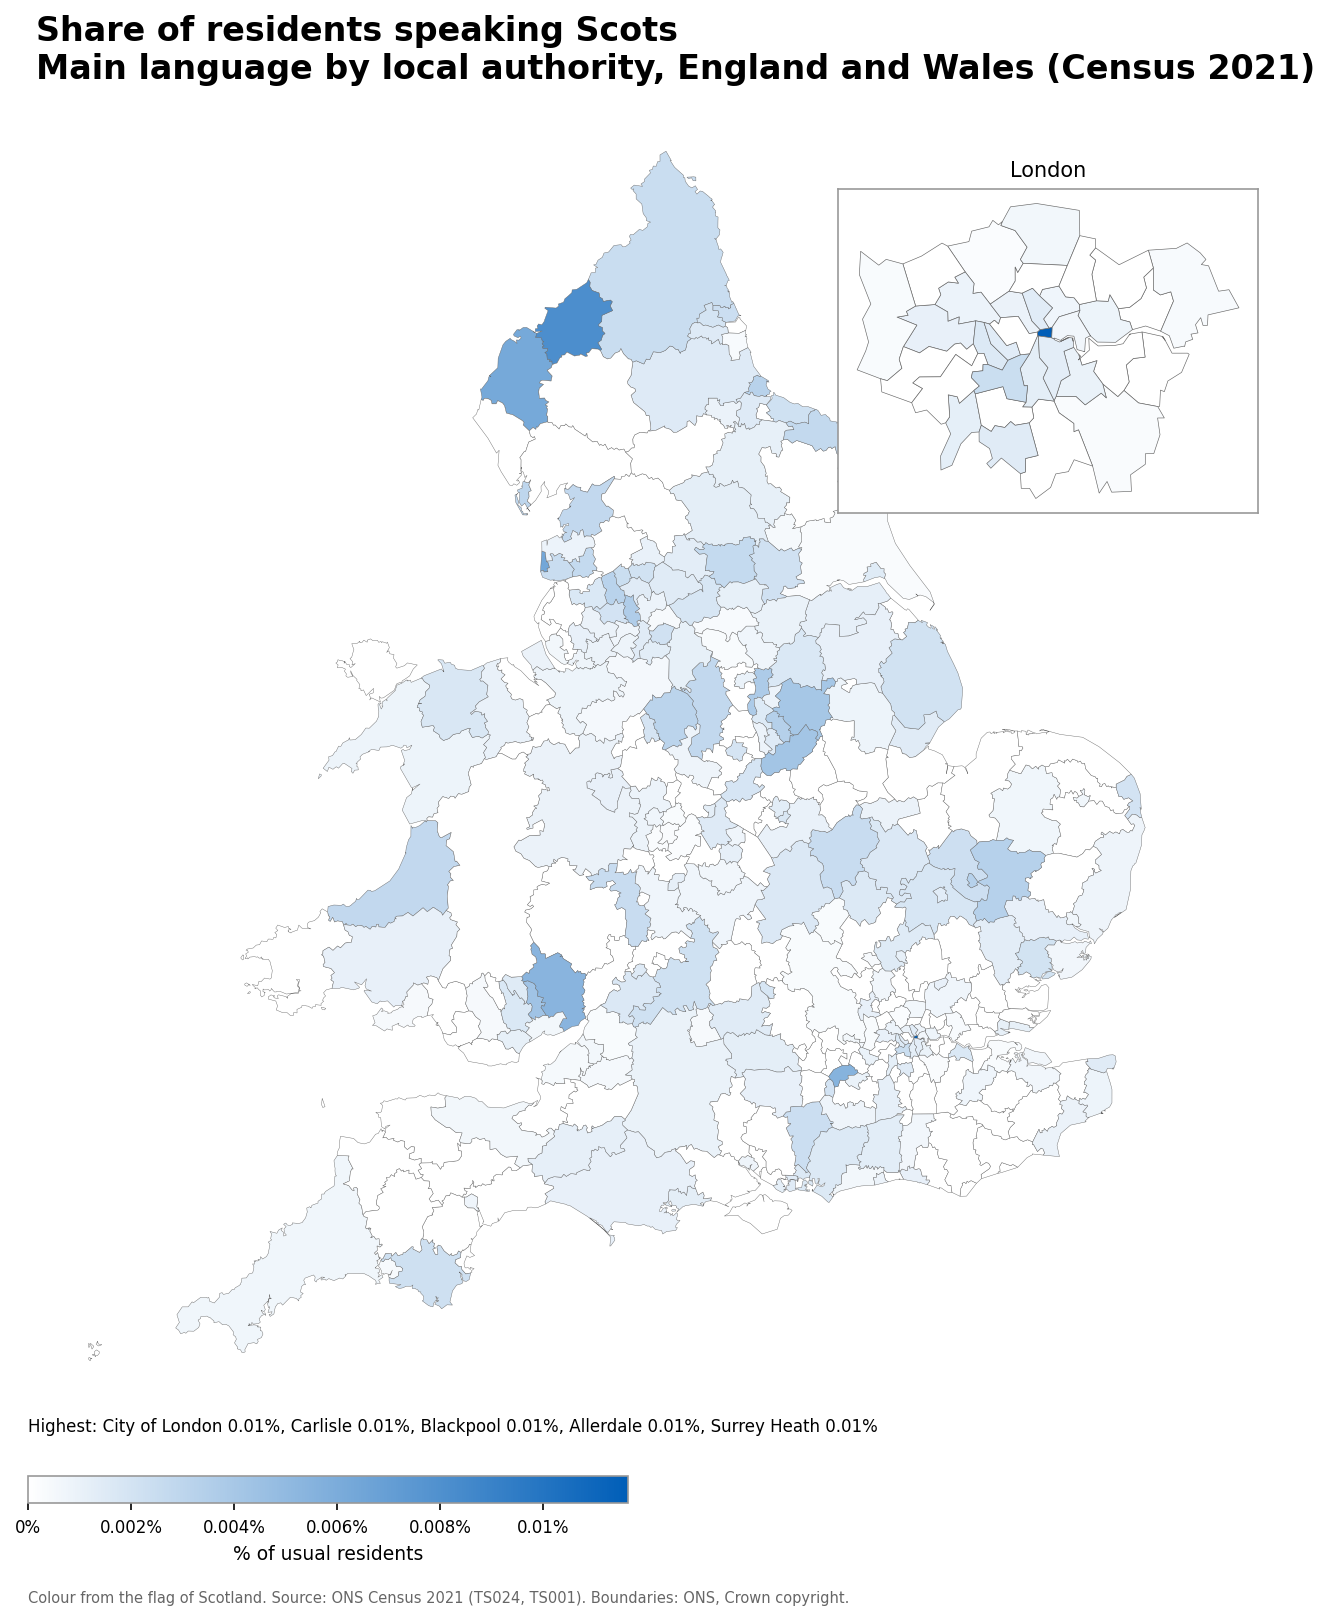
- City of London: 0.01% (1 speakers)
- Carlisle: 0.01% (9 speakers)
- Blackpool: 0.01% (9 speakers)
- Allerdale: 0.01% (6 speakers)
- Surrey Heath: 0.01% (5 speakers)
Number of Ulster Scots speakers
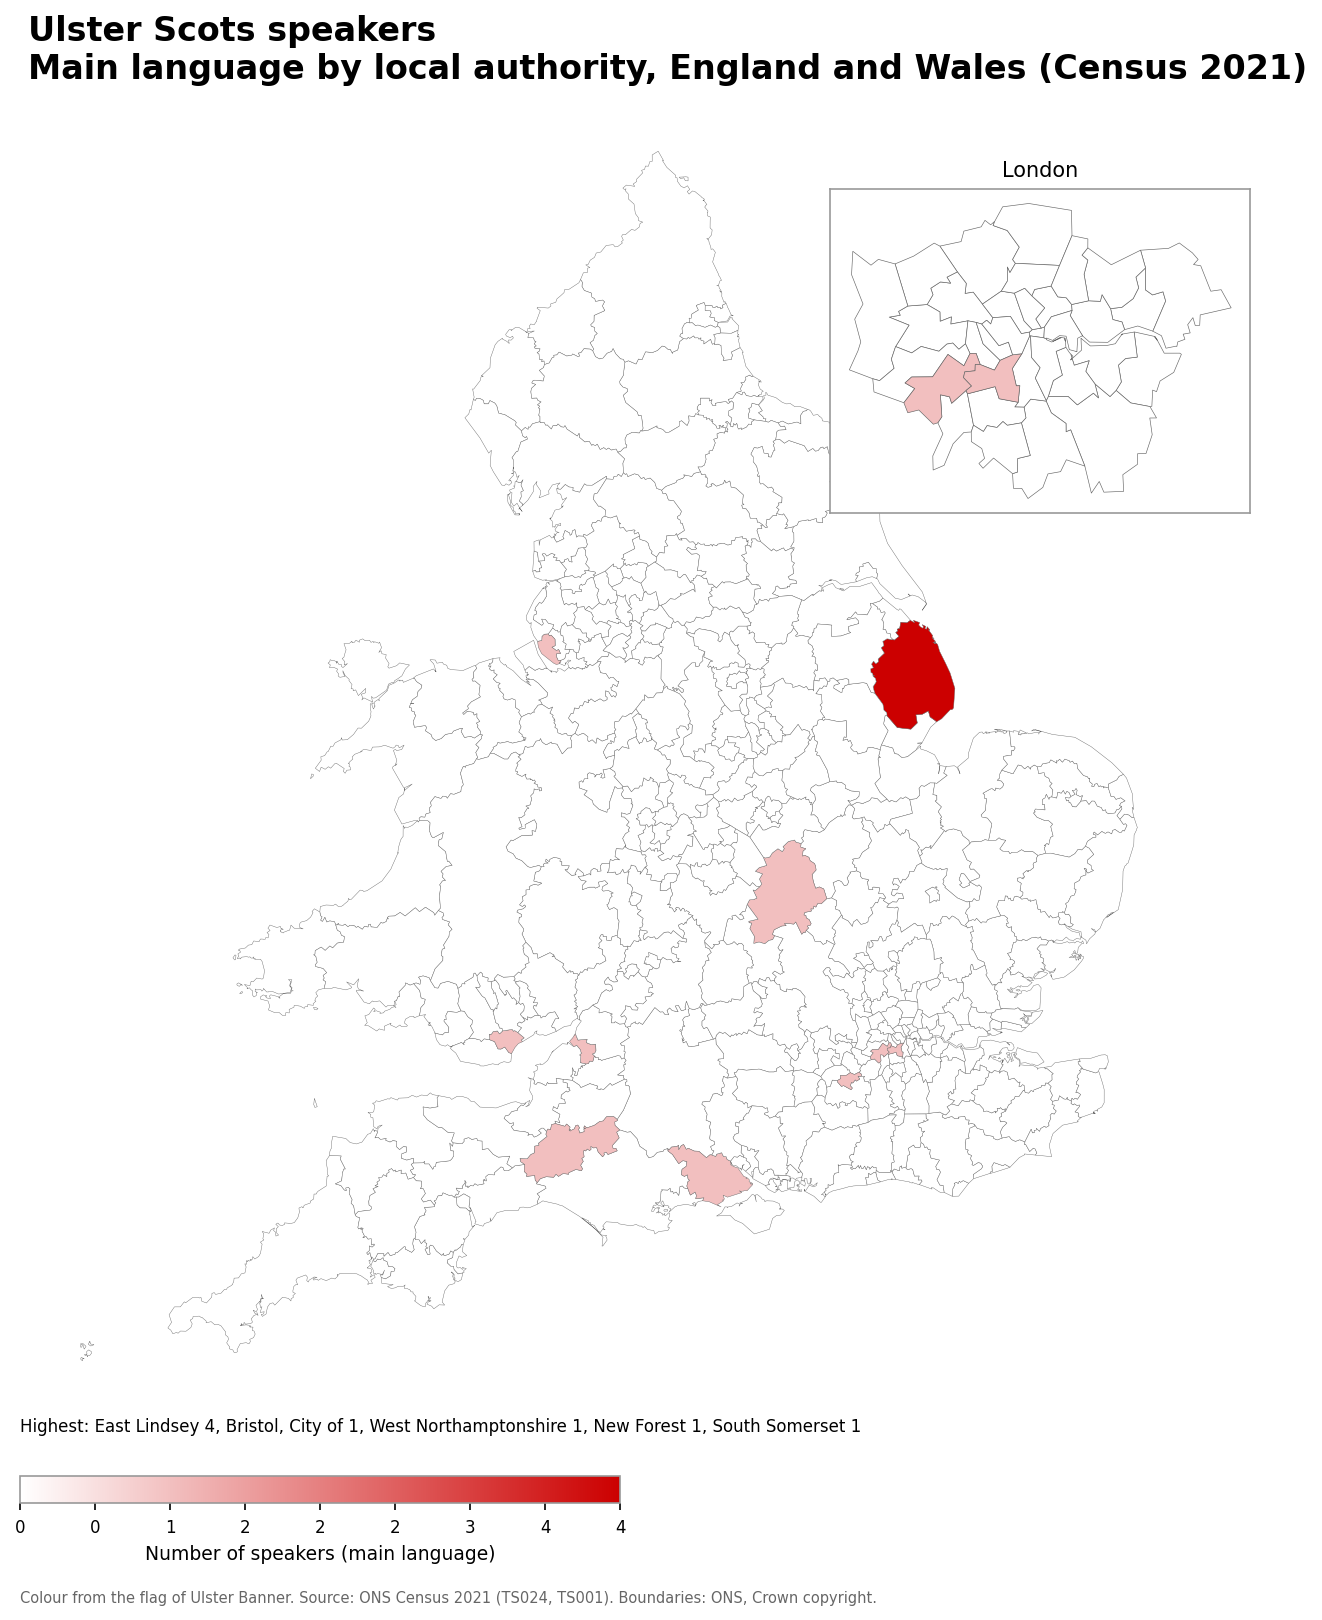
- East Lindsey: 4
- Bristol: 1
- West Northamptonshire: 1
- New Forest: 1
- South Somerset: 1
Ulster Scots speakers as a share of the population
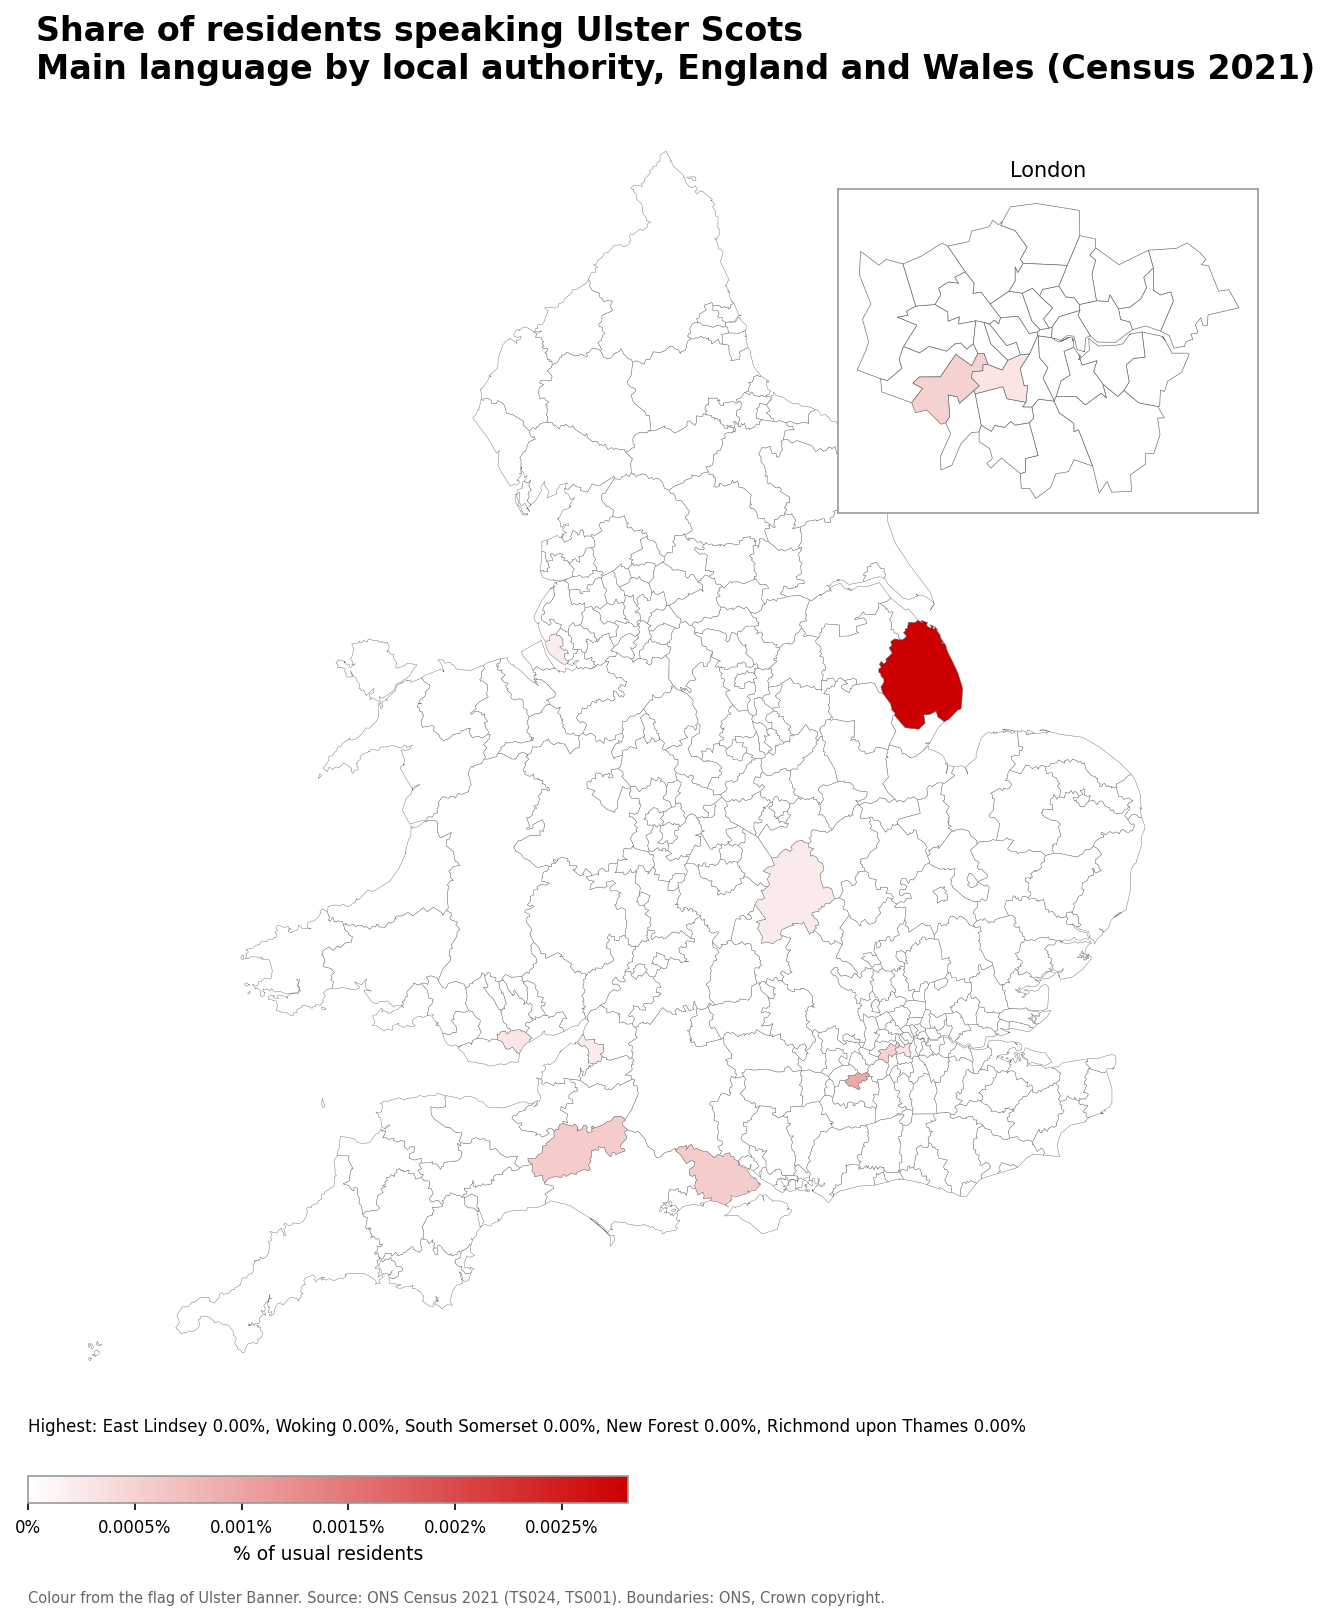
- East Lindsey: 0.00% (4 speakers)
- Woking: 0.00% (1 speakers)
- South Somerset: 0.00% (1 speakers)
- New Forest: 0.00% (1 speakers)
- Richmond upon Thames: 0.00% (1 speakers)
Number of Romany English speakers
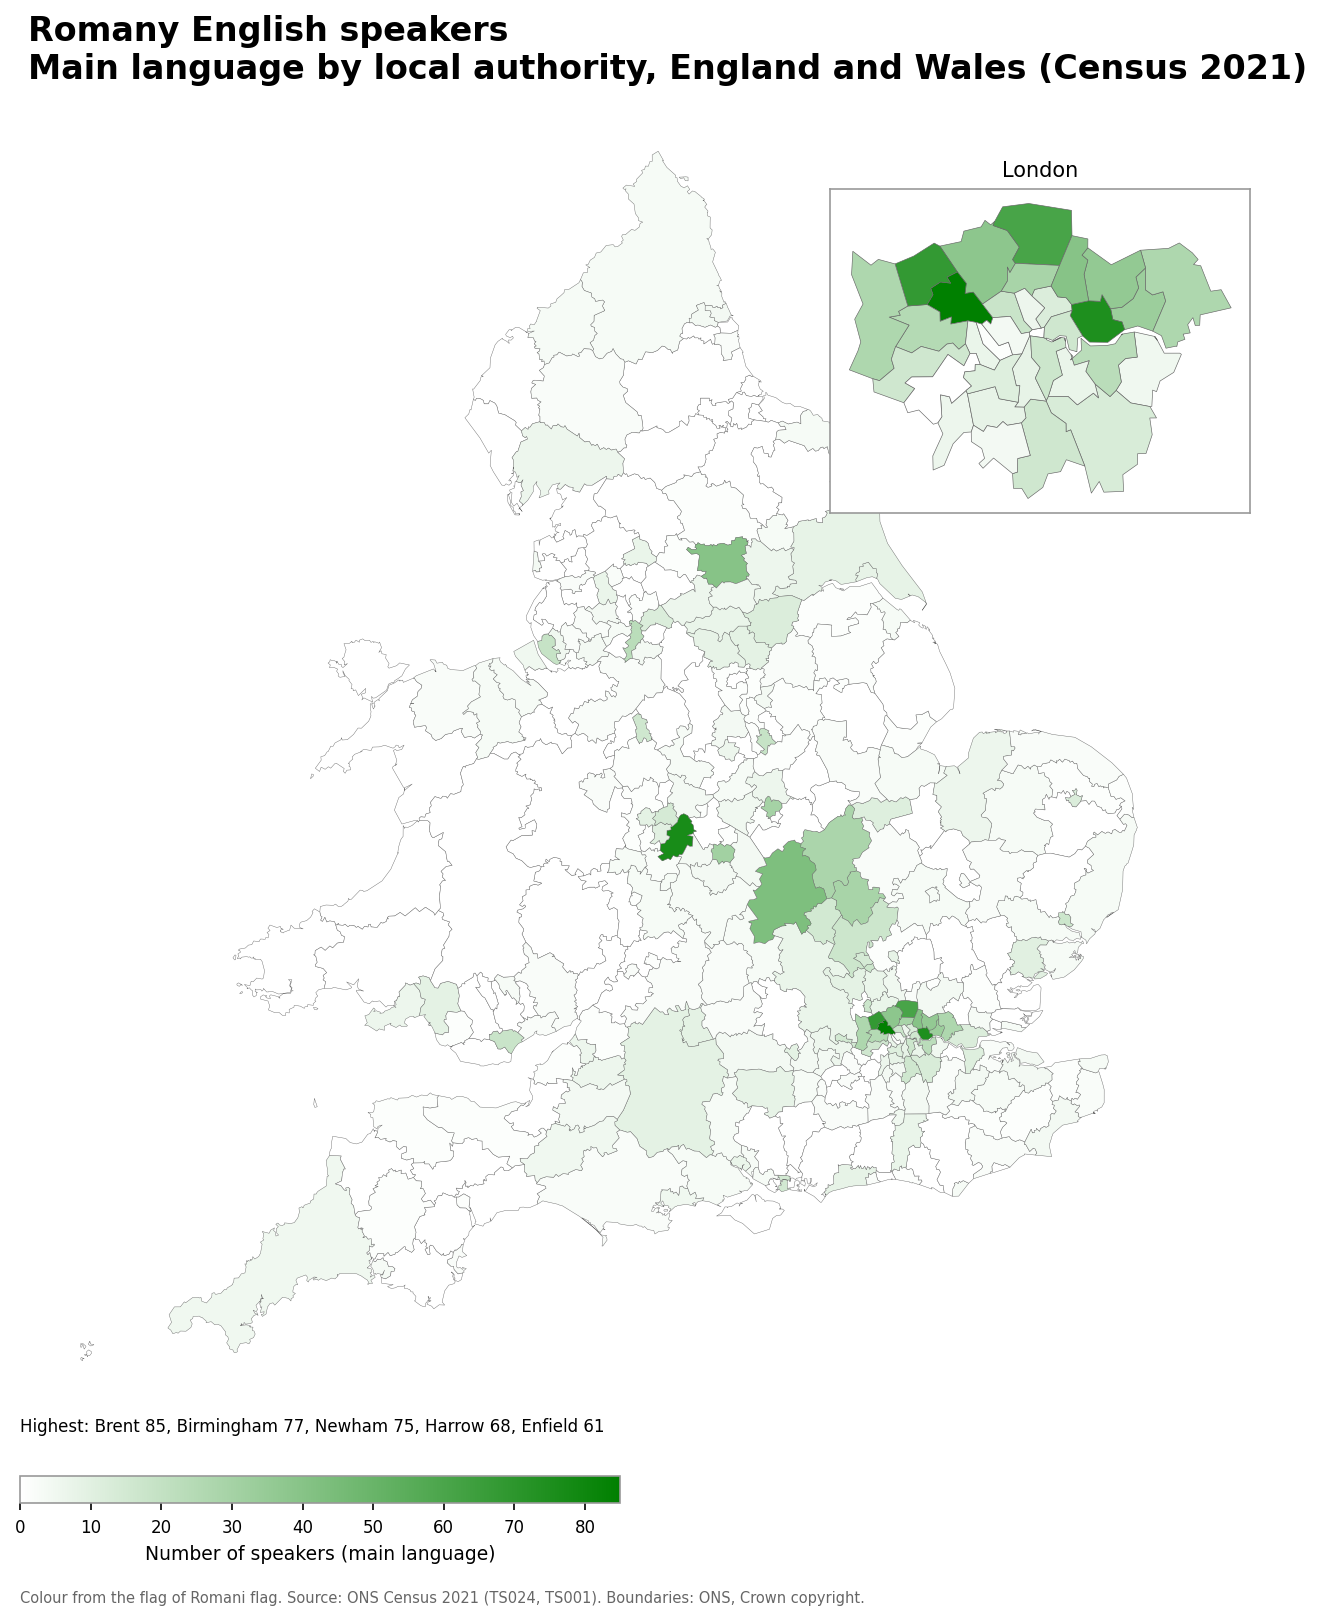
- Brent: 85
- Birmingham: 77
- Newham: 75
- Harrow: 68
- Enfield: 61
Romany English speakers as a share of the population
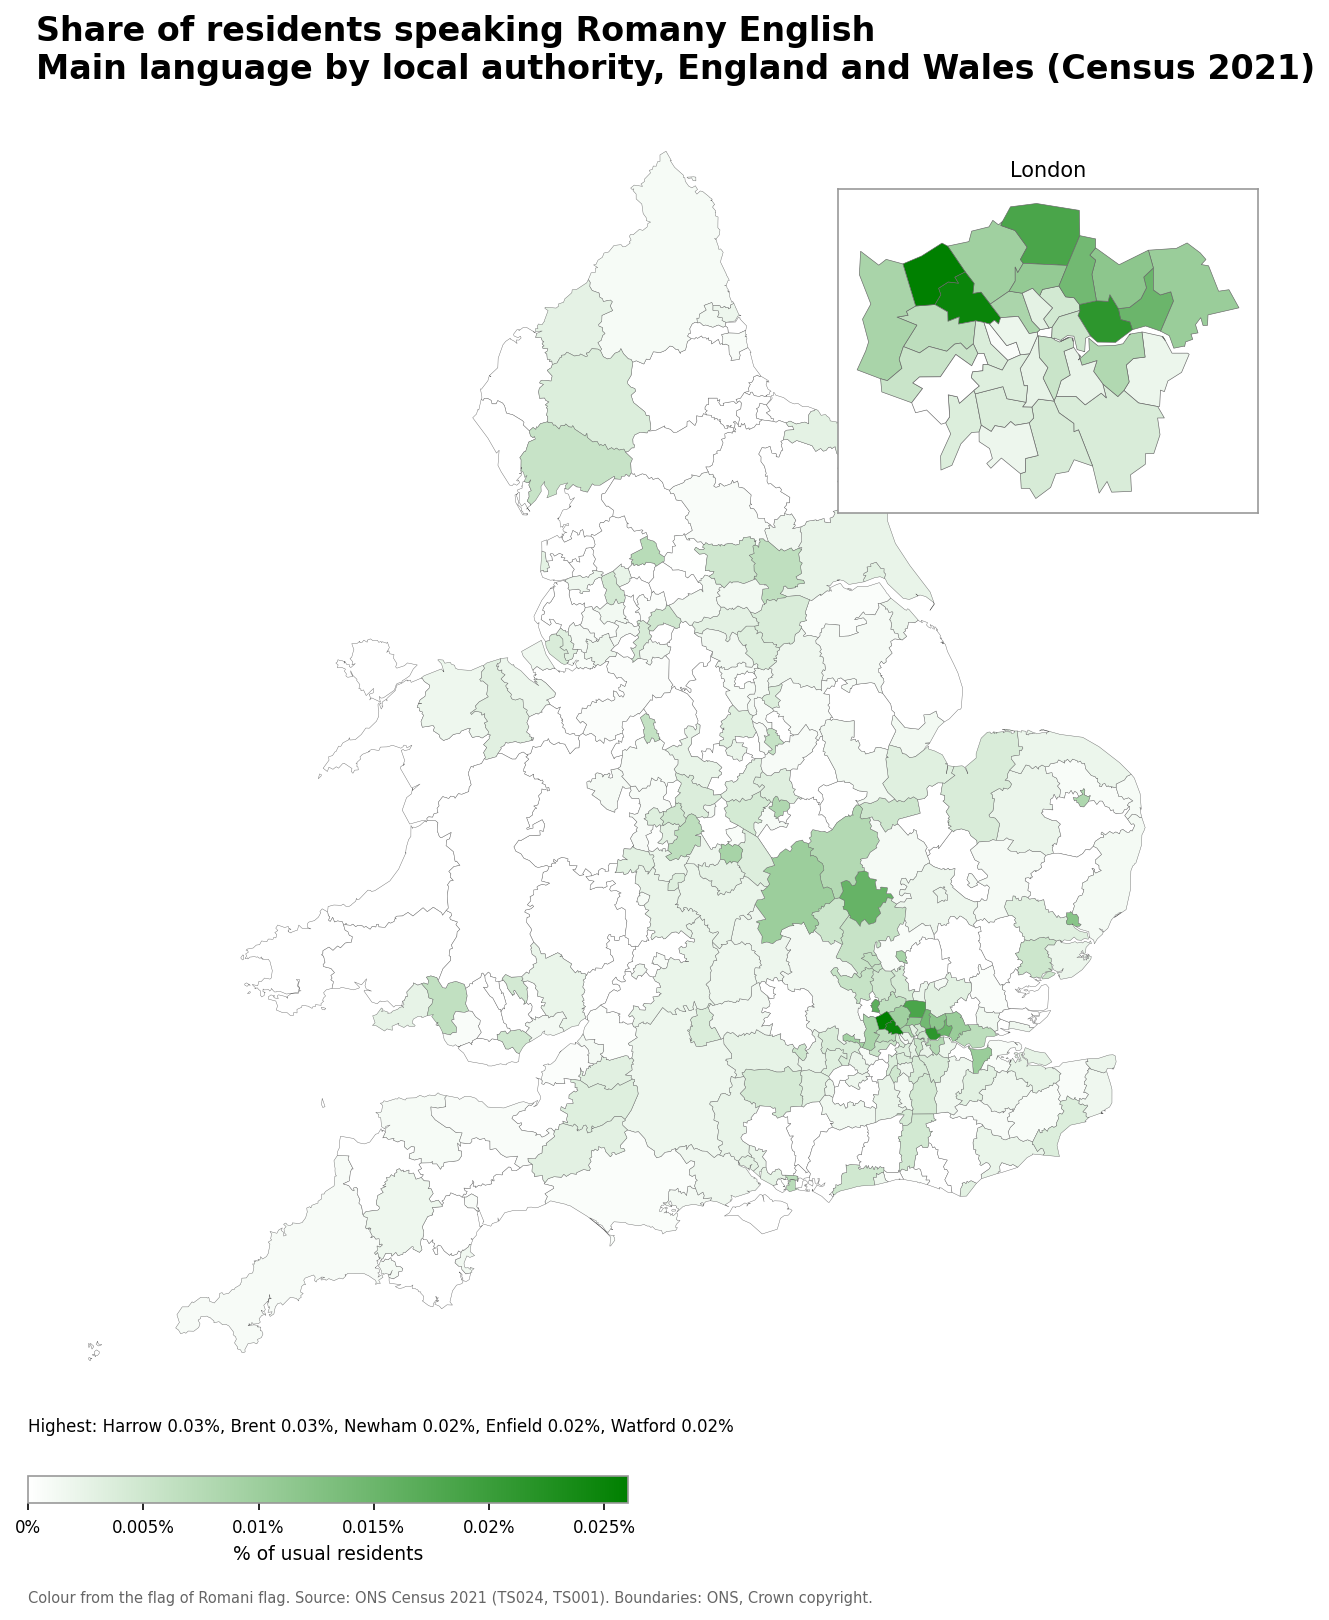
- Harrow: 0.03% (68 speakers)
- Brent: 0.03% (85 speakers)
- Newham: 0.02% (75 speakers)
- Enfield: 0.02% (61 speakers)
- Watford: 0.02% (17 speakers)
Number of Irish Traveller Cant speakers
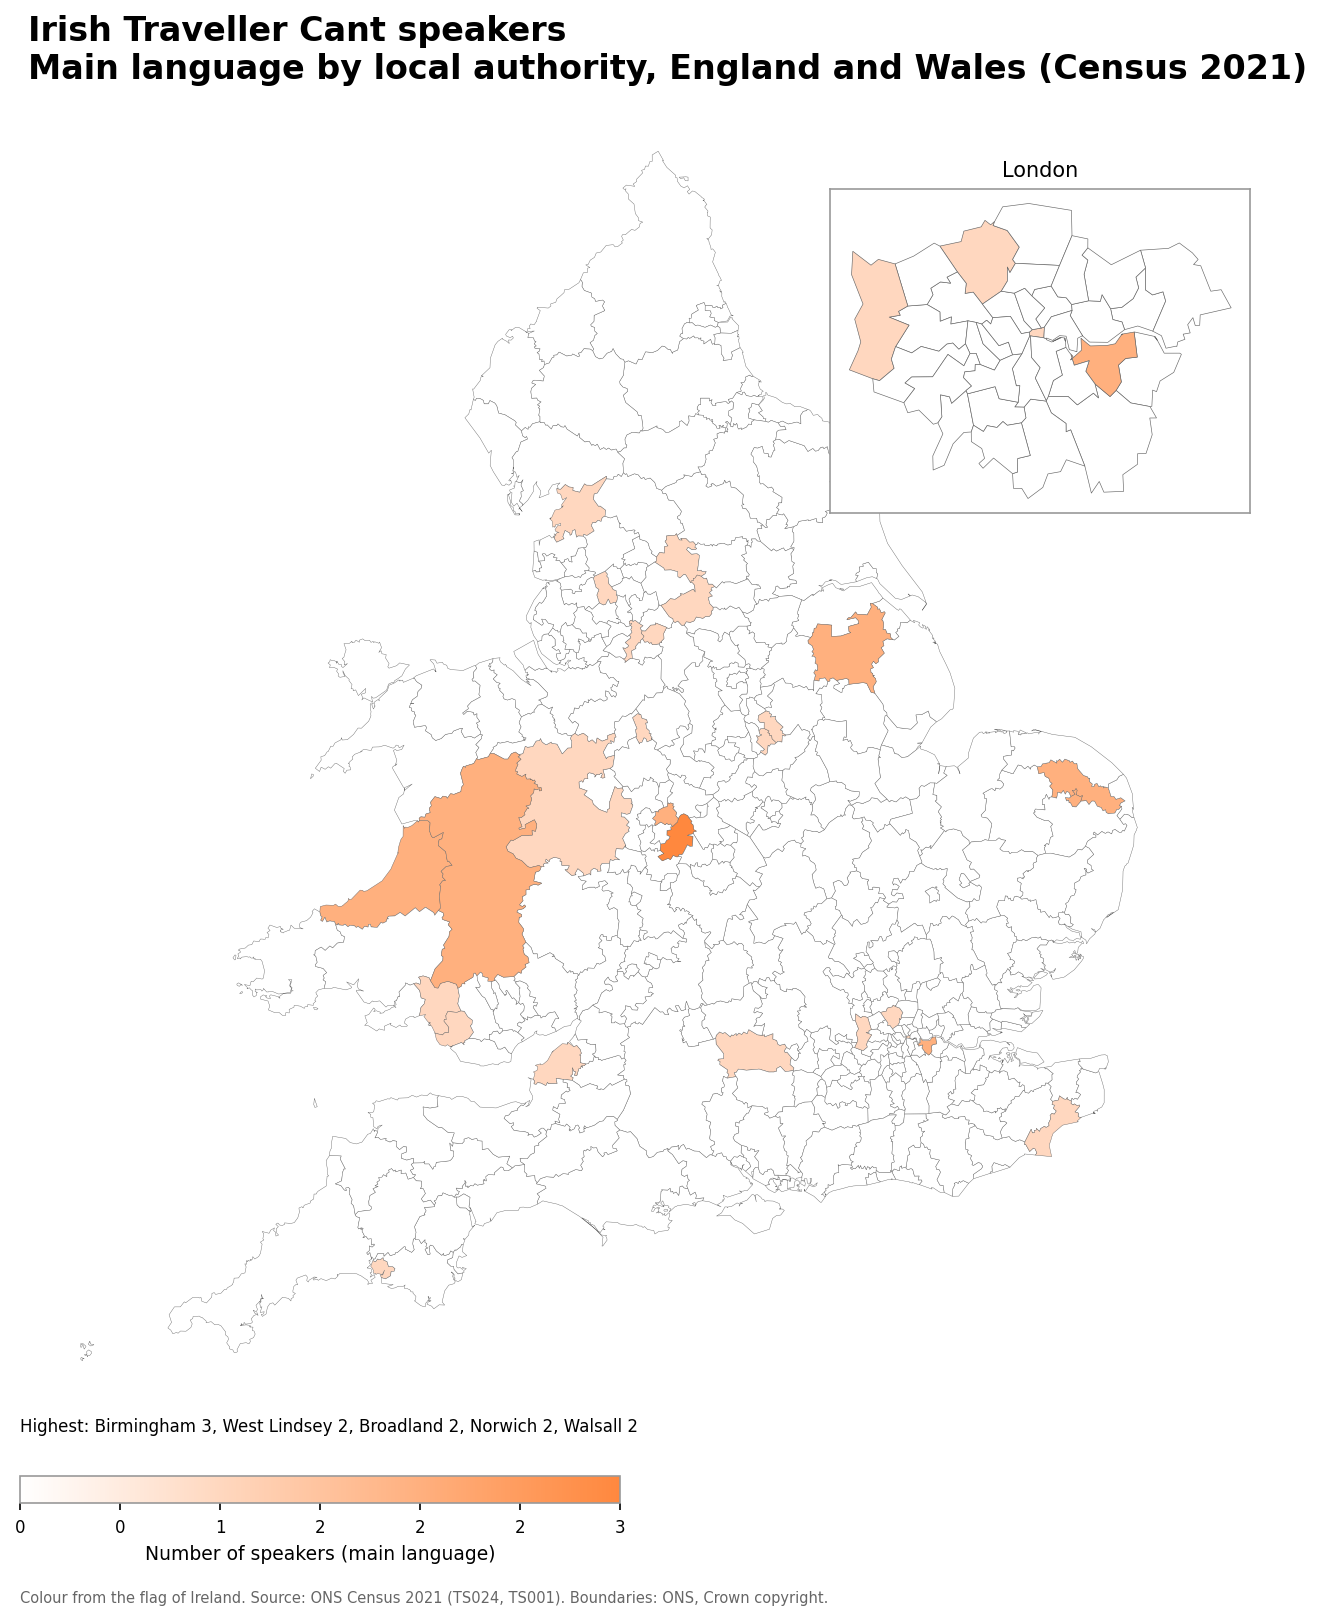
- Birmingham: 3
- Broadland: 2
- West Lindsey: 2
- Greenwich: 2
- Walsall: 2
Irish Traveller Cant speakers as a share of the population
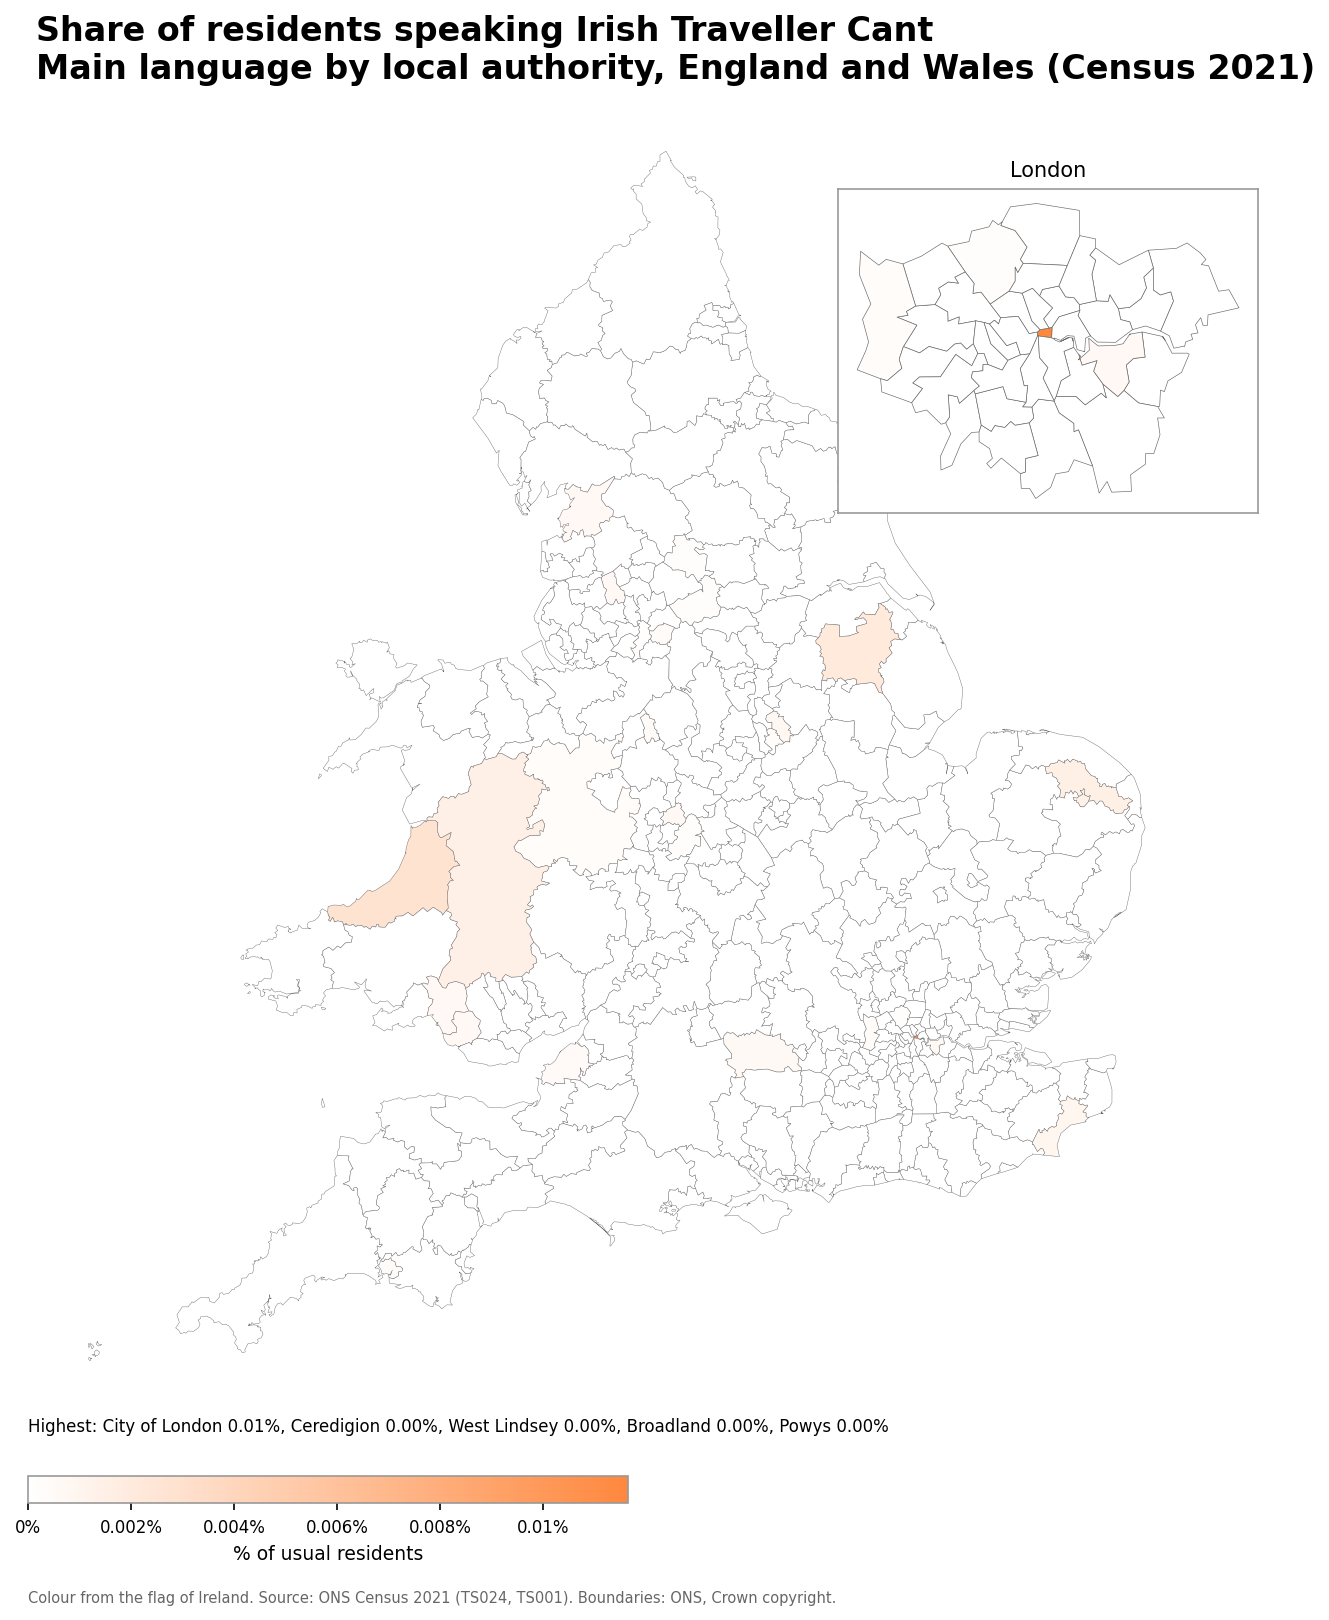
- City of London: 0.01% (1 speakers)
- Ceredigion: 0.00% (2 speakers)
- West Lindsey: 0.00% (2 speakers)
- Broadland: 0.00% (2 speakers)
- Powys: 0.00% (2 speakers)
Number of British Sign Language speakers
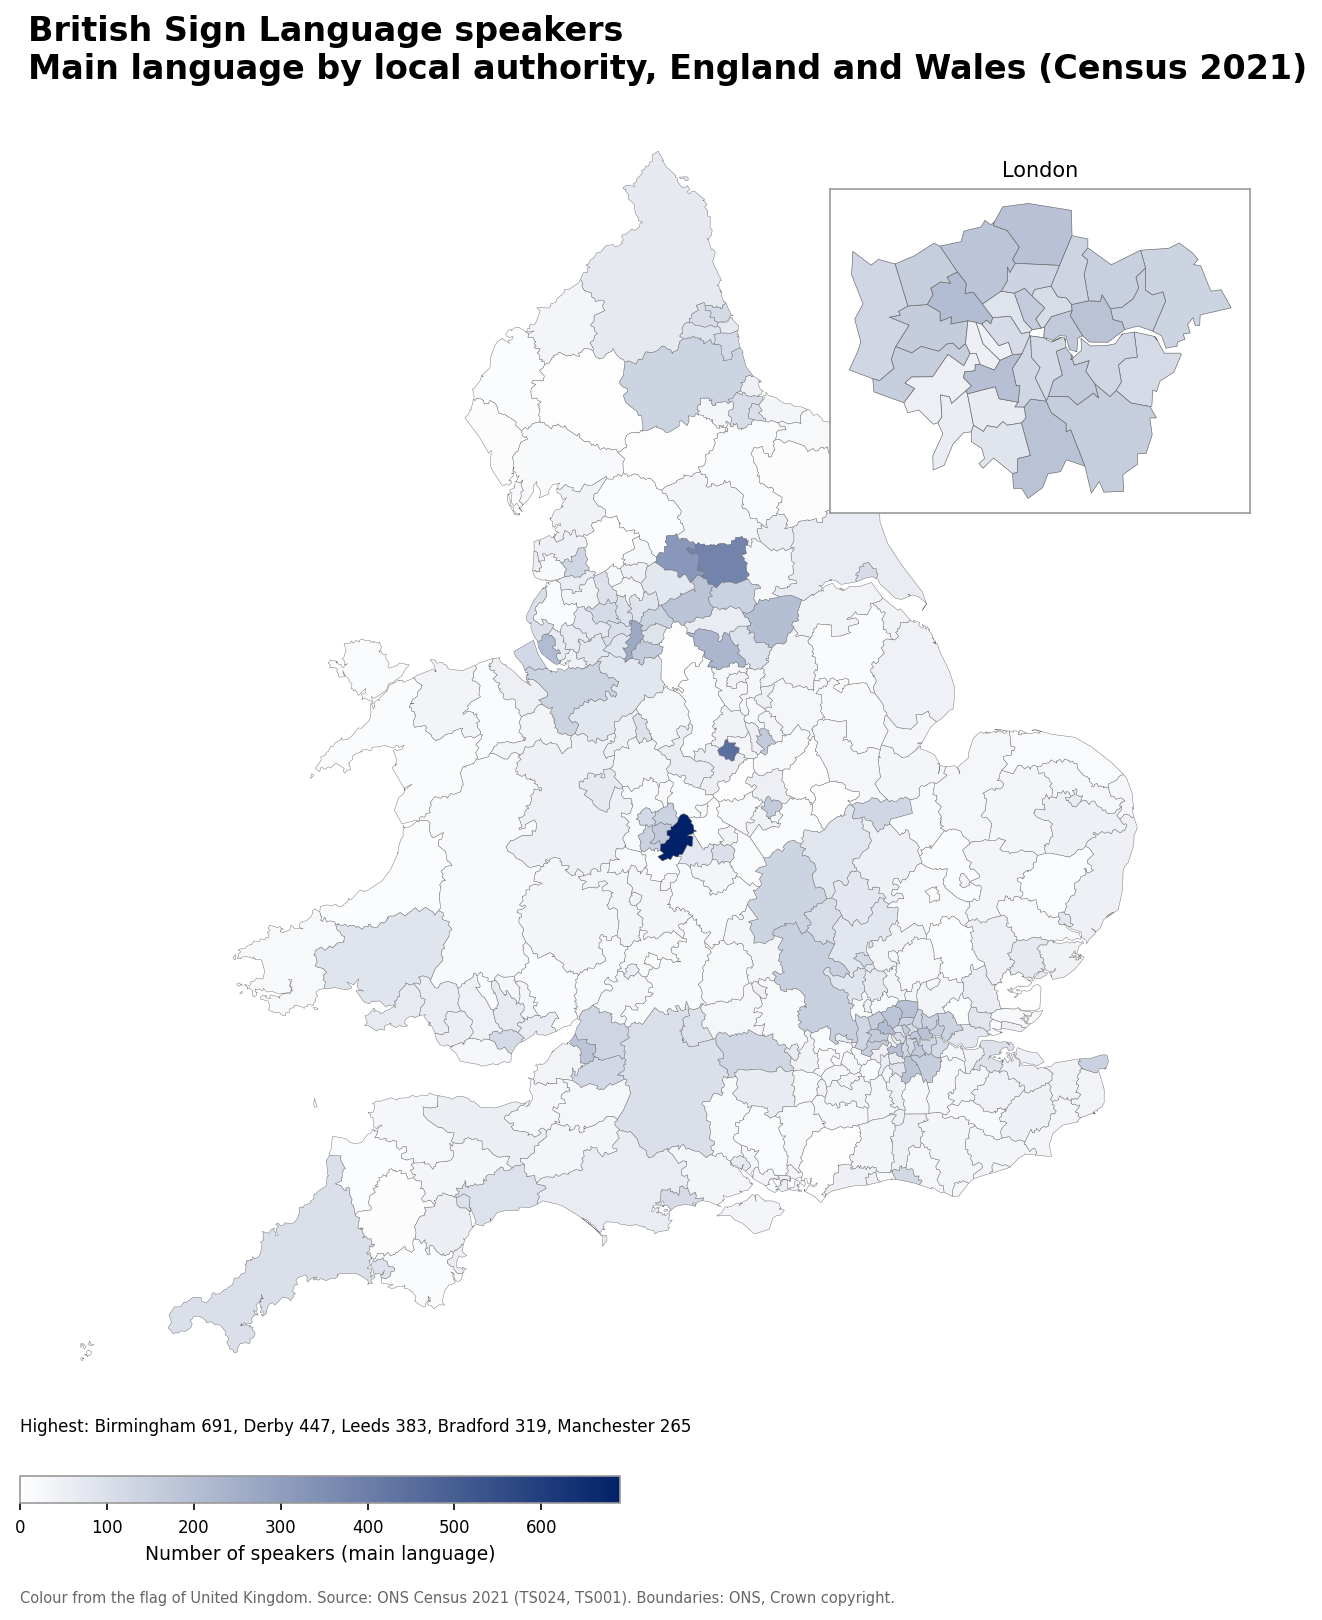
- Birmingham: 691
- Derby: 447
- Leeds: 383
- Bradford: 319
- Manchester: 265
British Sign Language speakers as a share of the population
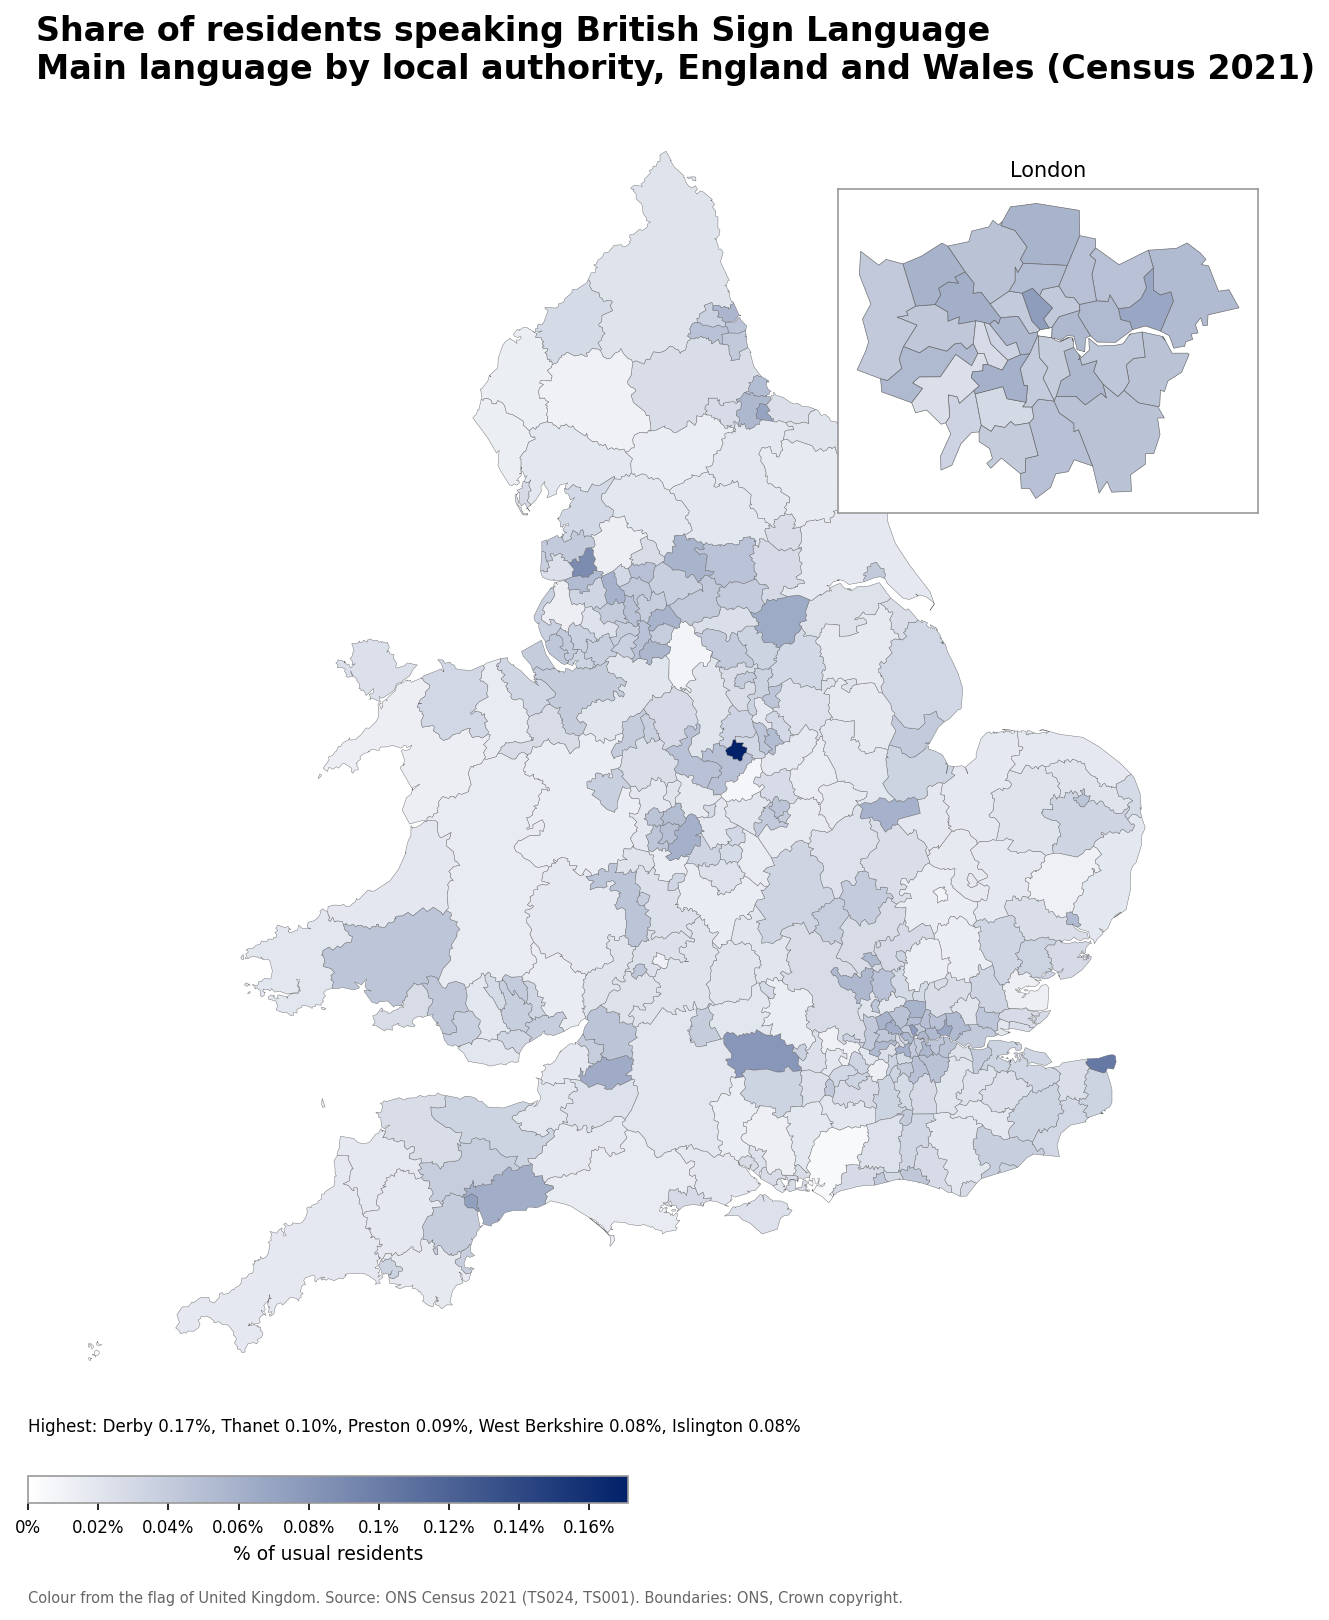
- Derby: 0.17% (447 speakers)
- Thanet: 0.10% (145 speakers)
- Preston: 0.09% (131 speakers)
- West Berkshire: 0.08% (129 speakers)
- Islington: 0.08% (163 speakers)
Number of French speakers
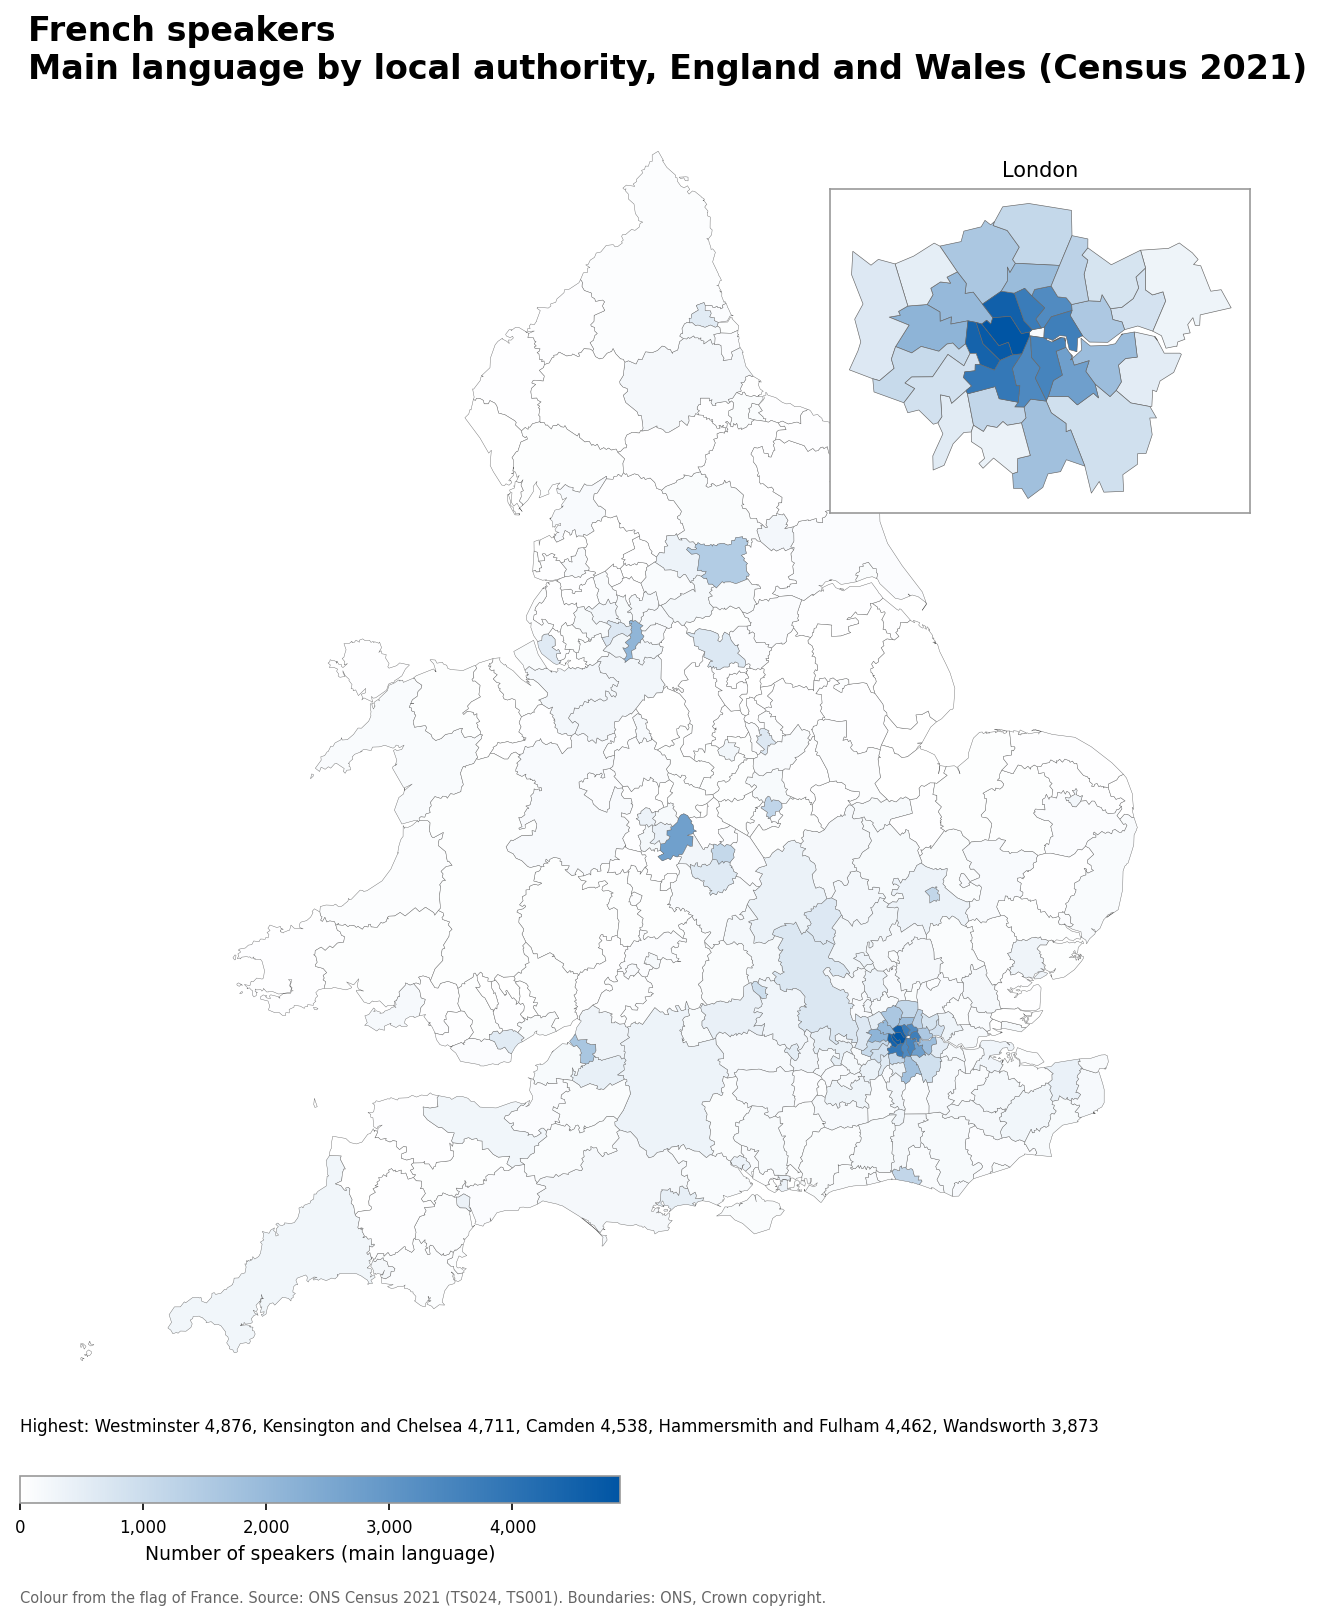
- Westminster: 4,876
- Kensington and Chelsea: 4,711
- Camden: 4,538
- Hammersmith and Fulham: 4,462
- Wandsworth: 3,873
French speakers as a share of the population
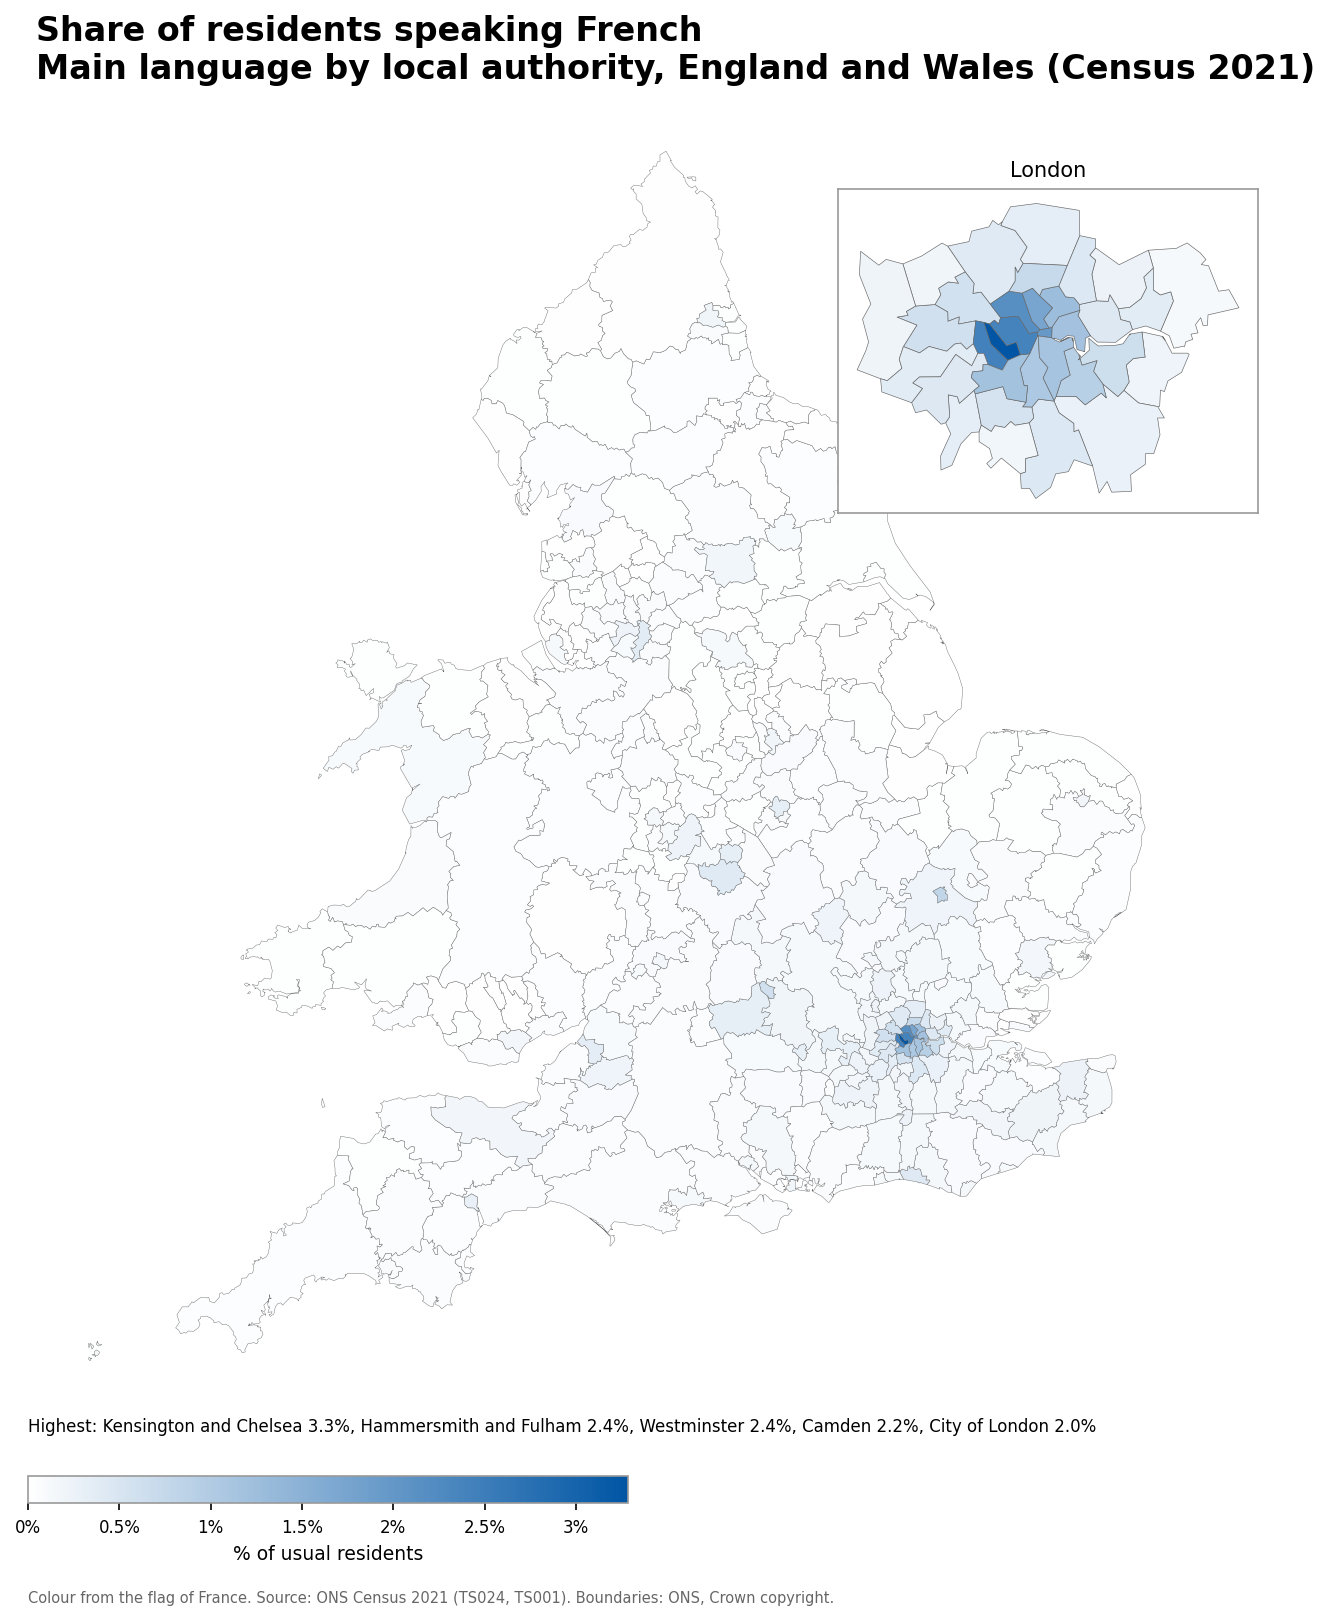
- Kensington and Chelsea: 3.3% (4,711 speakers)
- Hammersmith and Fulham: 2.4% (4,462 speakers)
- Westminster: 2.4% (4,876 speakers)
- Camden: 2.2% (4,538 speakers)
- City of London: 2.0% (169 speakers)
Number of Portuguese speakers
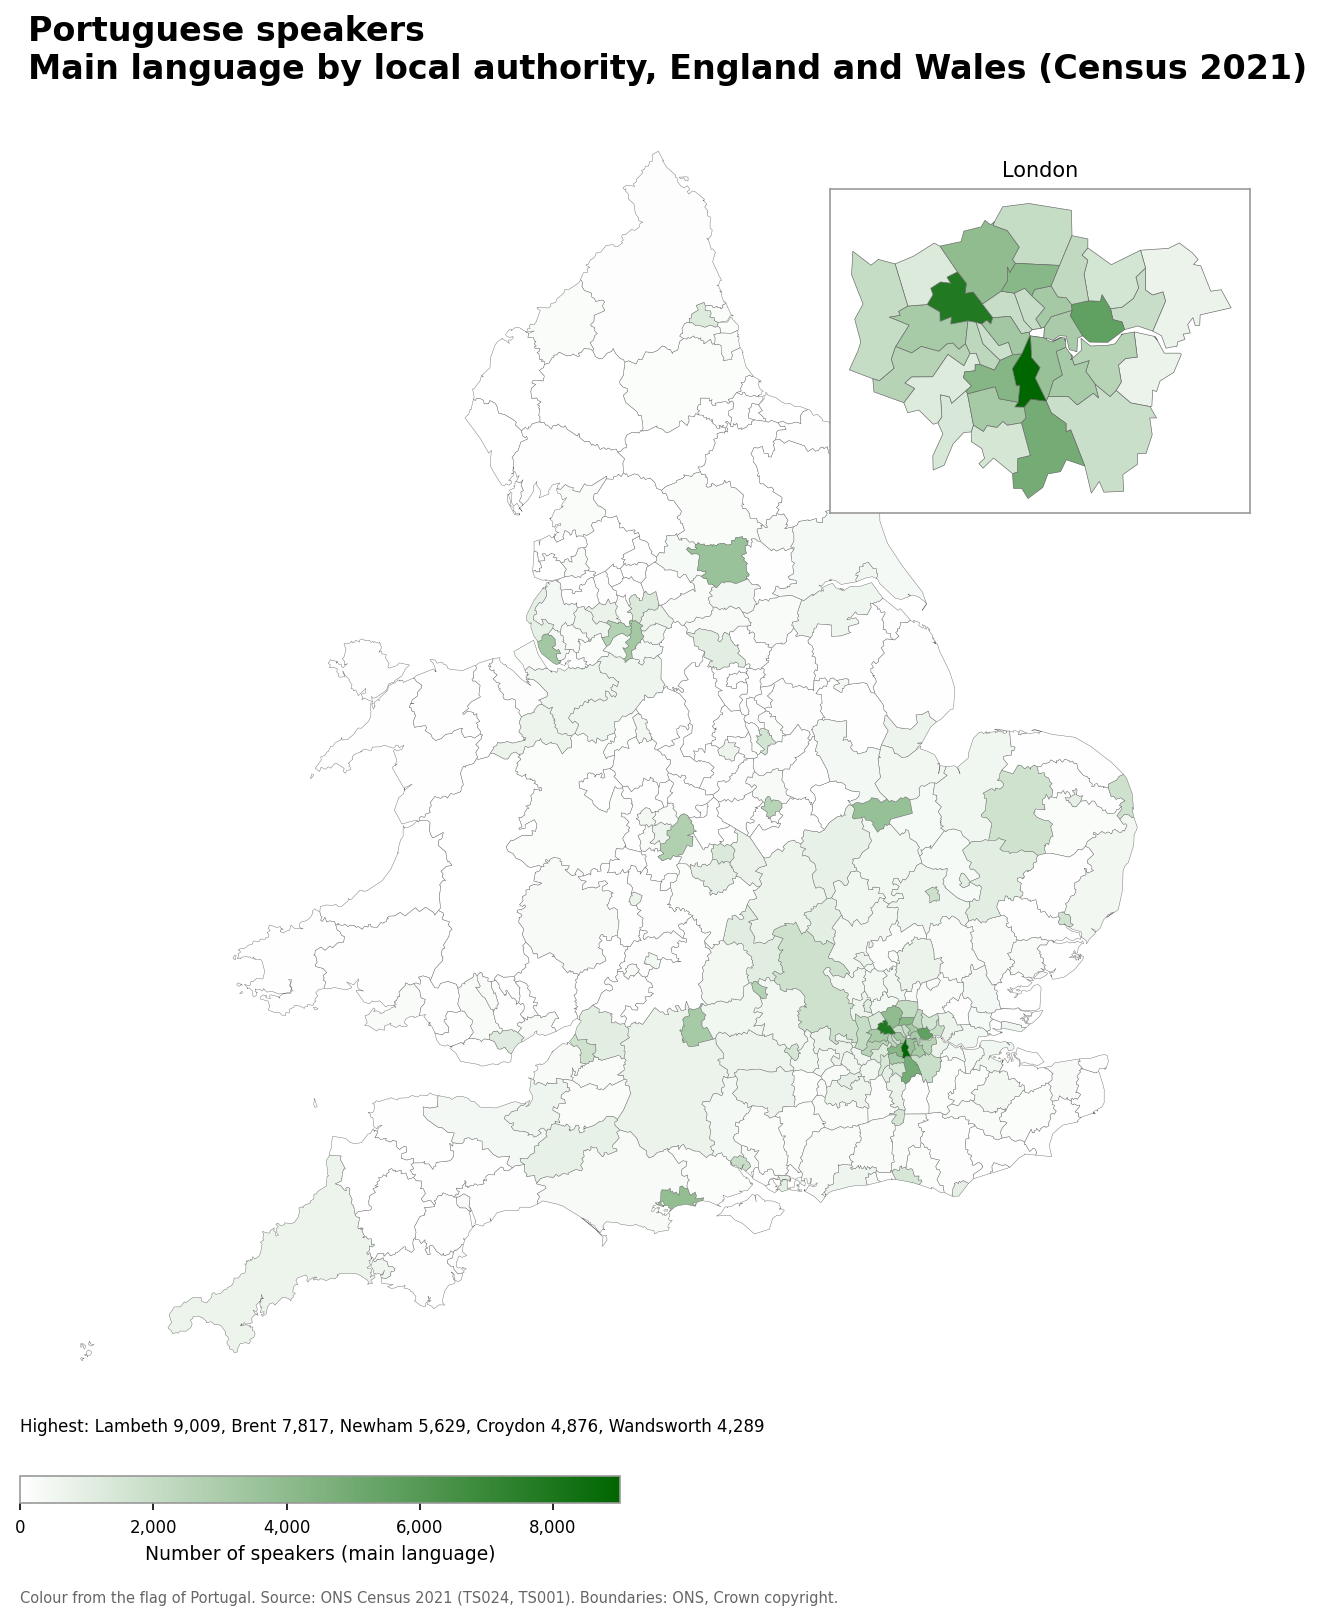
- Lambeth: 9,009
- Brent: 7,817
- Newham: 5,629
- Croydon: 4,876
- Wandsworth: 4,289
Portuguese speakers as a share of the population
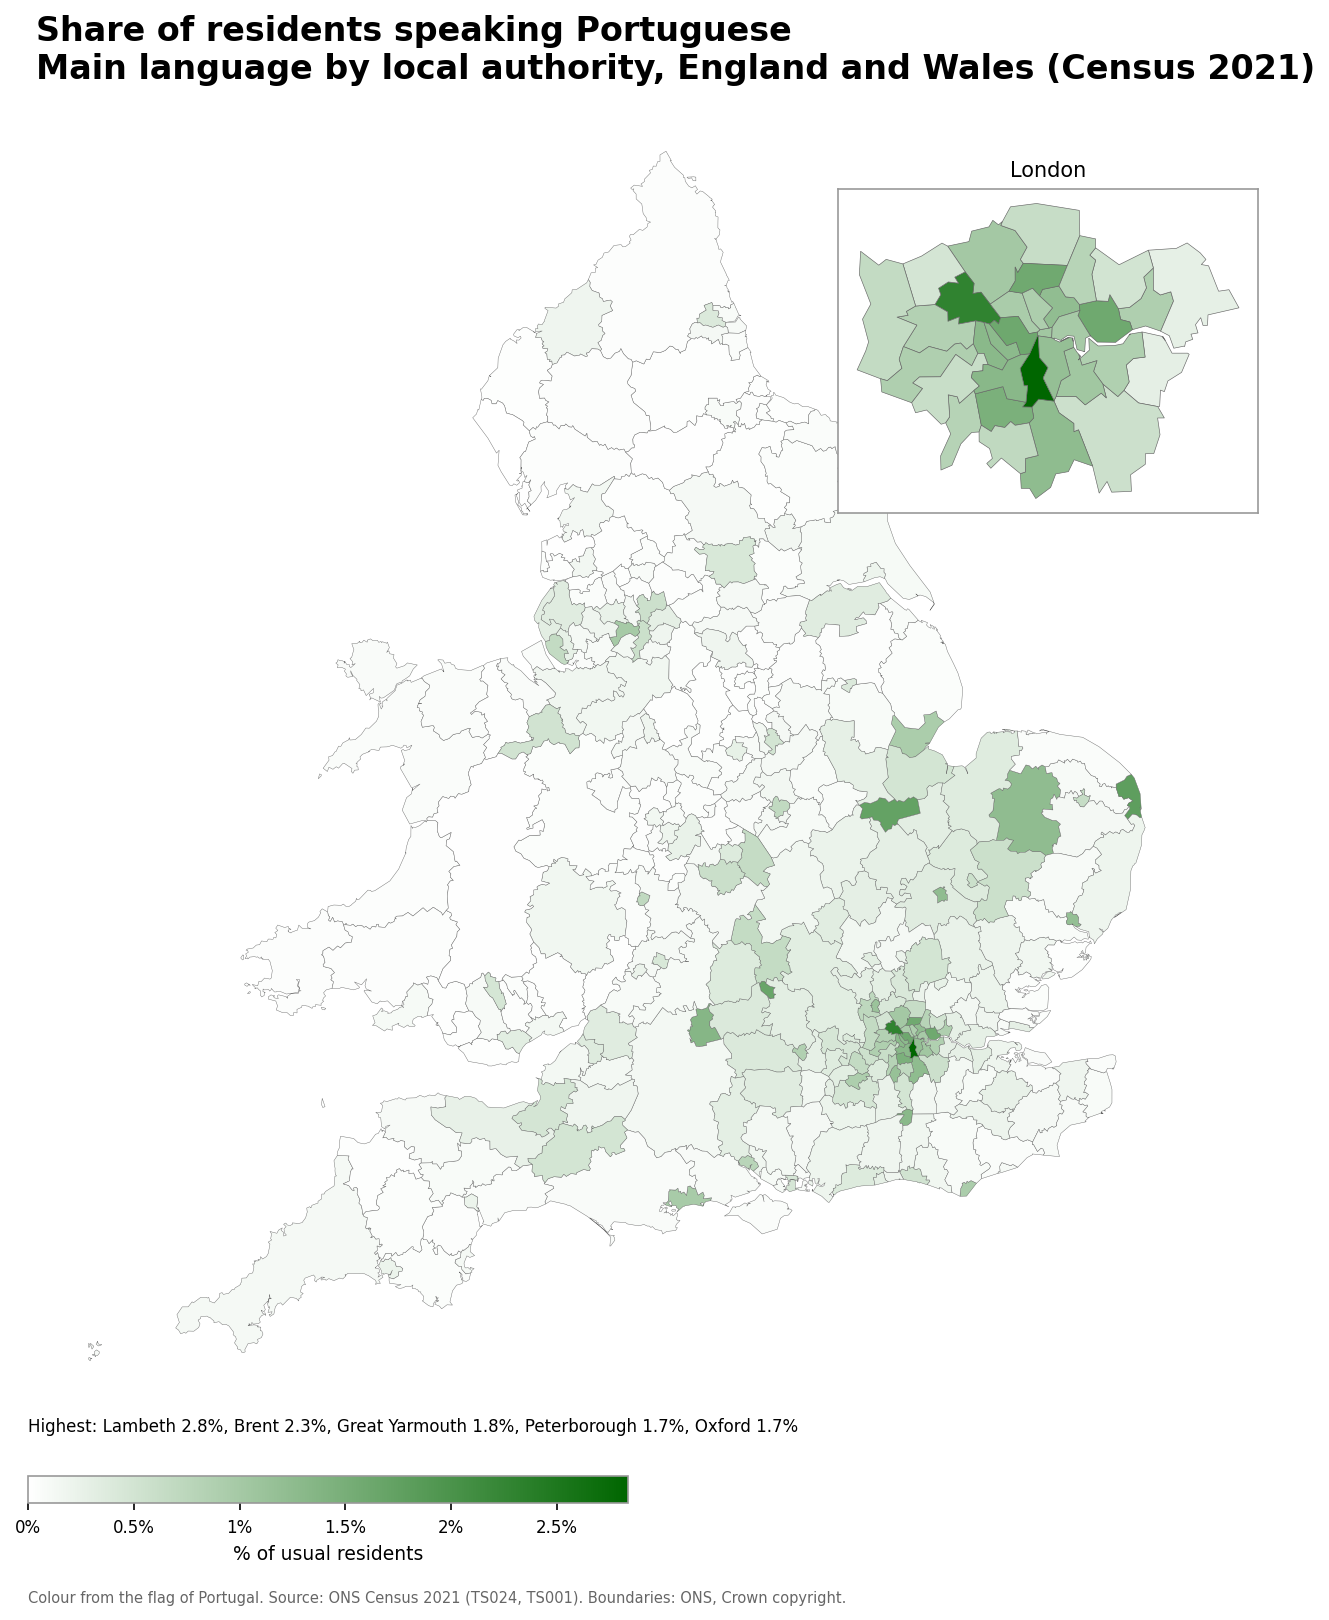
- Lambeth: 2.8% (9,009 speakers)
- Brent: 2.3% (7,817 speakers)
- Great Yarmouth: 1.8% (1,782 speakers)
- Peterborough: 1.7% (3,707 speakers)
- Oxford: 1.7% (2,707 speakers)
Number of Spanish speakers
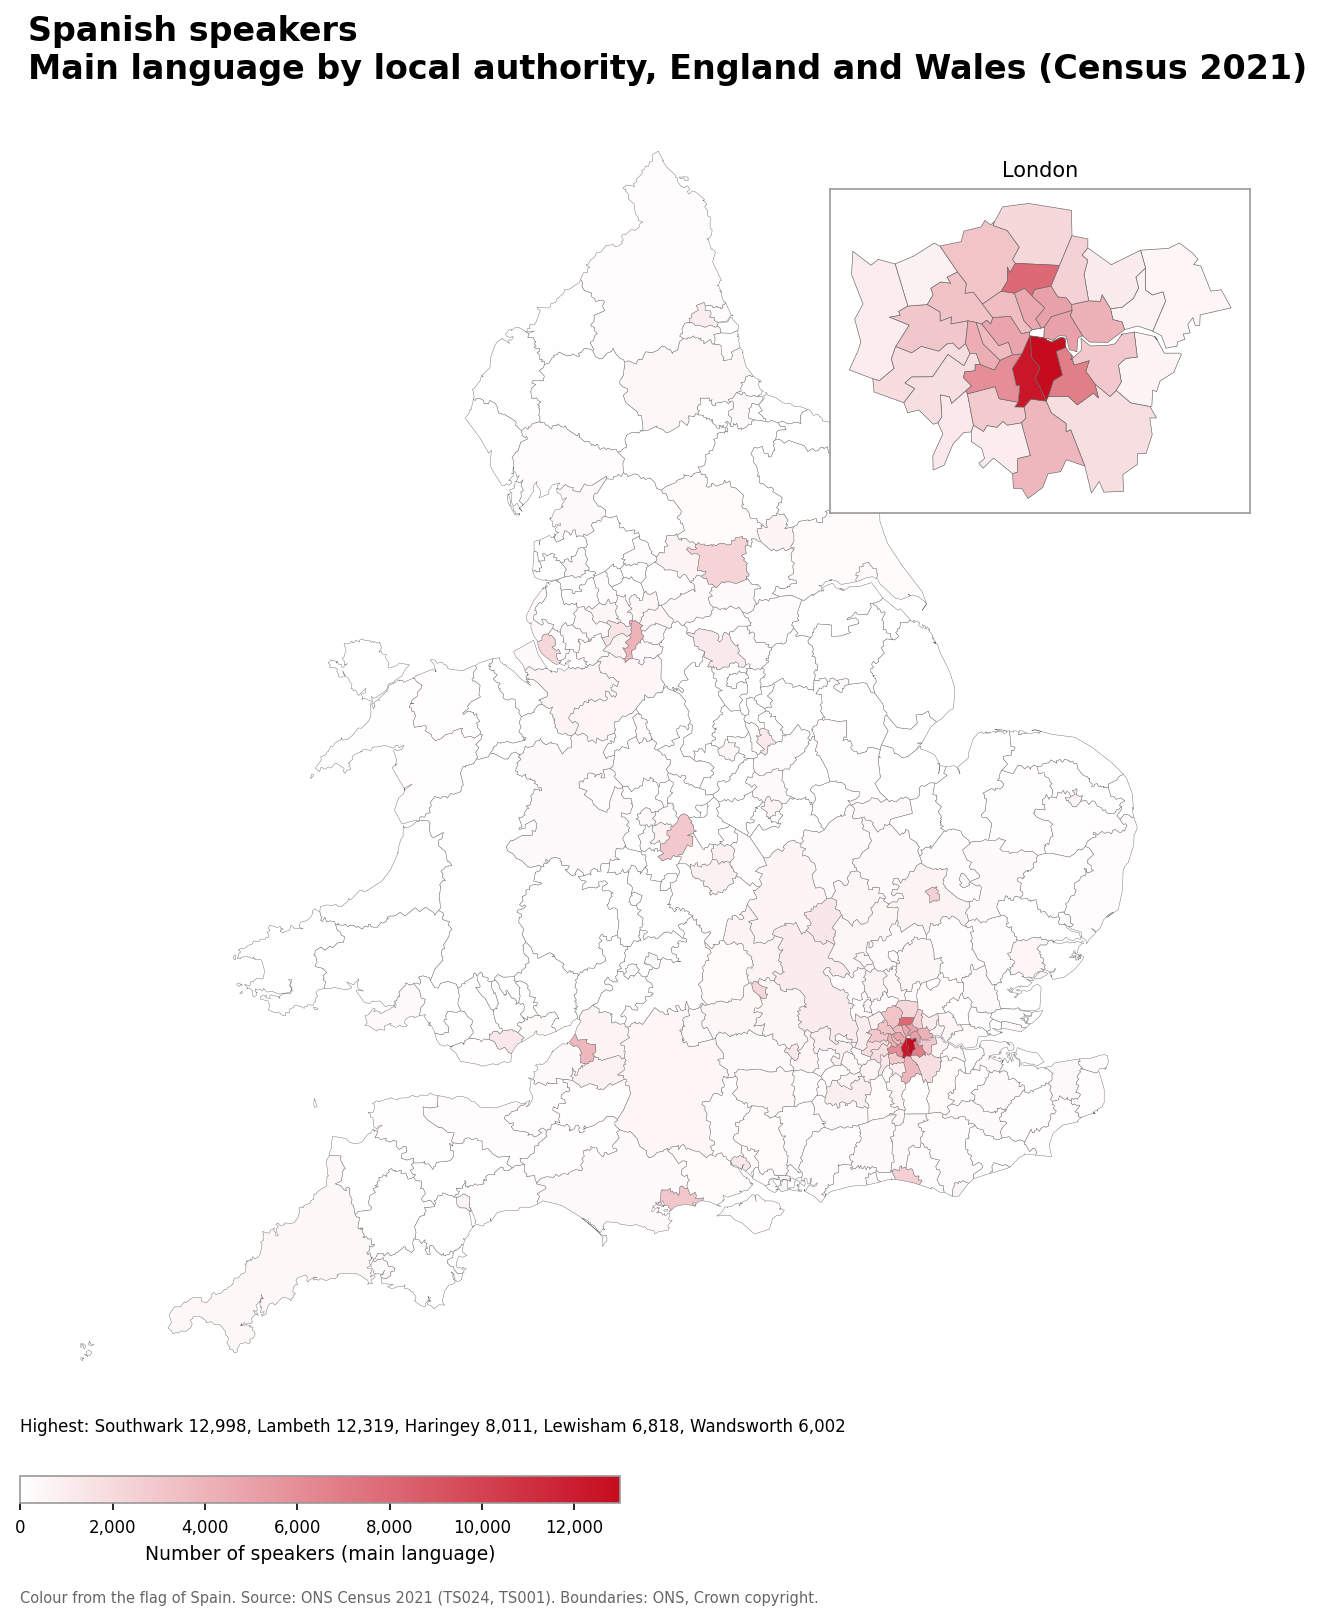
- Southwark: 12,998
- Lambeth: 12,319
- Haringey: 8,011
- Lewisham: 6,818
- Wandsworth: 6,002
Spanish speakers as a share of the population
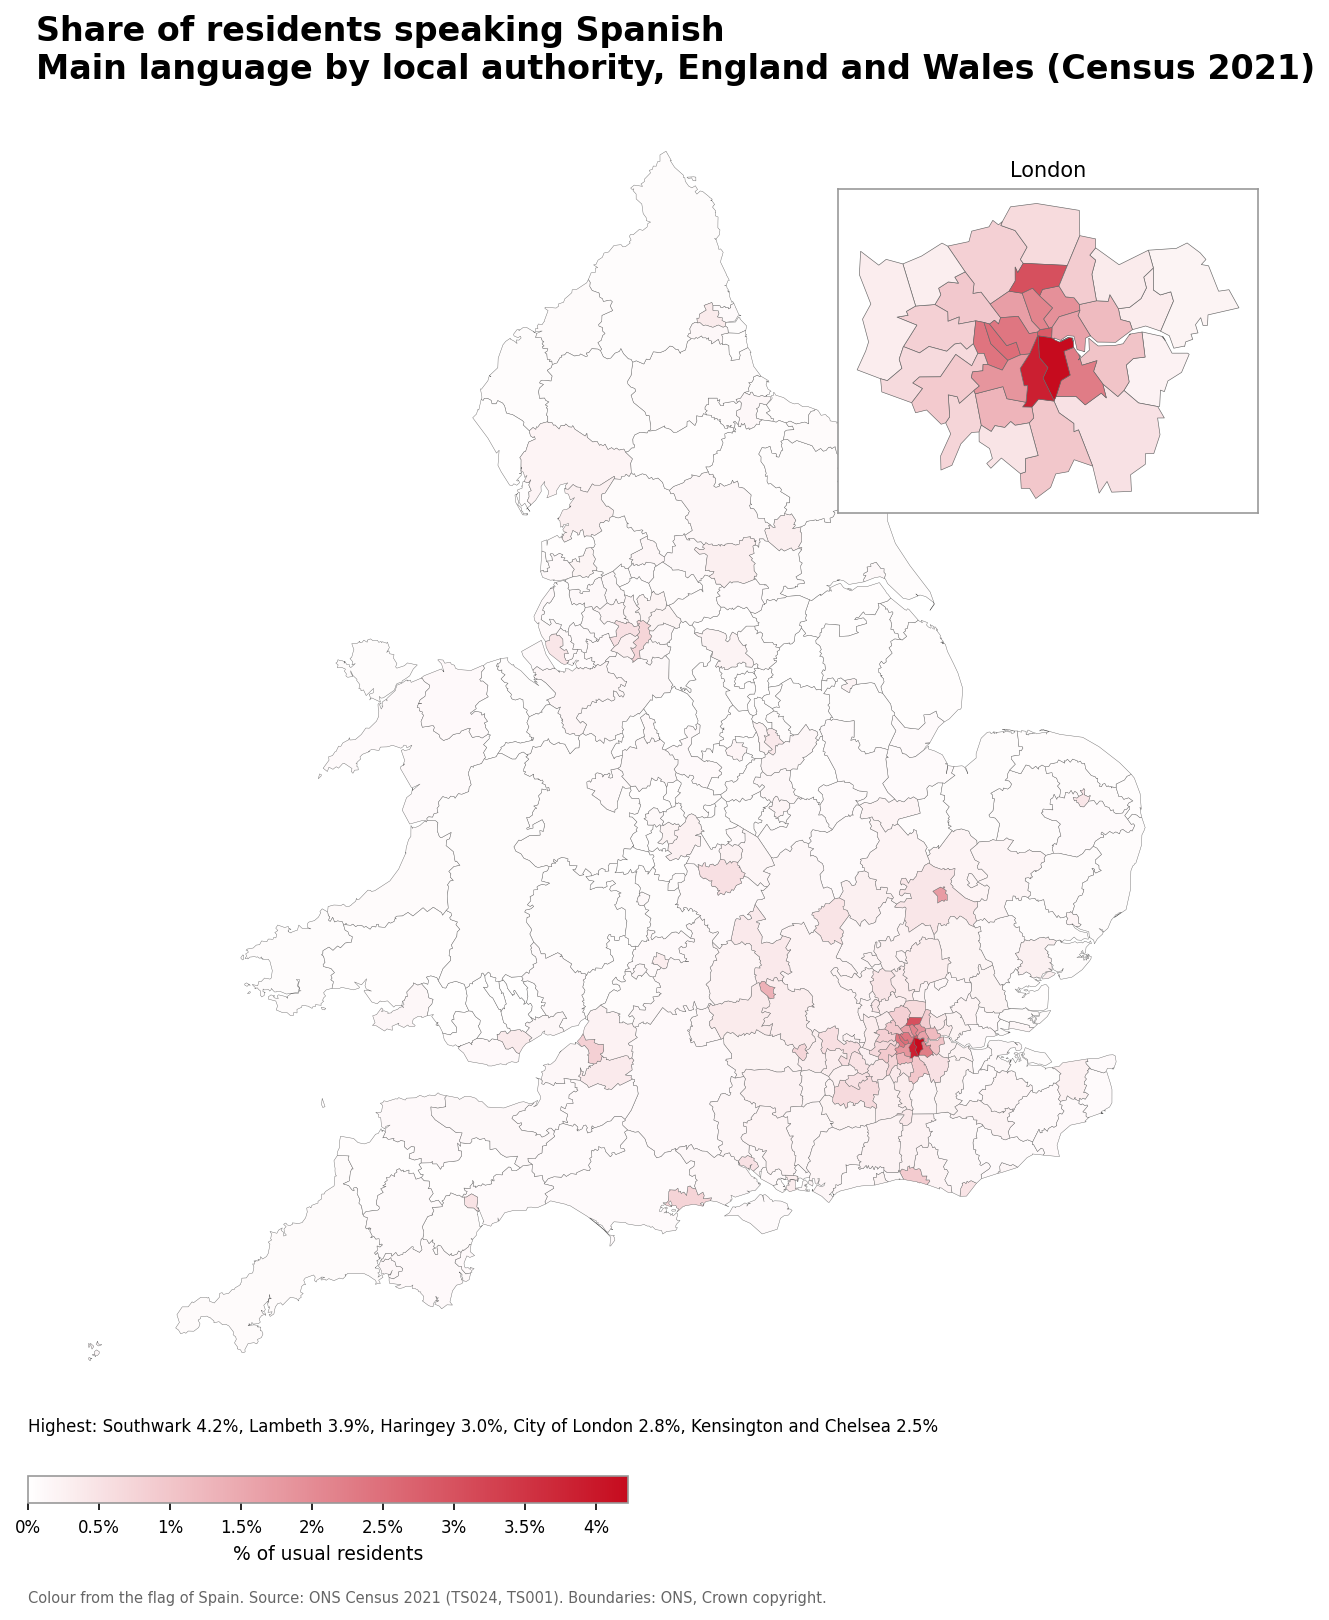
- Southwark: 4.2% (12,998 speakers)
- Lambeth: 3.9% (12,319 speakers)
- Haringey: 3.0% (8,011 speakers)
- City of London: 2.8% (243 speakers)
- Kensington and Chelsea: 2.5% (3,630 speakers)
Number of Italian speakers
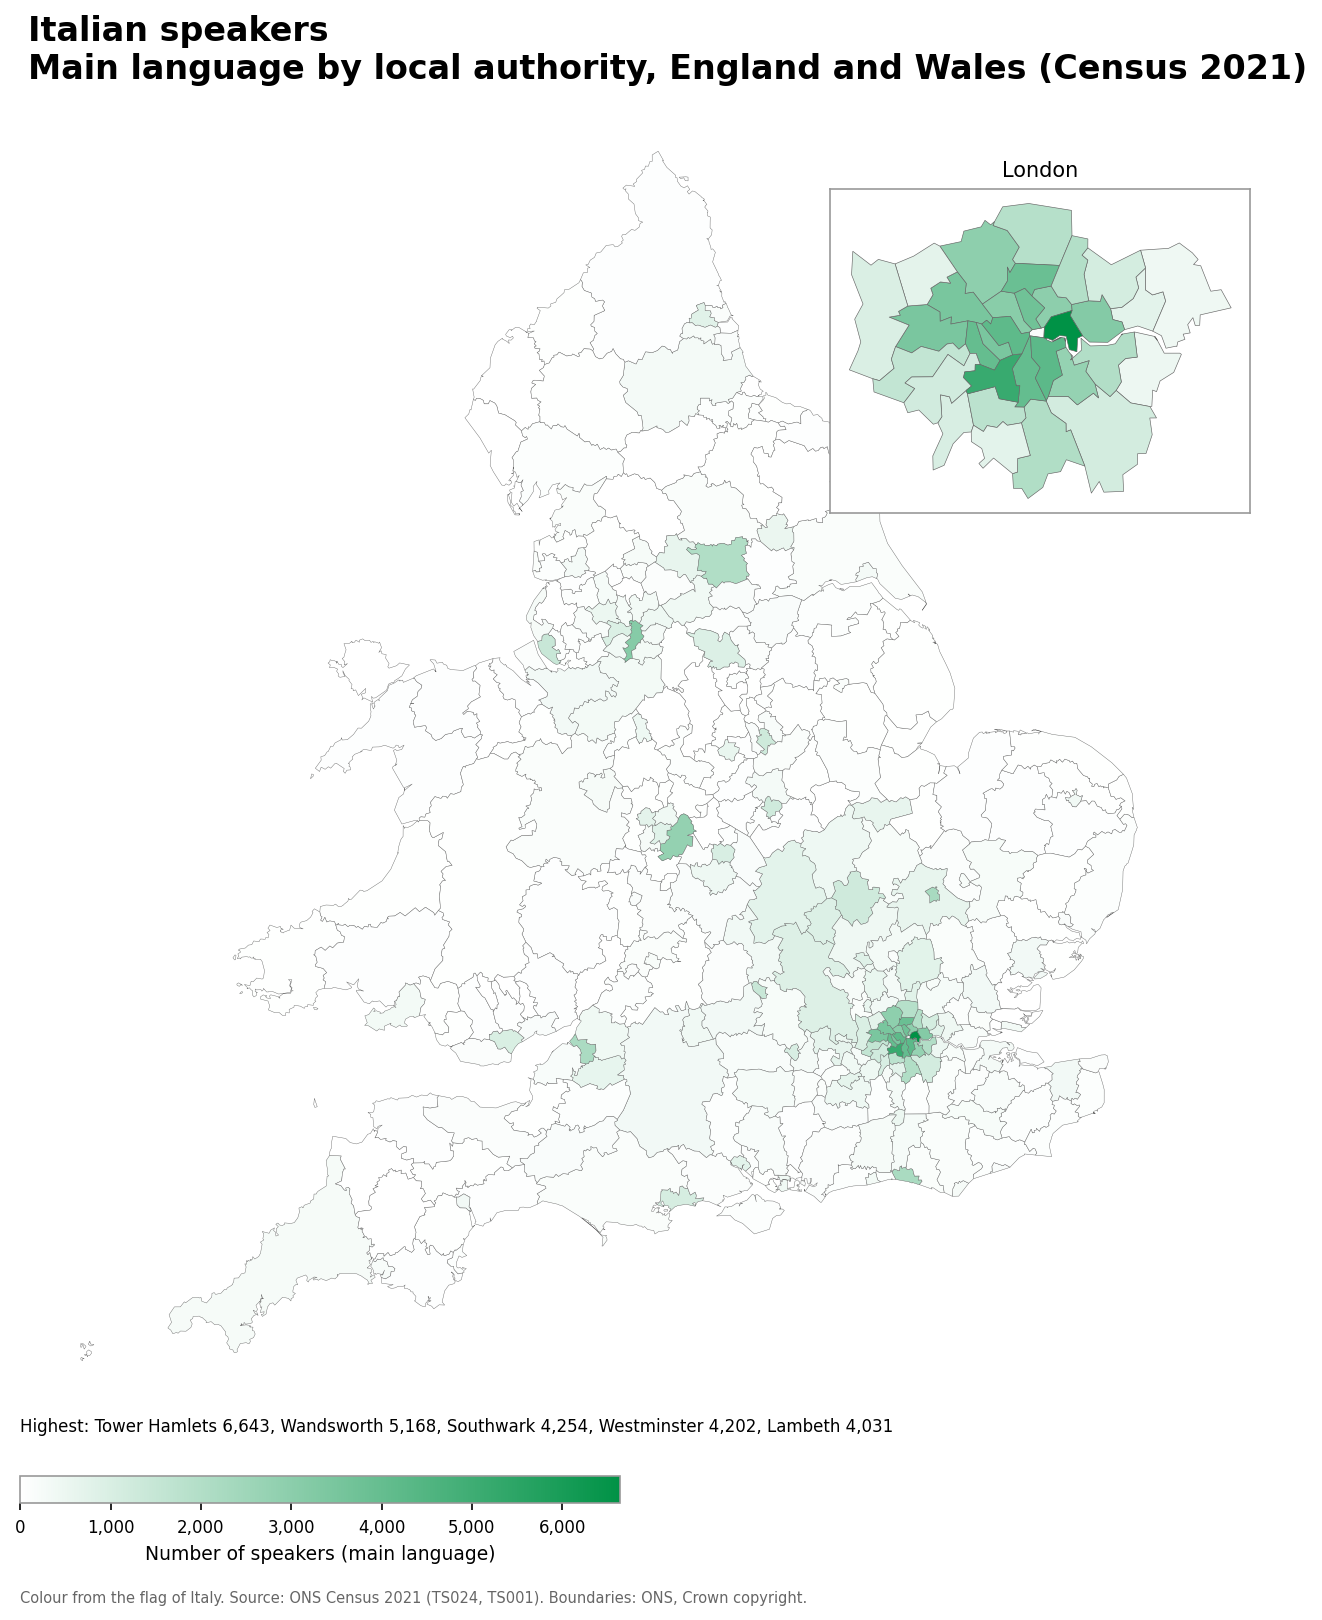
- Tower Hamlets: 6,643
- Wandsworth: 5,168
- Southwark: 4,254
- Westminster: 4,202
- Lambeth: 4,031
Italian speakers as a share of the population
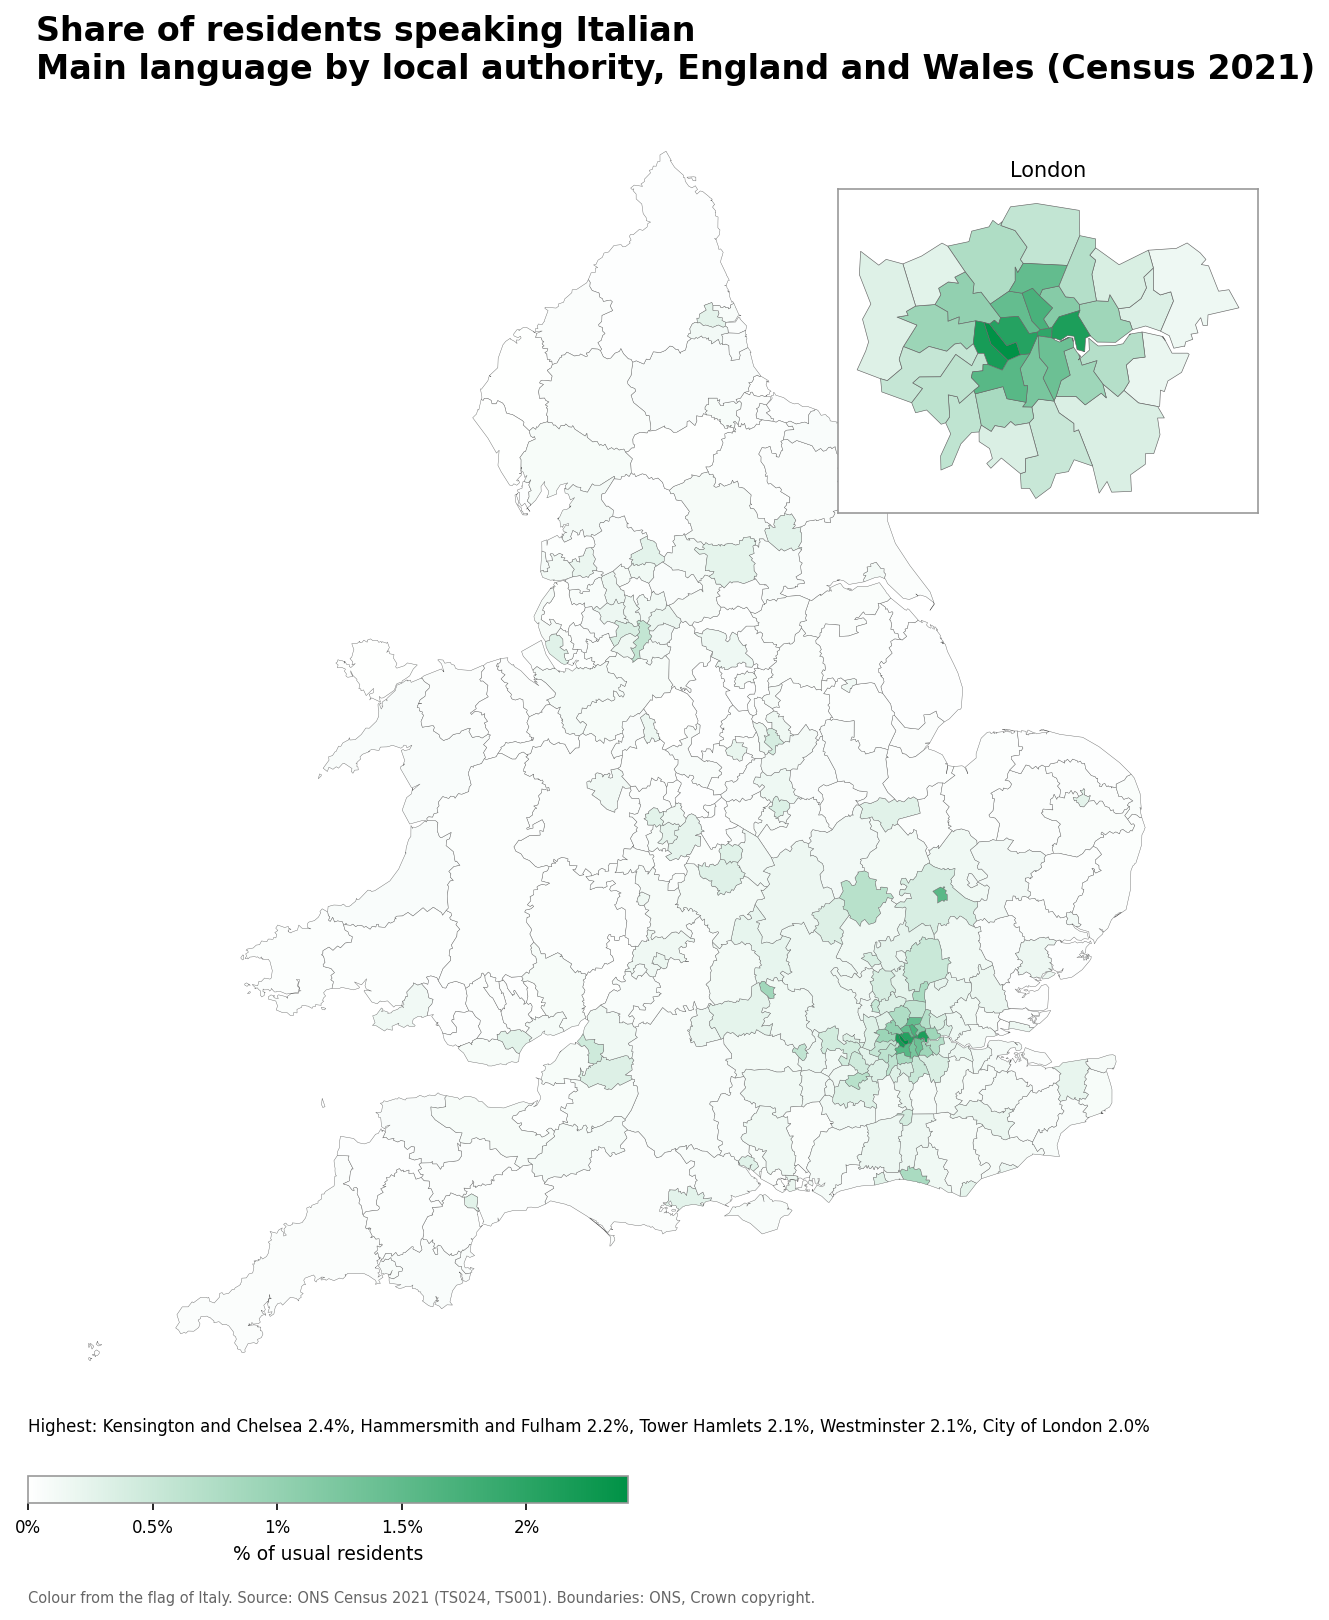
- Kensington and Chelsea: 2.4% (3,452 speakers)
- Hammersmith and Fulham: 2.2% (4,003 speakers)
- Tower Hamlets: 2.1% (6,643 speakers)
- Westminster: 2.1% (4,202 speakers)
- City of London: 2.0% (168 speakers)
Number of German speakers
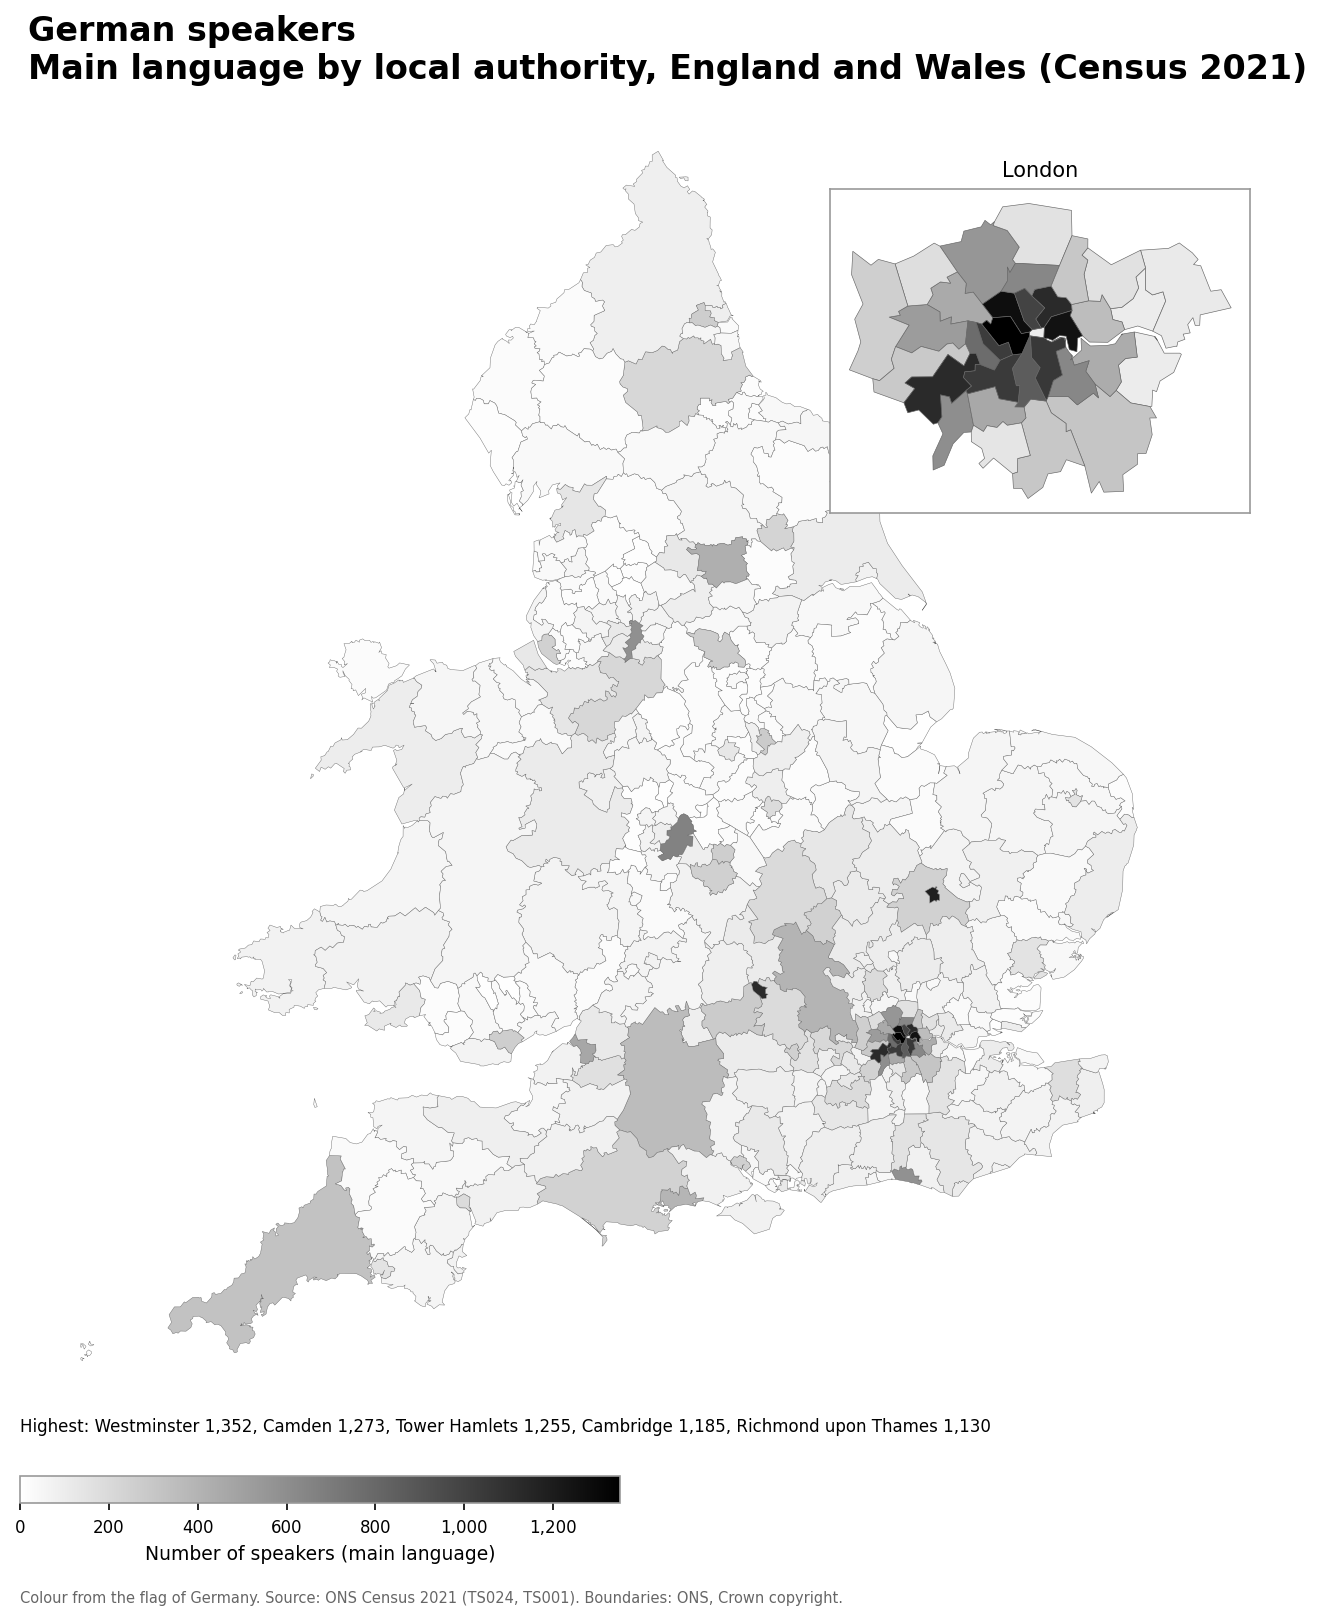
- Westminster: 1,352
- Camden: 1,273
- Tower Hamlets: 1,255
- Cambridge: 1,185
- Richmond upon Thames: 1,130
German speakers as a share of the population
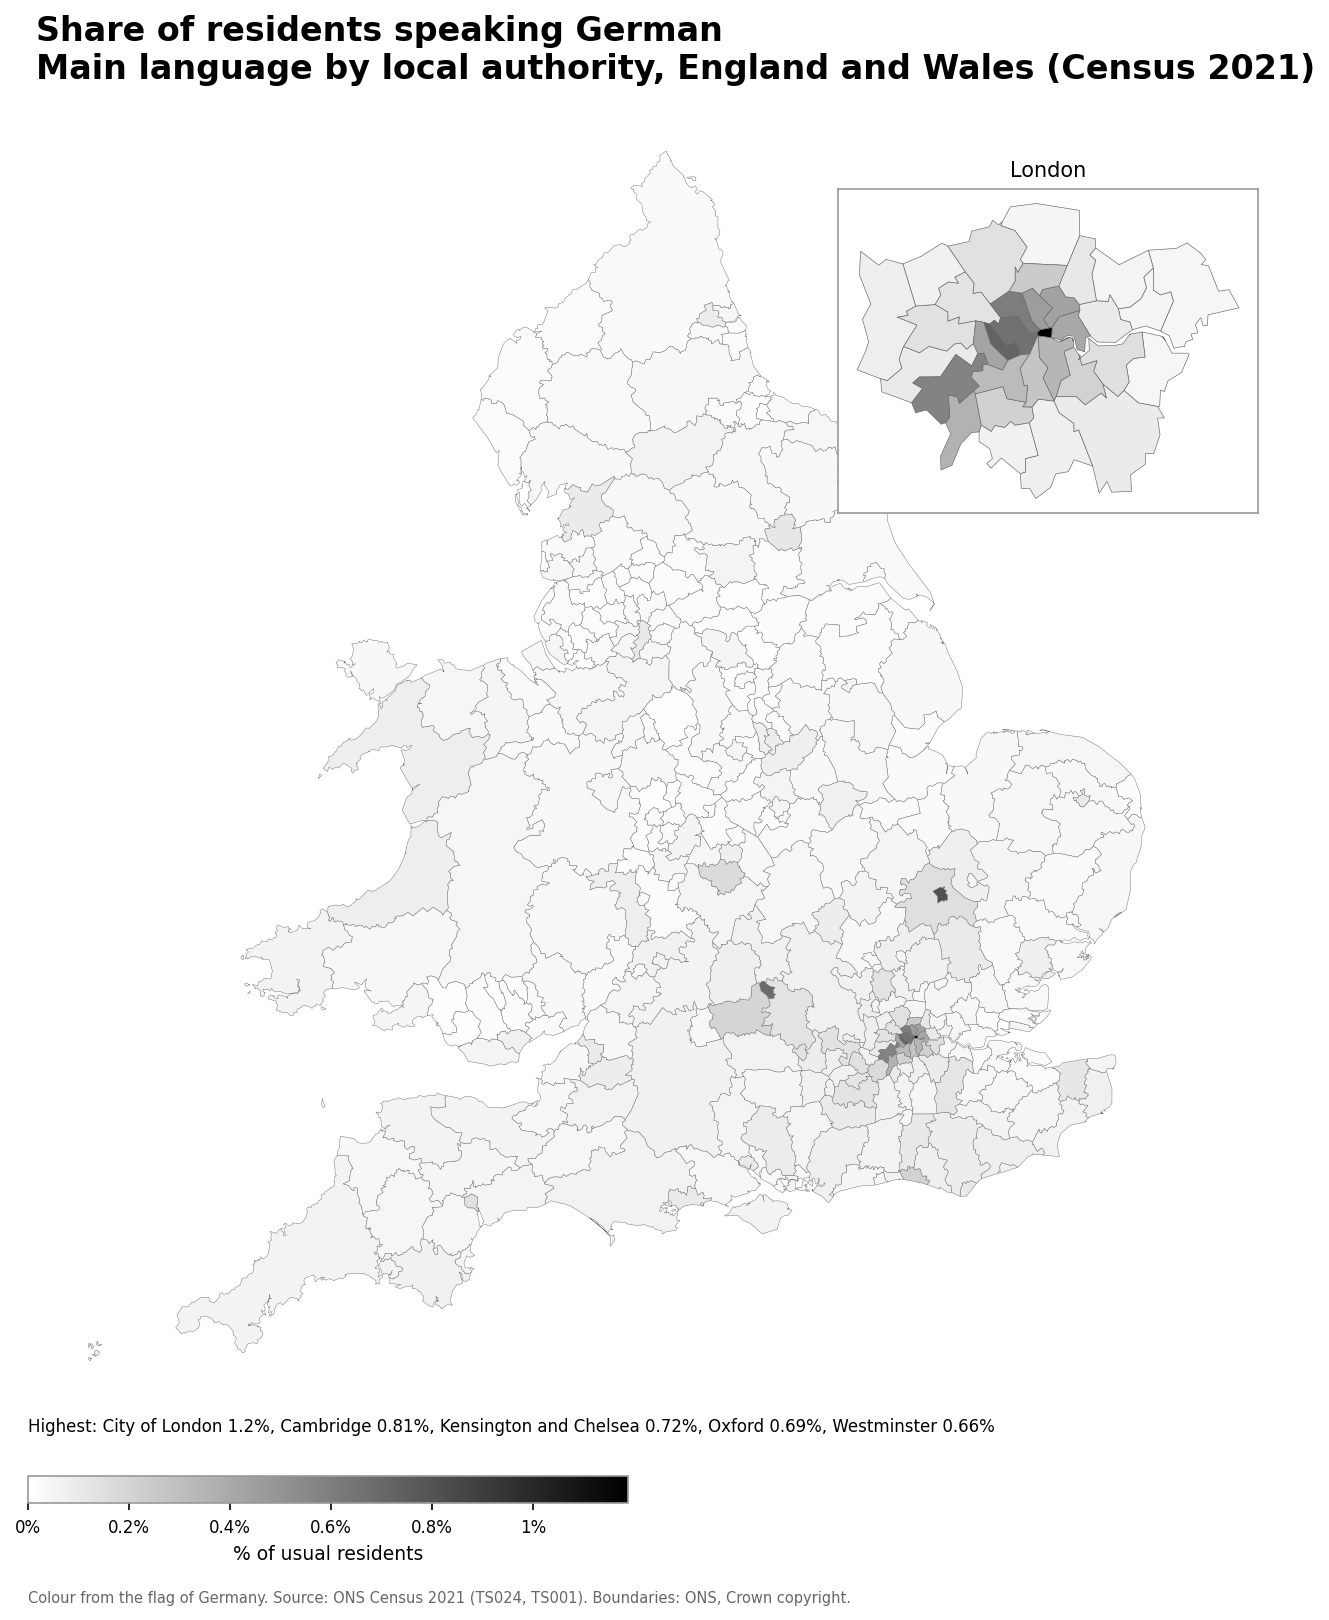
- City of London: 1.2% (102 speakers)
- Cambridge: 0.81% (1,185 speakers)
- Kensington and Chelsea: 0.72% (1,033 speakers)
- Oxford: 0.69% (1,120 speakers)
- Westminster: 0.66% (1,352 speakers)
Number of Dutch speakers
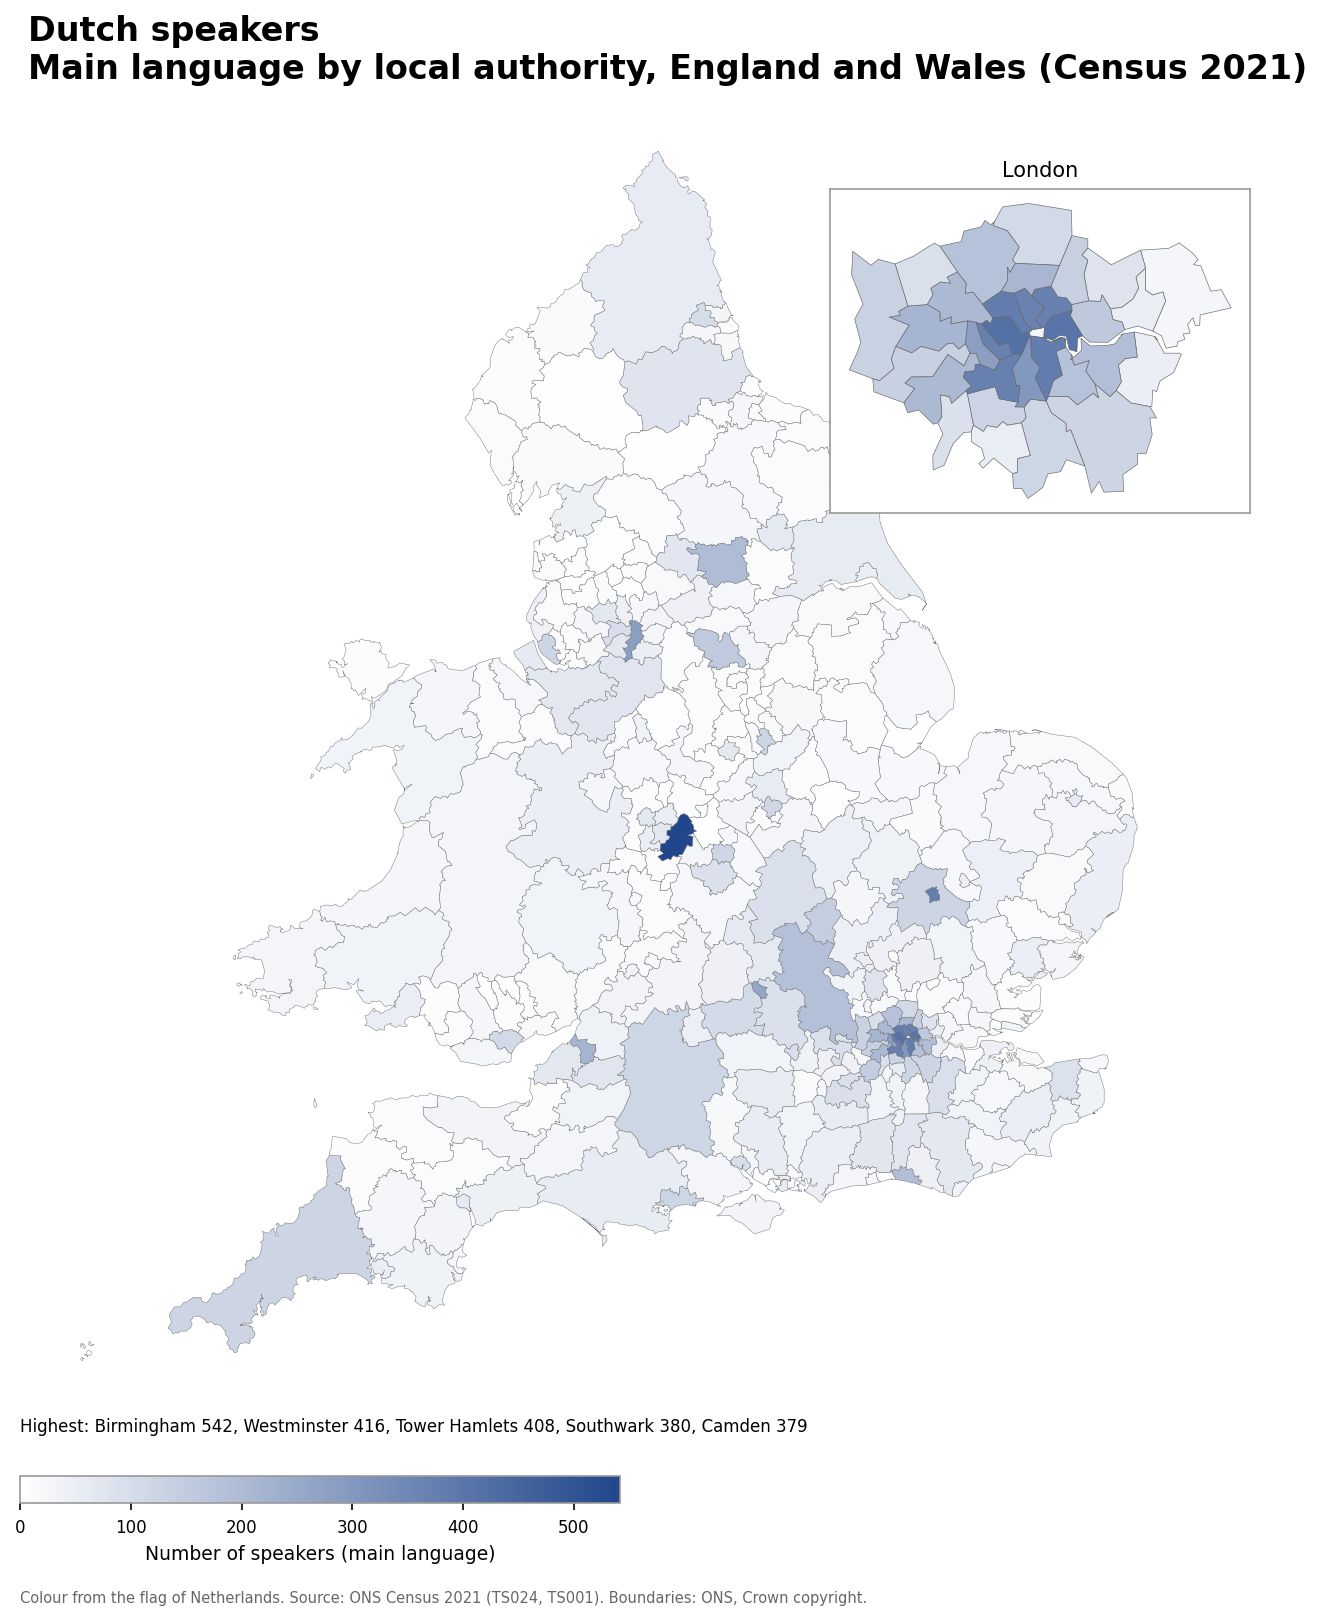
- Birmingham: 542
- Westminster: 416
- Tower Hamlets: 408
- Southwark: 380
- Camden: 379
Dutch speakers as a share of the population
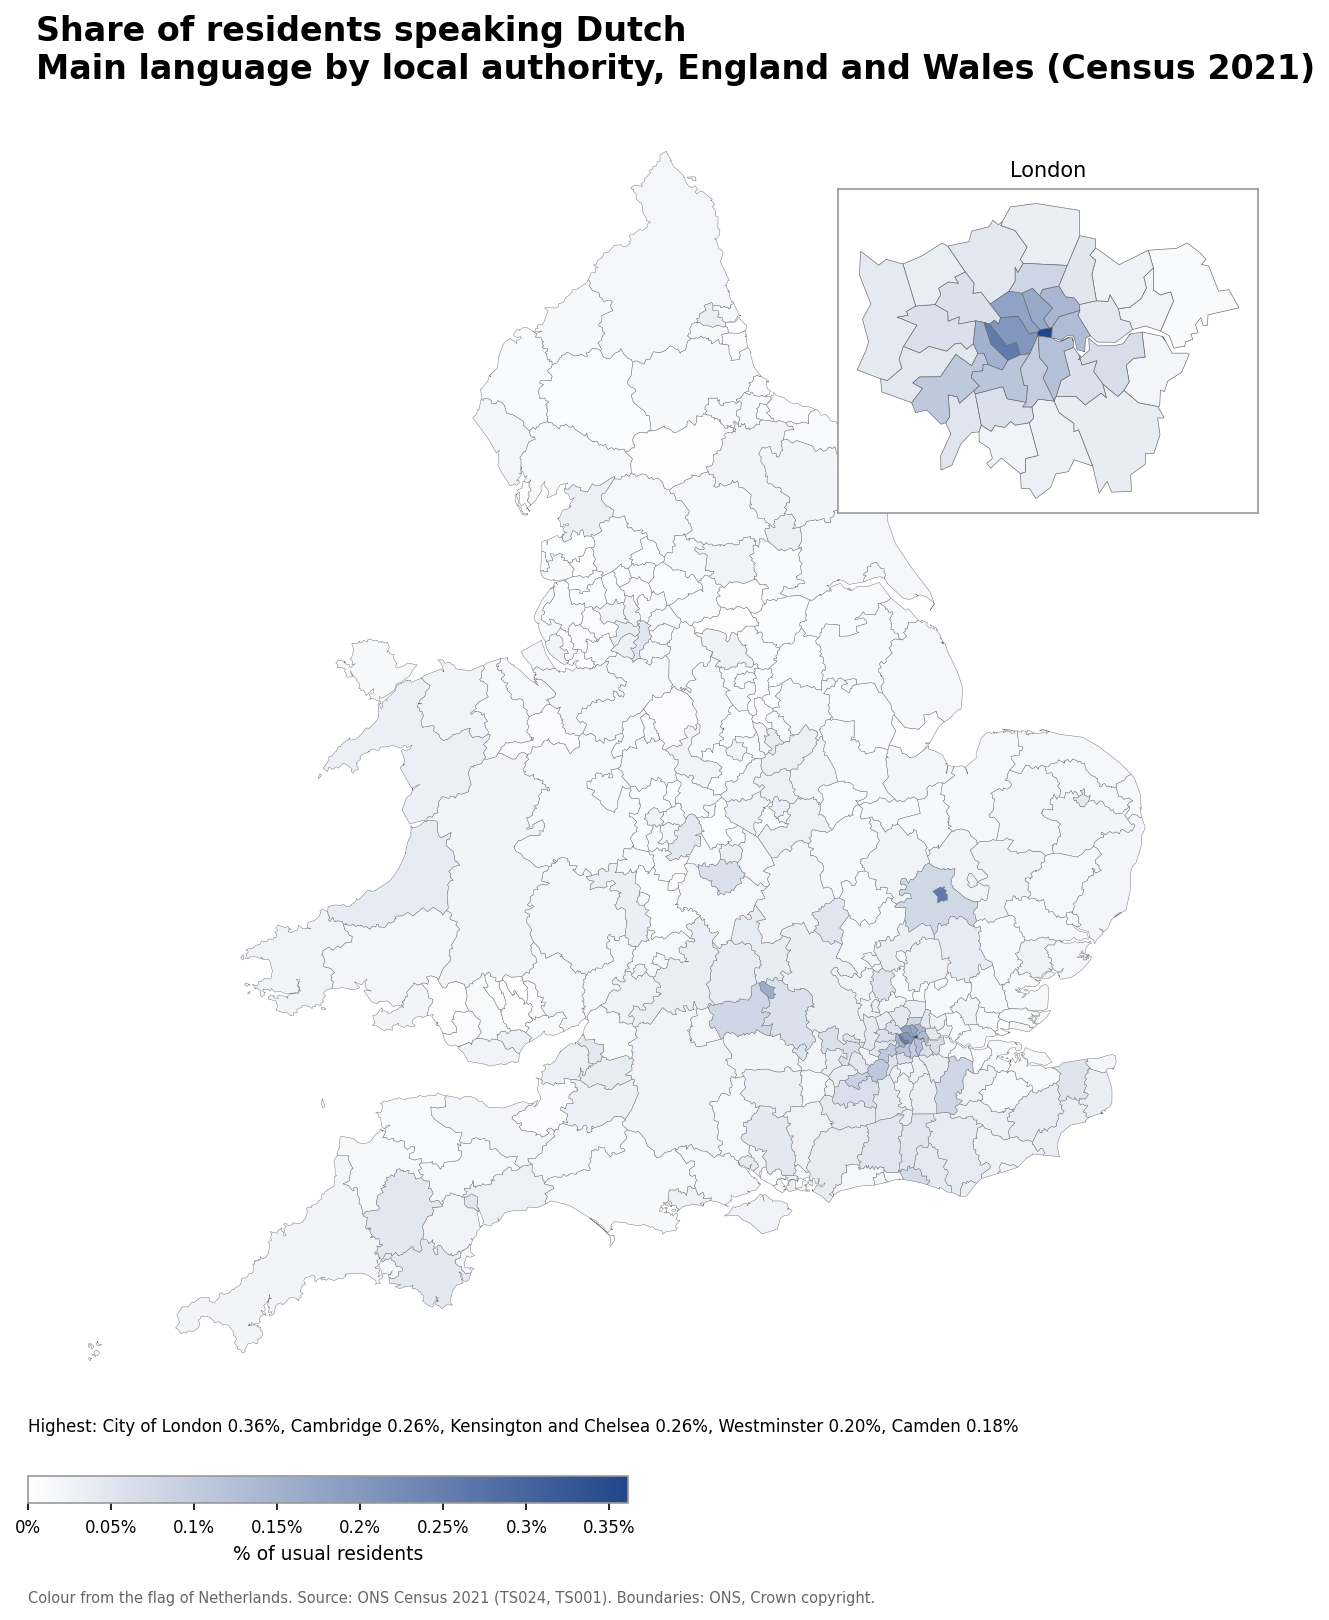
- City of London: 0.36% (31 speakers)
- Cambridge: 0.26% (377 speakers)
- Kensington and Chelsea: 0.26% (370 speakers)
- Westminster: 0.20% (416 speakers)
- Camden: 0.18% (379 speakers)
Number of Greek speakers
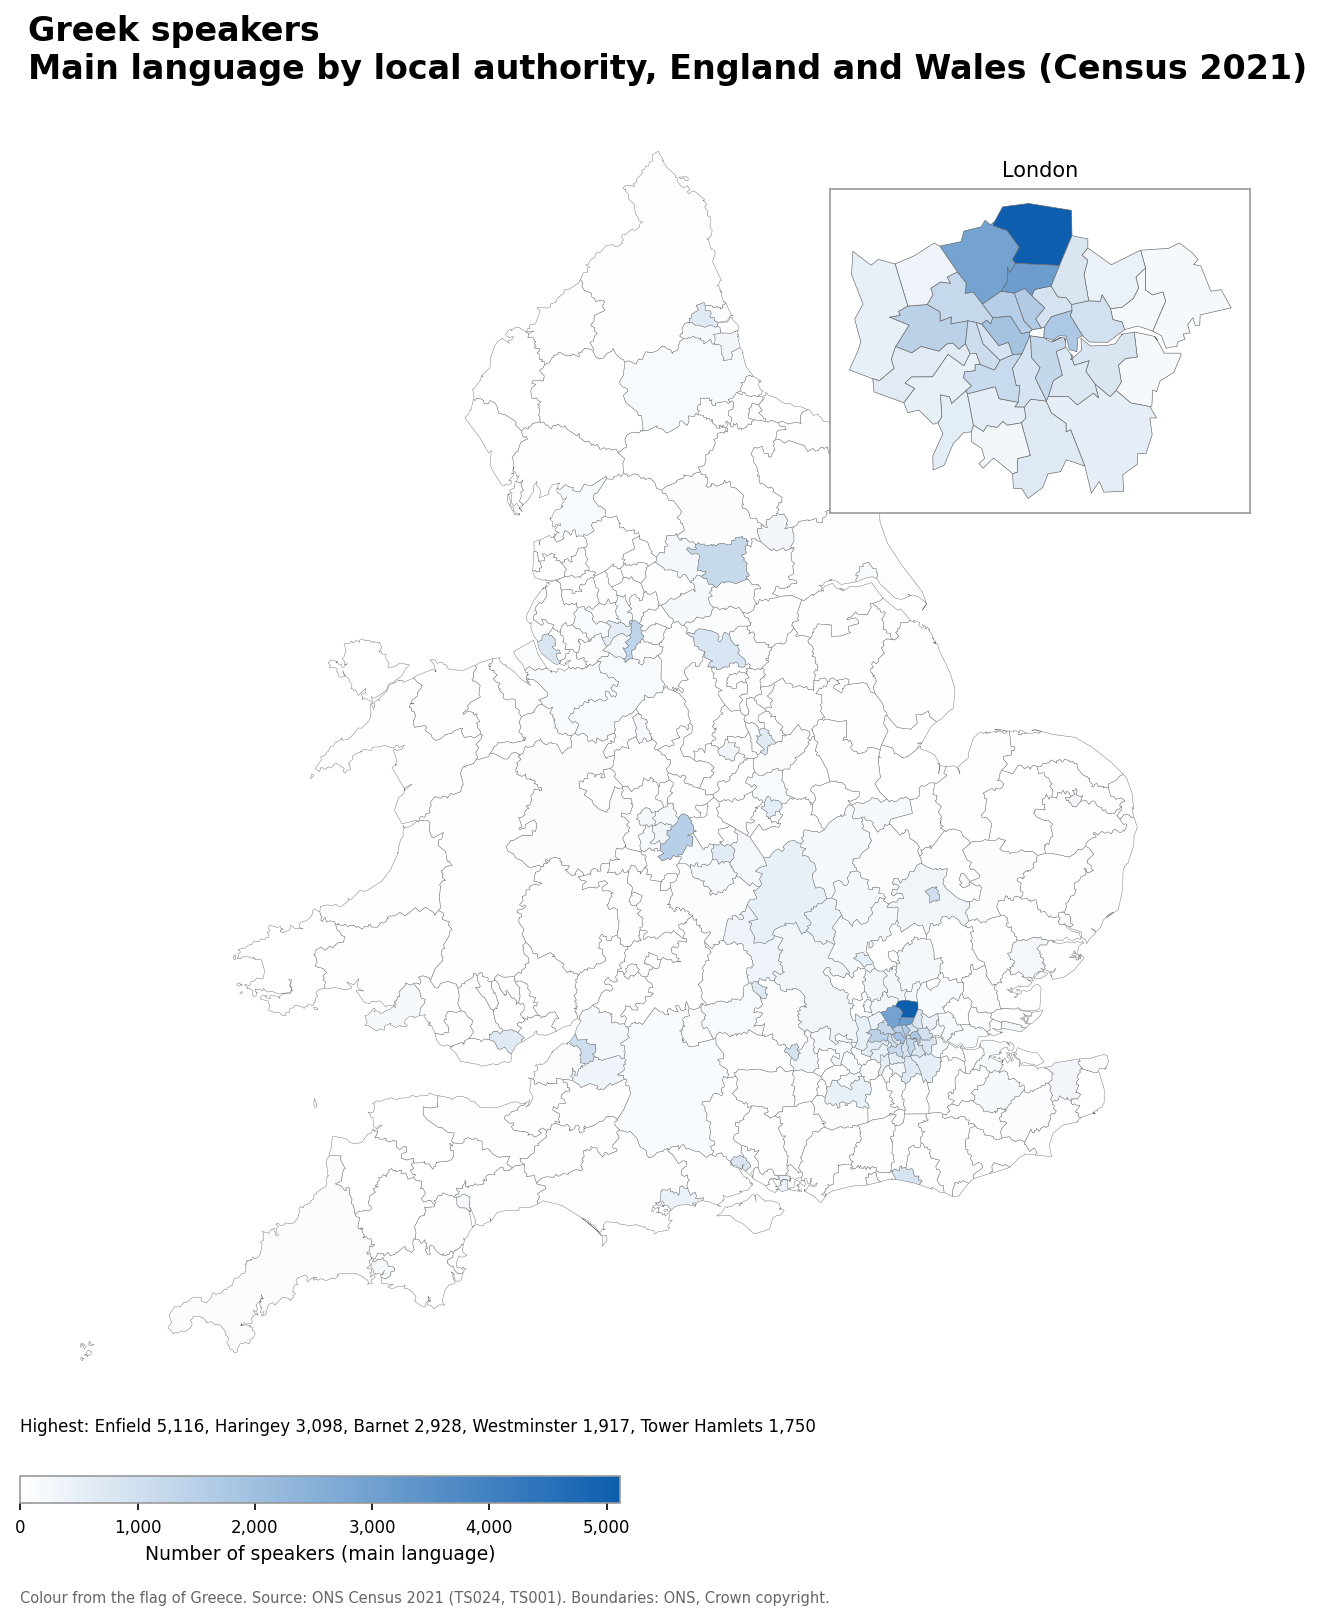
- Enfield: 5,116
- Haringey: 3,098
- Barnet: 2,928
- Westminster: 1,917
- Tower Hamlets: 1,750
Greek speakers as a share of the population
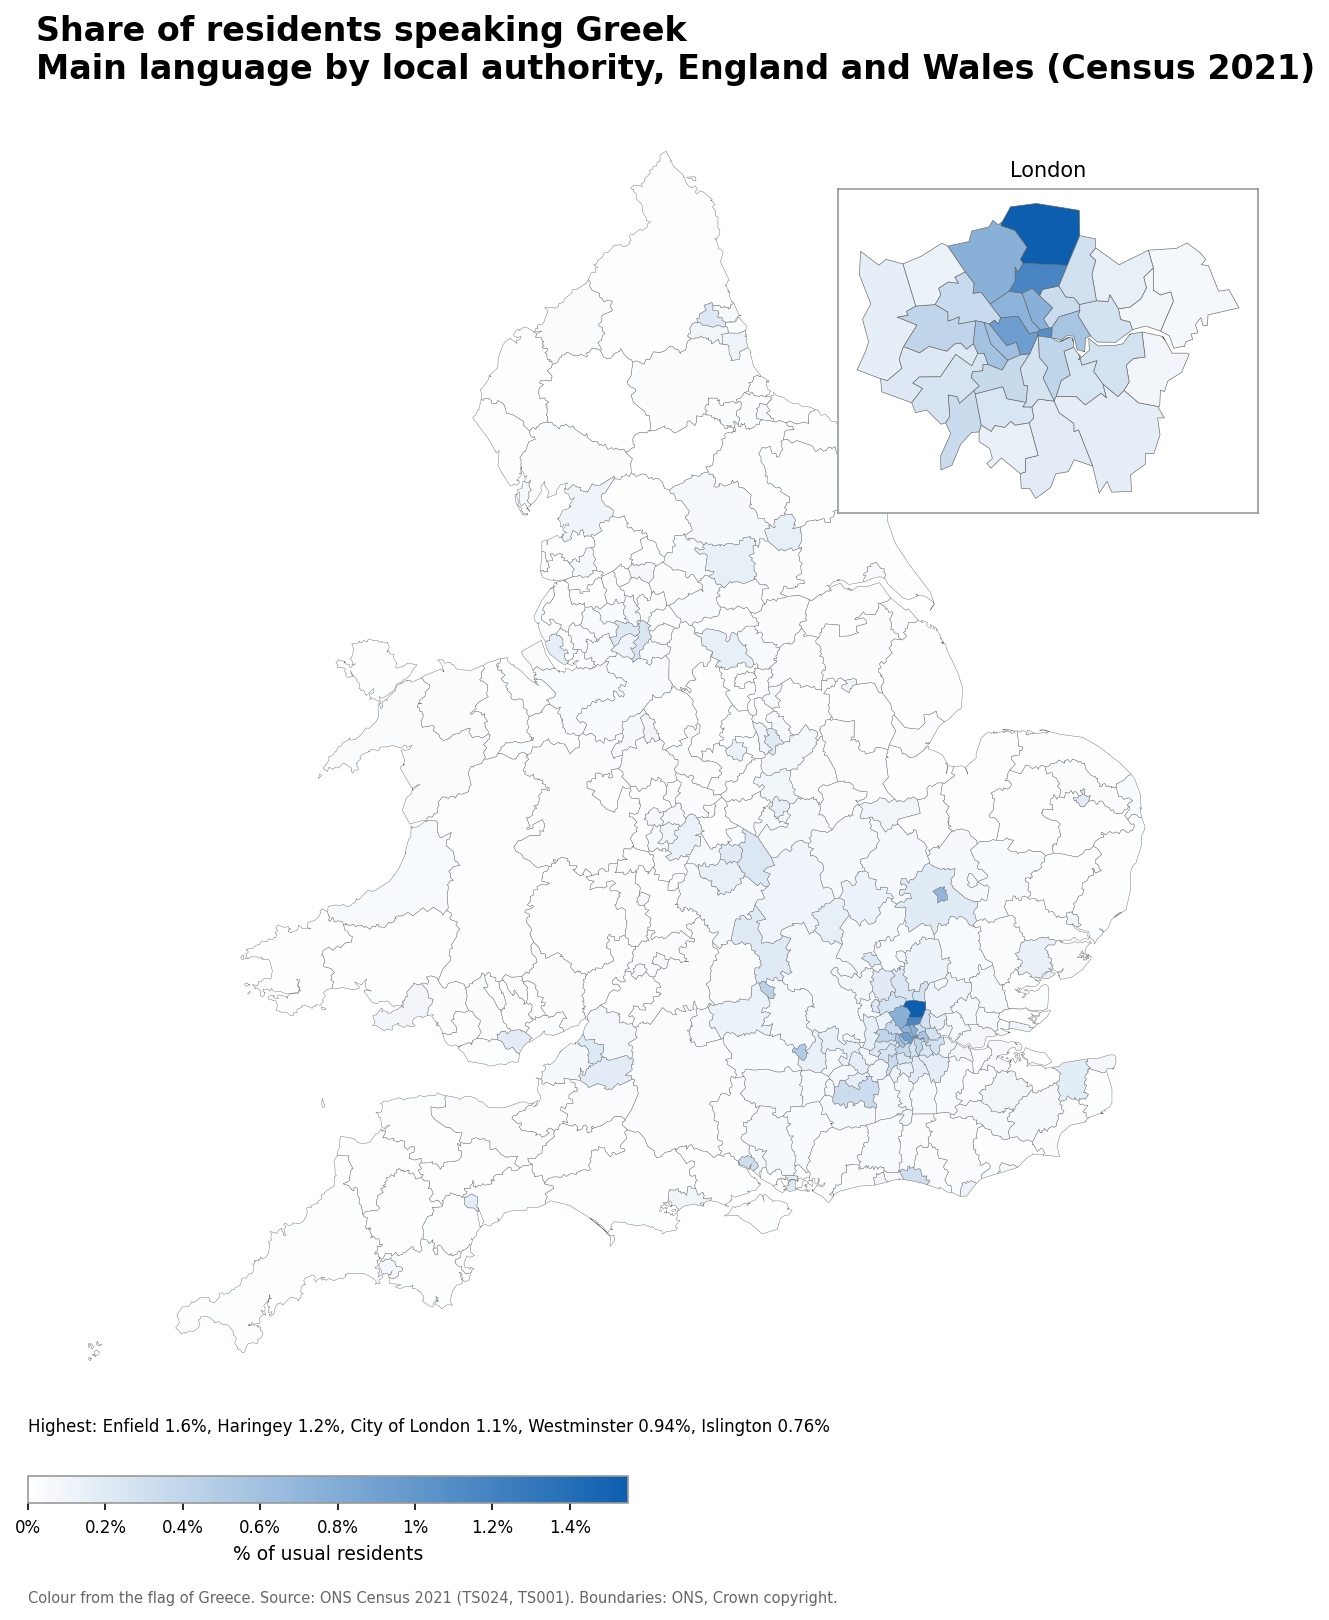
- Enfield: 1.6% (5,116 speakers)
- Haringey: 1.2% (3,098 speakers)
- City of London: 1.1% (93 speakers)
- Westminster: 0.94% (1,917 speakers)
- Islington: 0.76% (1,647 speakers)
Number of Maltese speakers
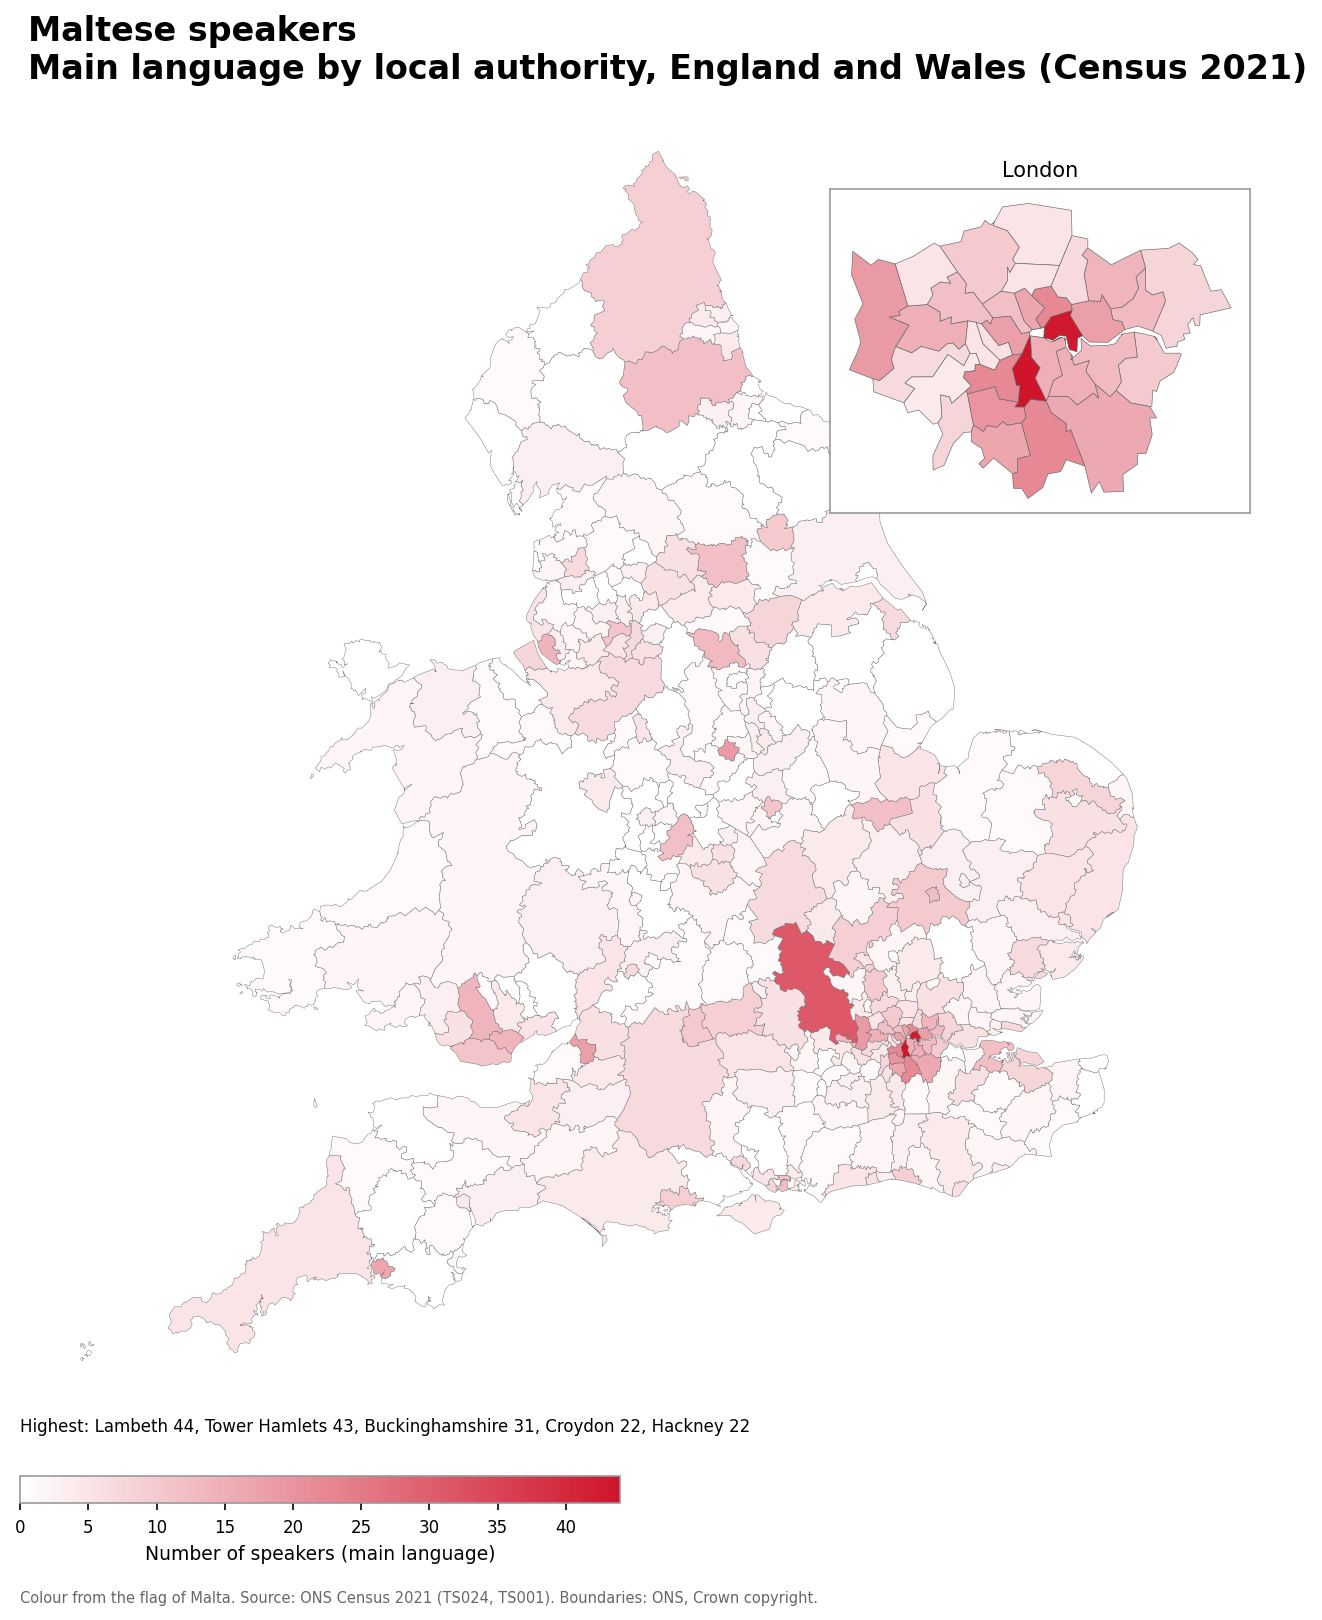
- Lambeth: 44
- Tower Hamlets: 43
- Buckinghamshire: 31
- Croydon: 22
- Wandsworth: 22
Maltese speakers as a share of the population
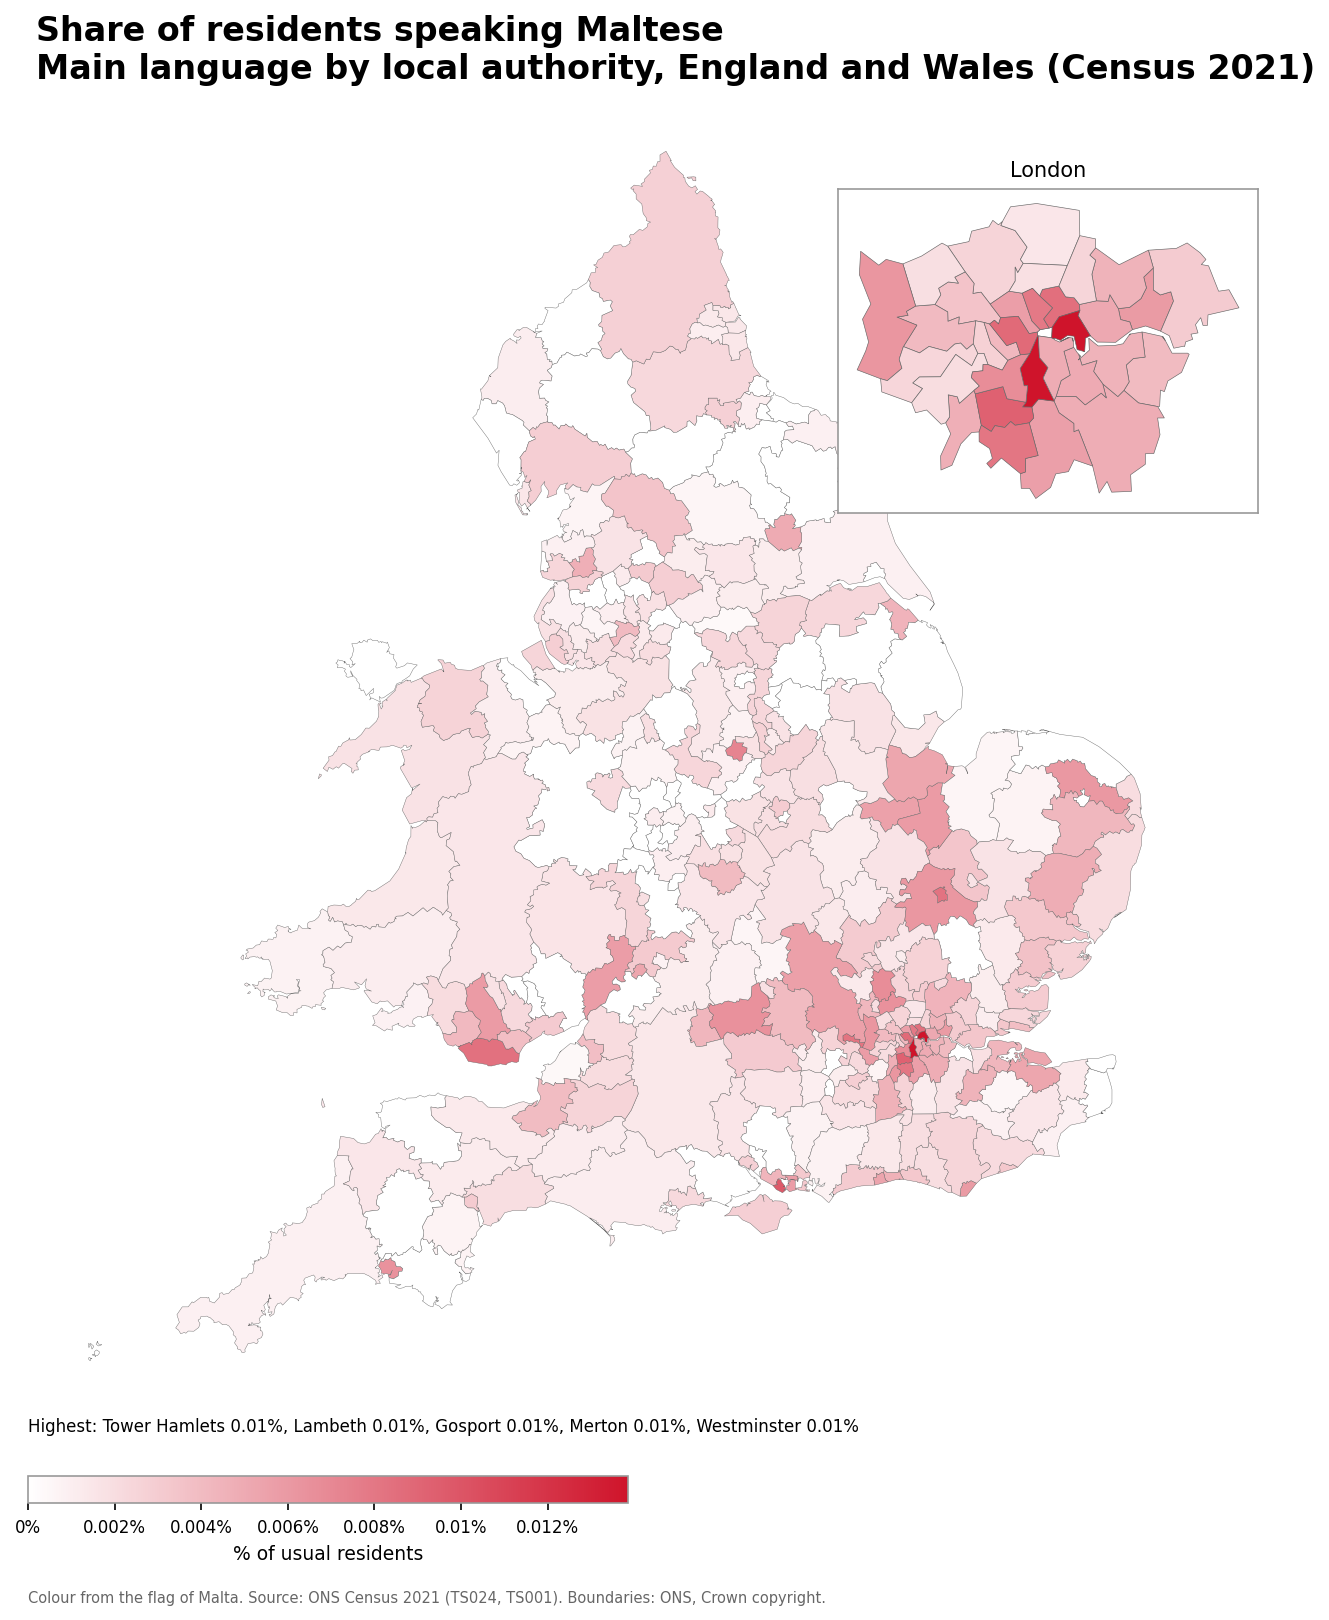
- Tower Hamlets: 0.01% (43 speakers)
- Lambeth: 0.01% (44 speakers)
- Gosport: 0.01% (8 speakers)
- Merton: 0.01% (20 speakers)
- Westminster: 0.01% (18 speakers)
Number of Swedish speakers
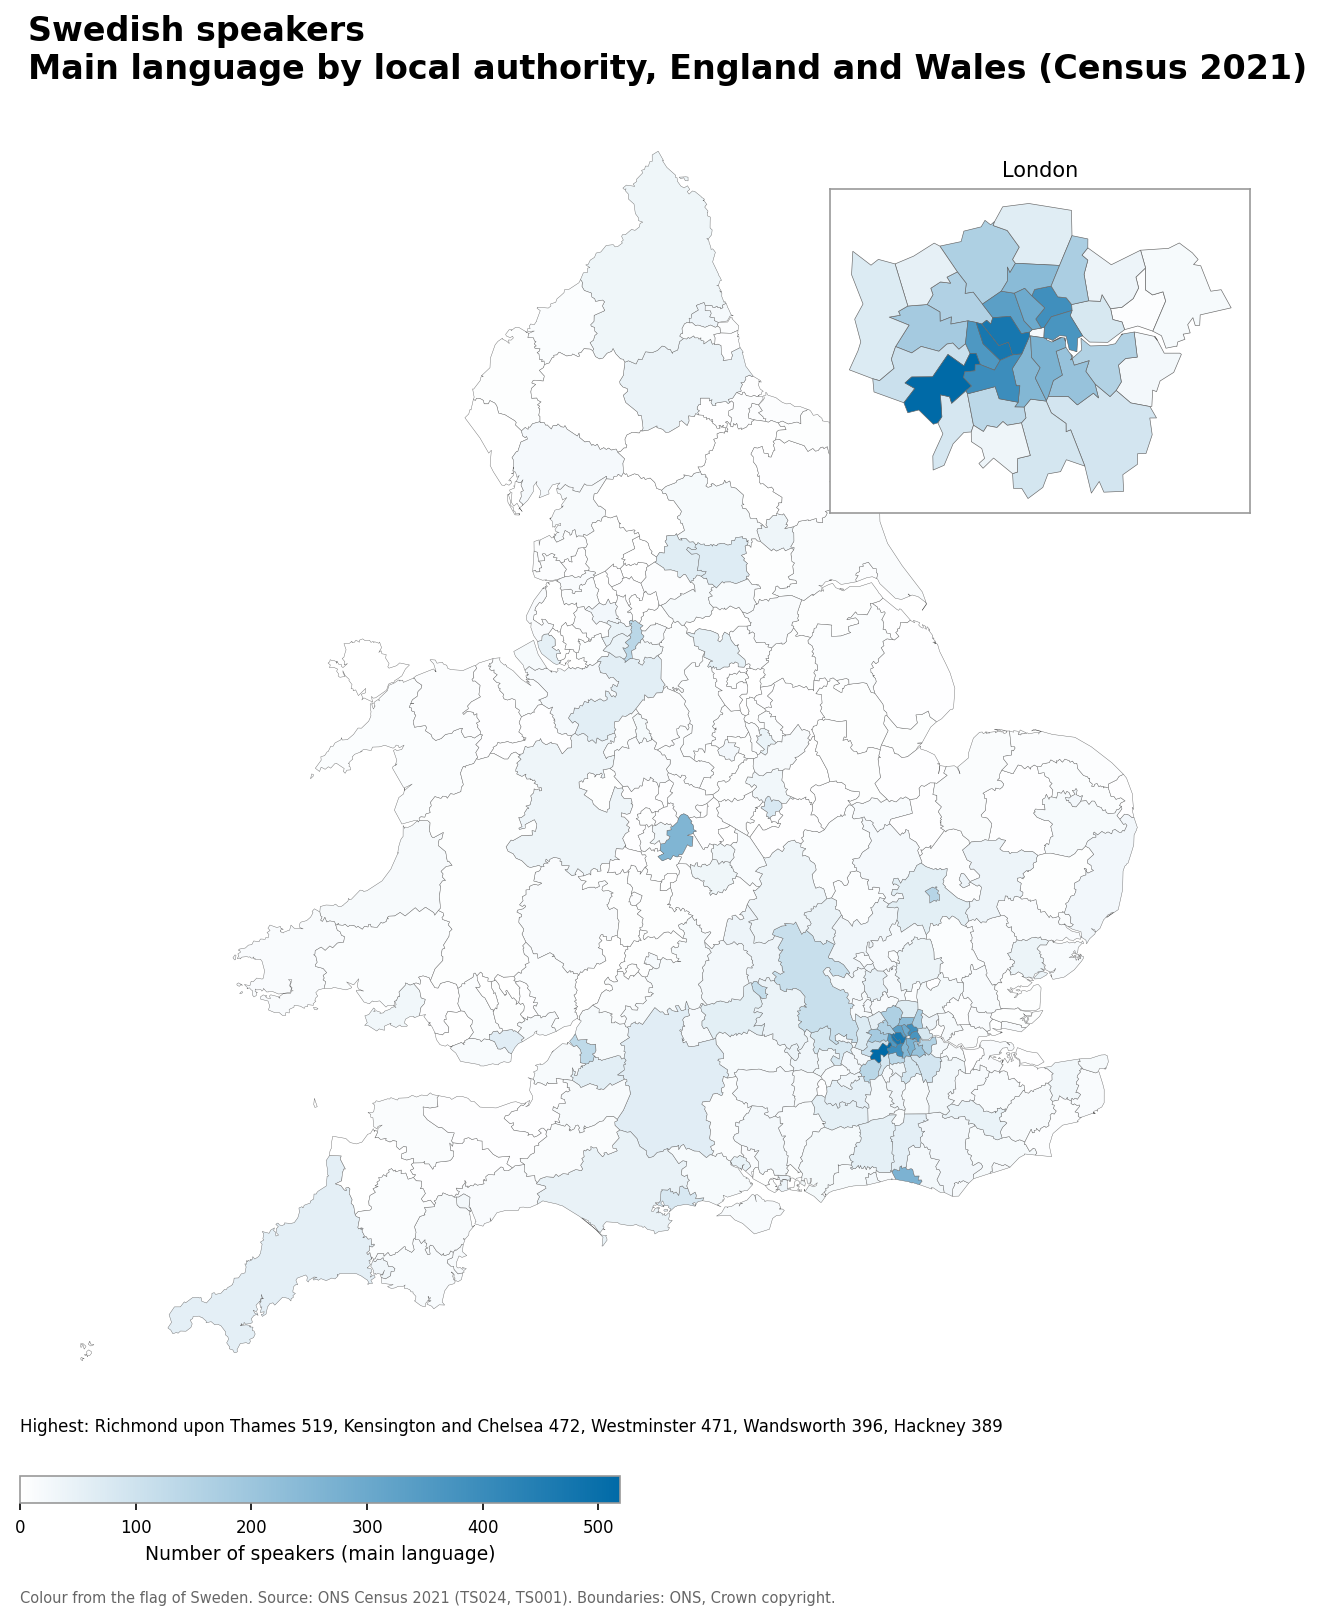
- Richmond upon Thames: 519
- Kensington and Chelsea: 472
- Westminster: 471
- Wandsworth: 396
- Hackney: 389
Swedish speakers as a share of the population
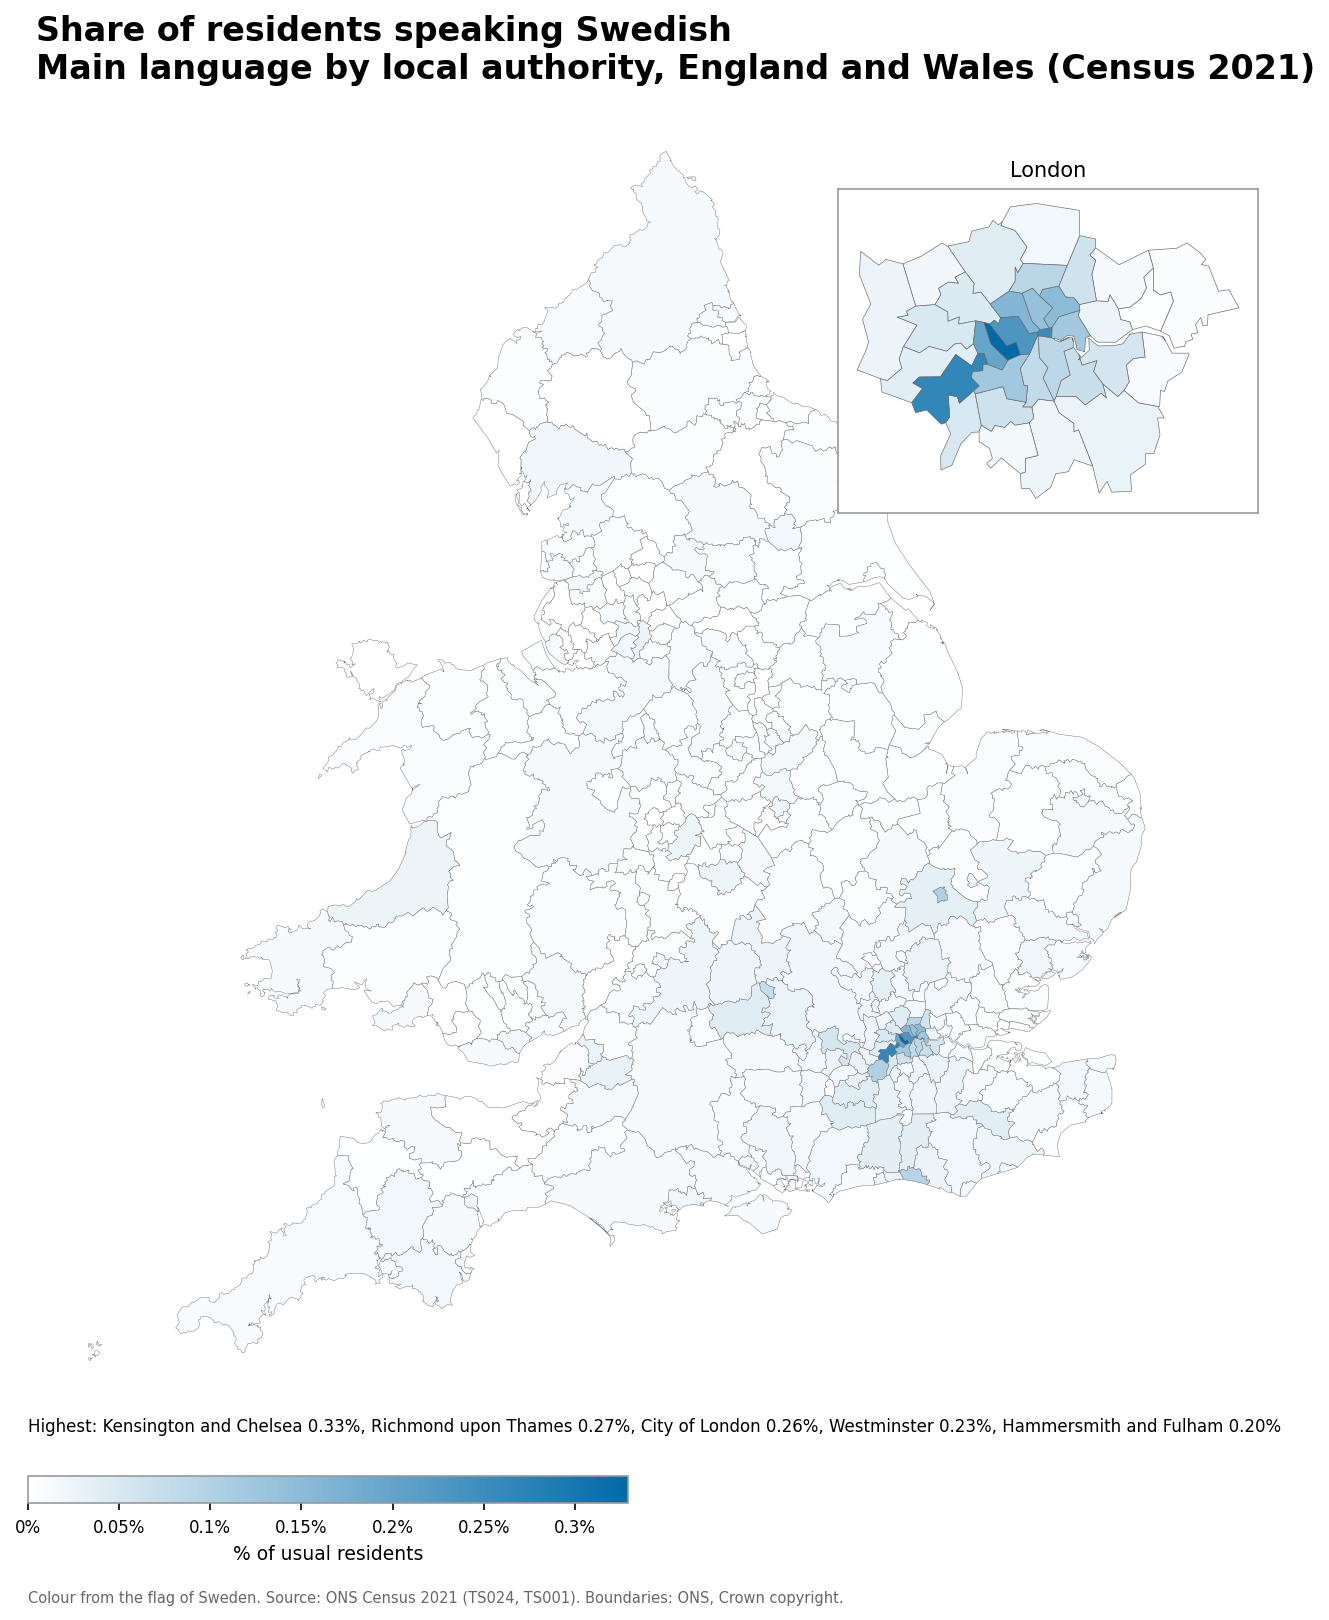
- Kensington and Chelsea: 0.33% (472 speakers)
- Richmond upon Thames: 0.27% (519 speakers)
- City of London: 0.26% (22 speakers)
- Westminster: 0.23% (471 speakers)
- Hammersmith and Fulham: 0.20% (360 speakers)
Number of Danish speakers
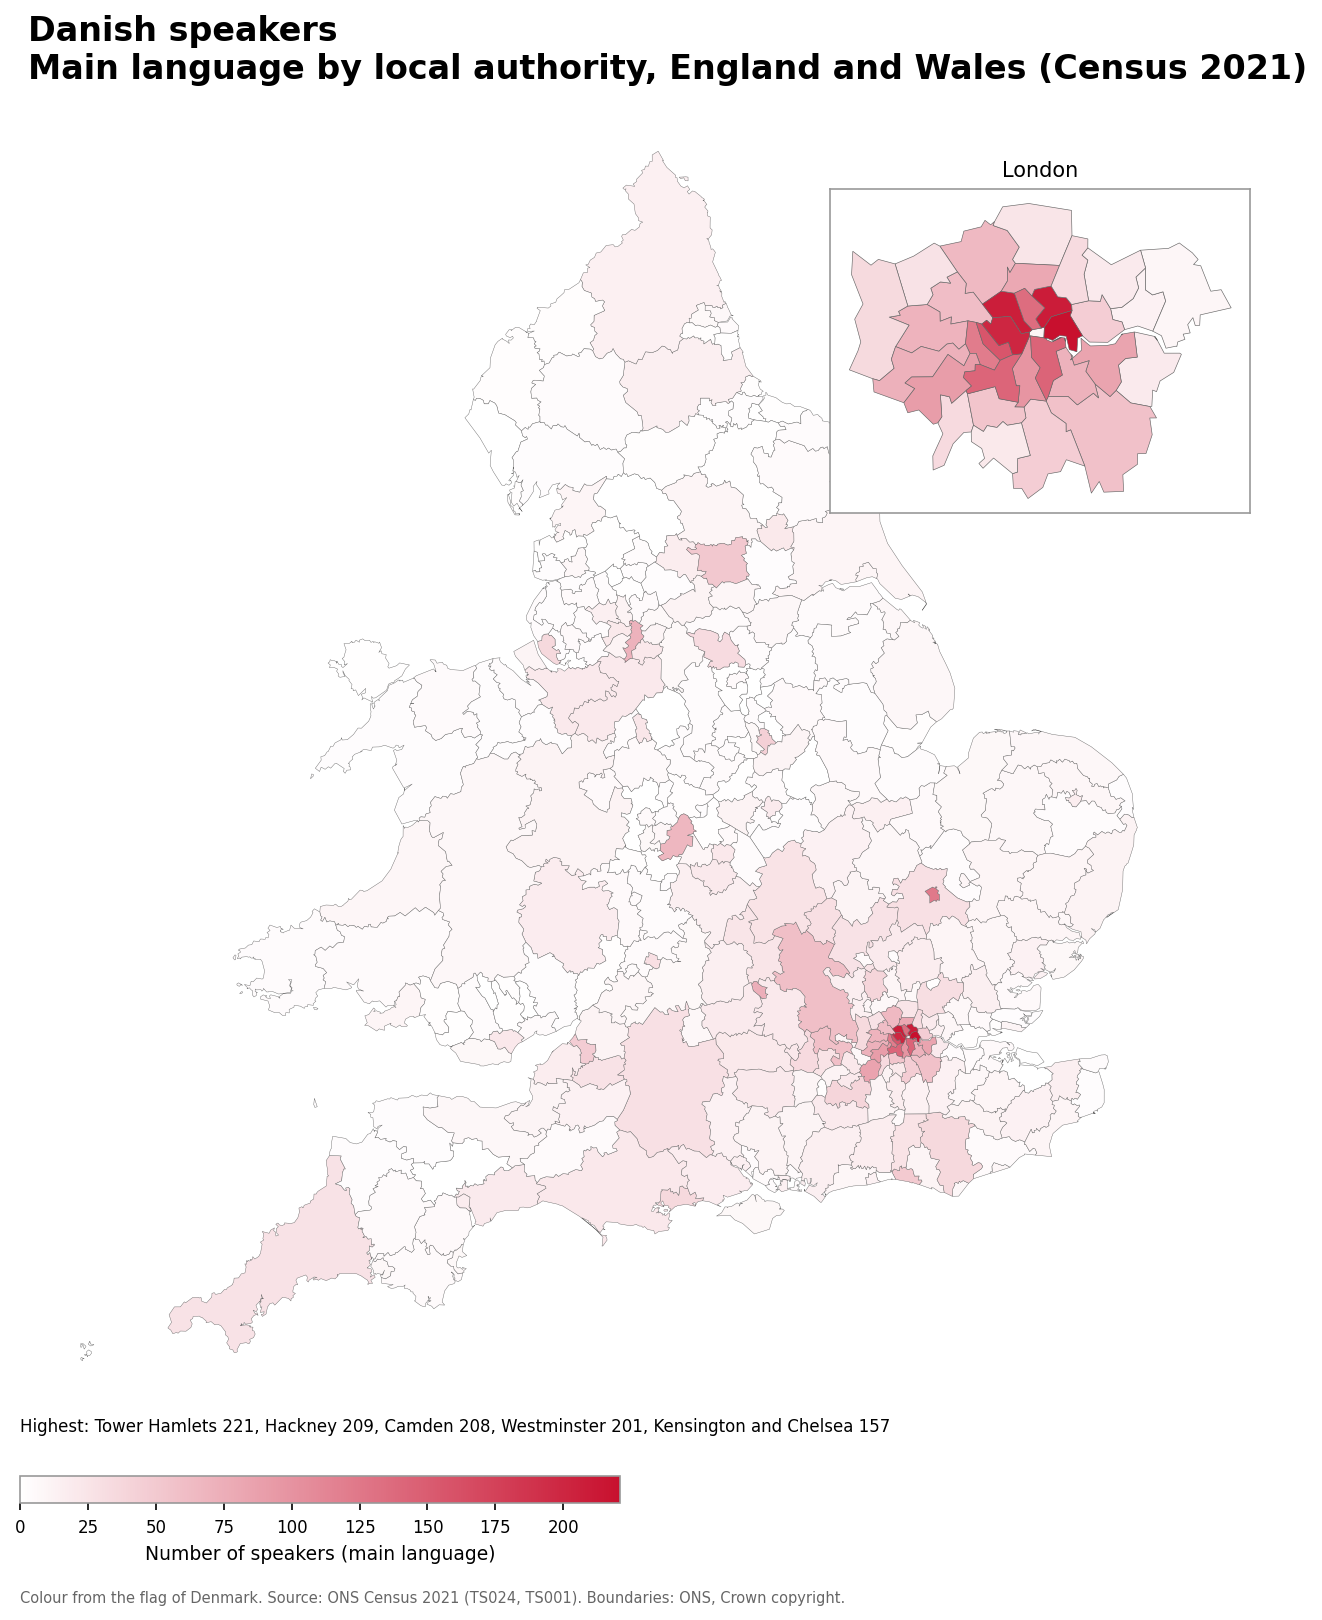
- Tower Hamlets: 221
- Hackney: 209
- Camden: 208
- Westminster: 201
- Kensington and Chelsea: 157
Danish speakers as a share of the population
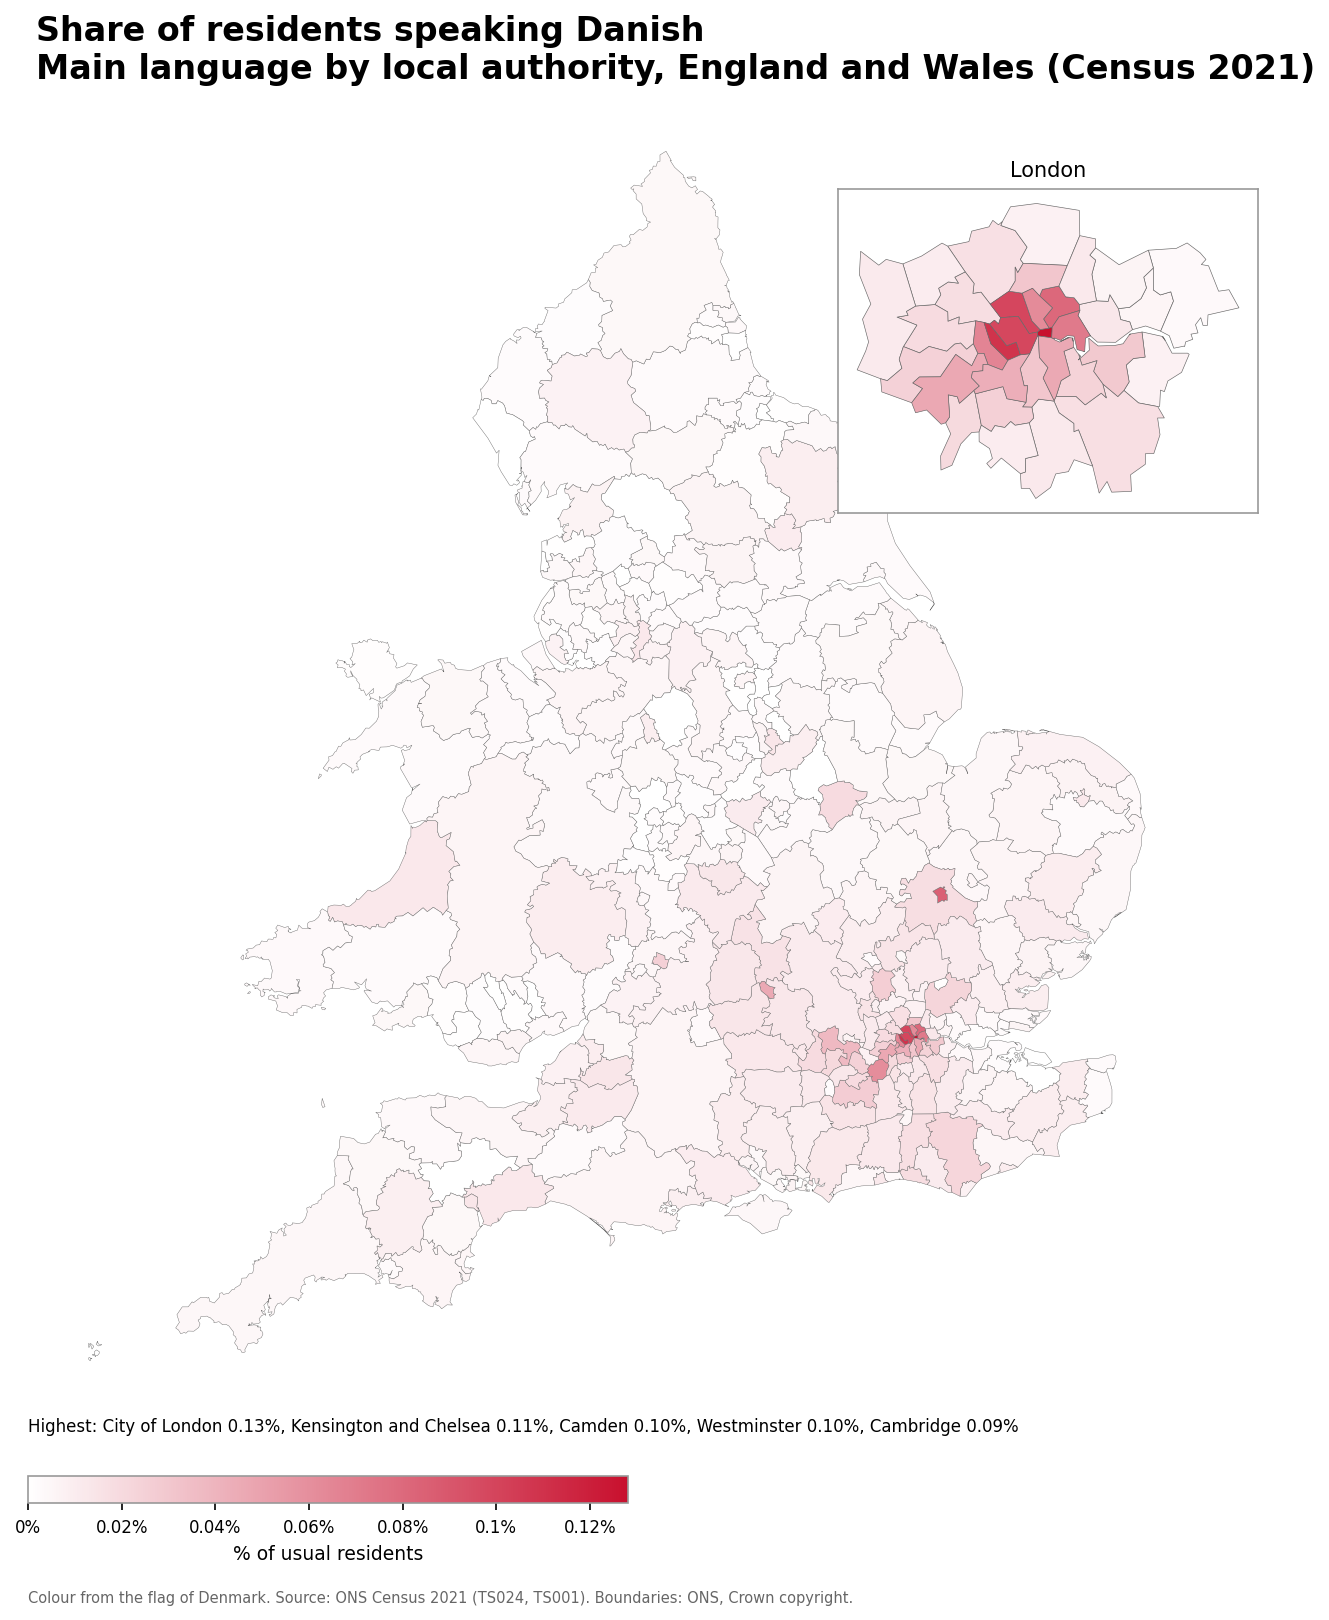
- City of London: 0.13% (11 speakers)
- Kensington and Chelsea: 0.11% (157 speakers)
- Camden: 0.10% (208 speakers)
- Westminster: 0.10% (201 speakers)
- Cambridge: 0.09% (124 speakers)
Number of Finnish speakers
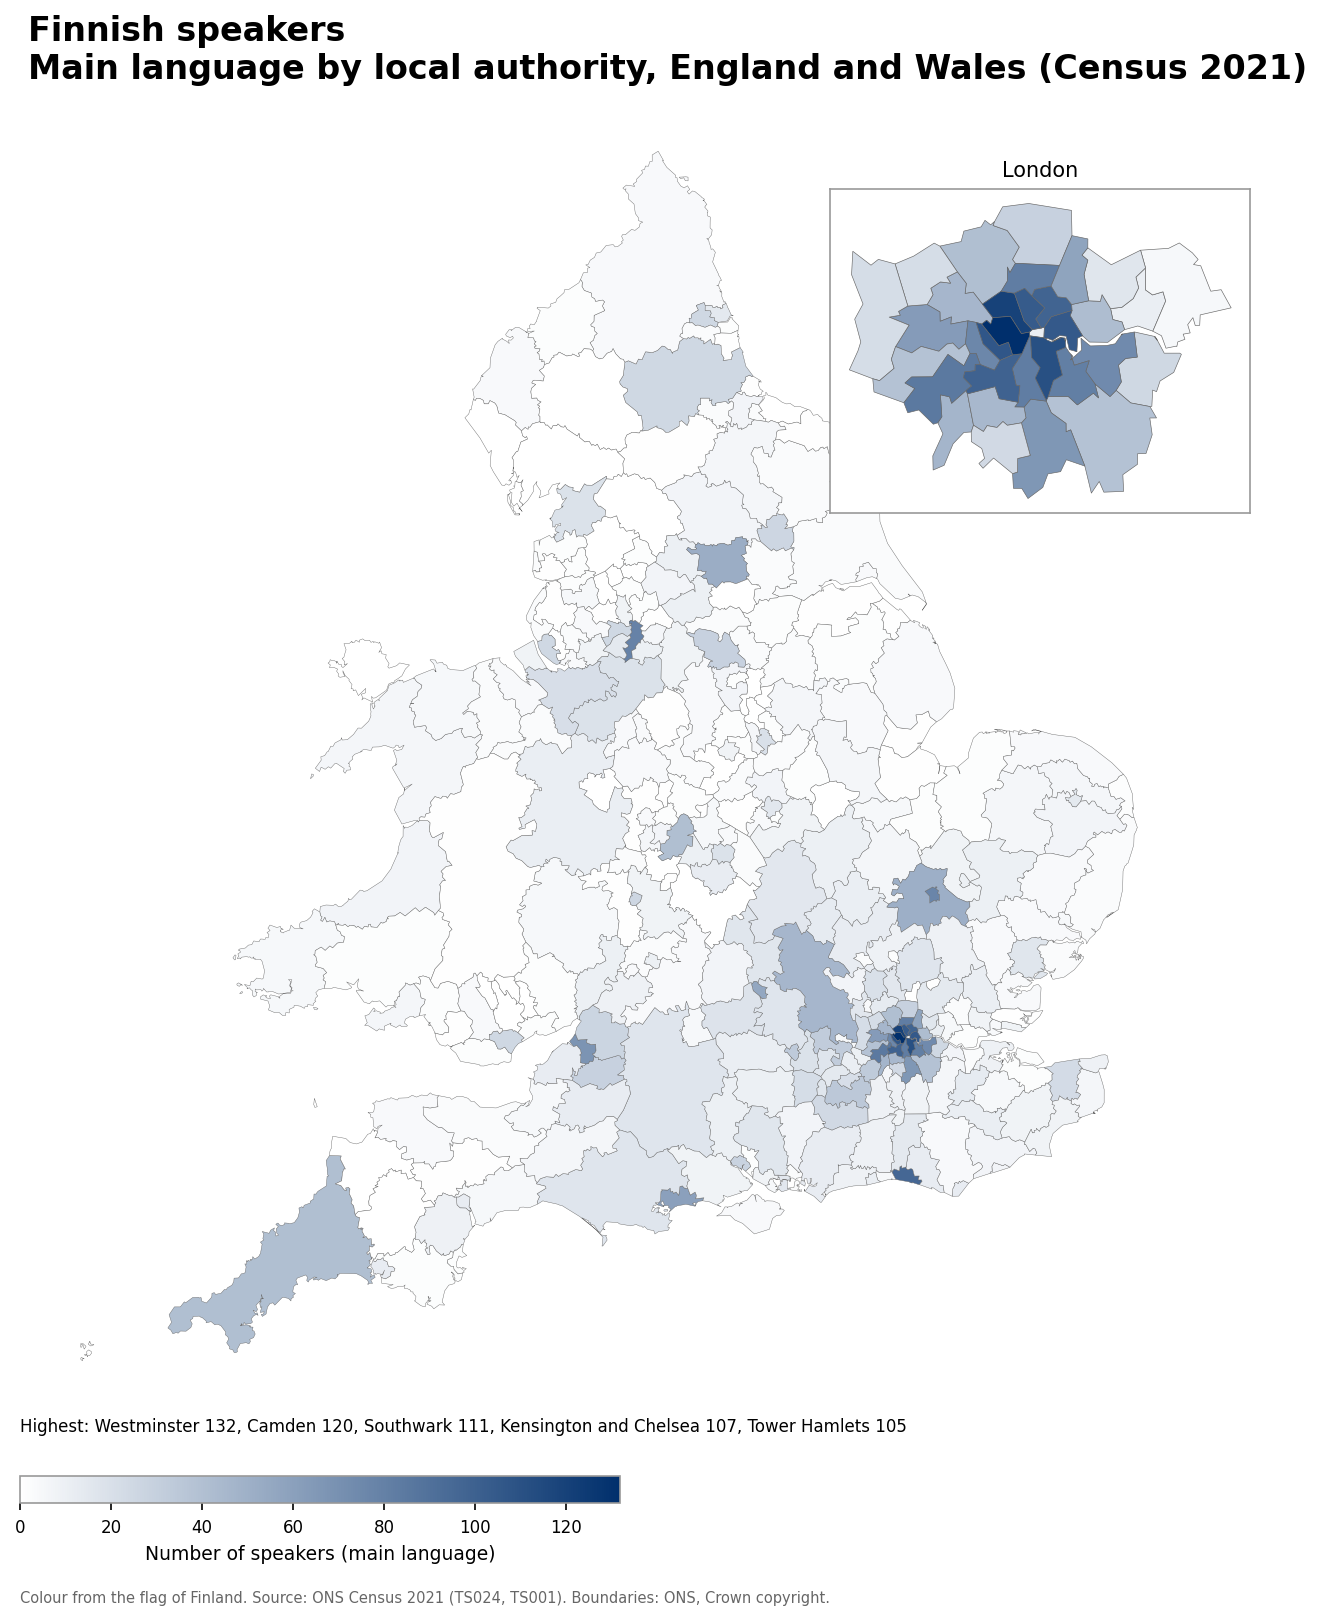
- Westminster: 132
- Camden: 120
- Southwark: 111
- Kensington and Chelsea: 107
- Tower Hamlets: 105
Finnish speakers as a share of the population
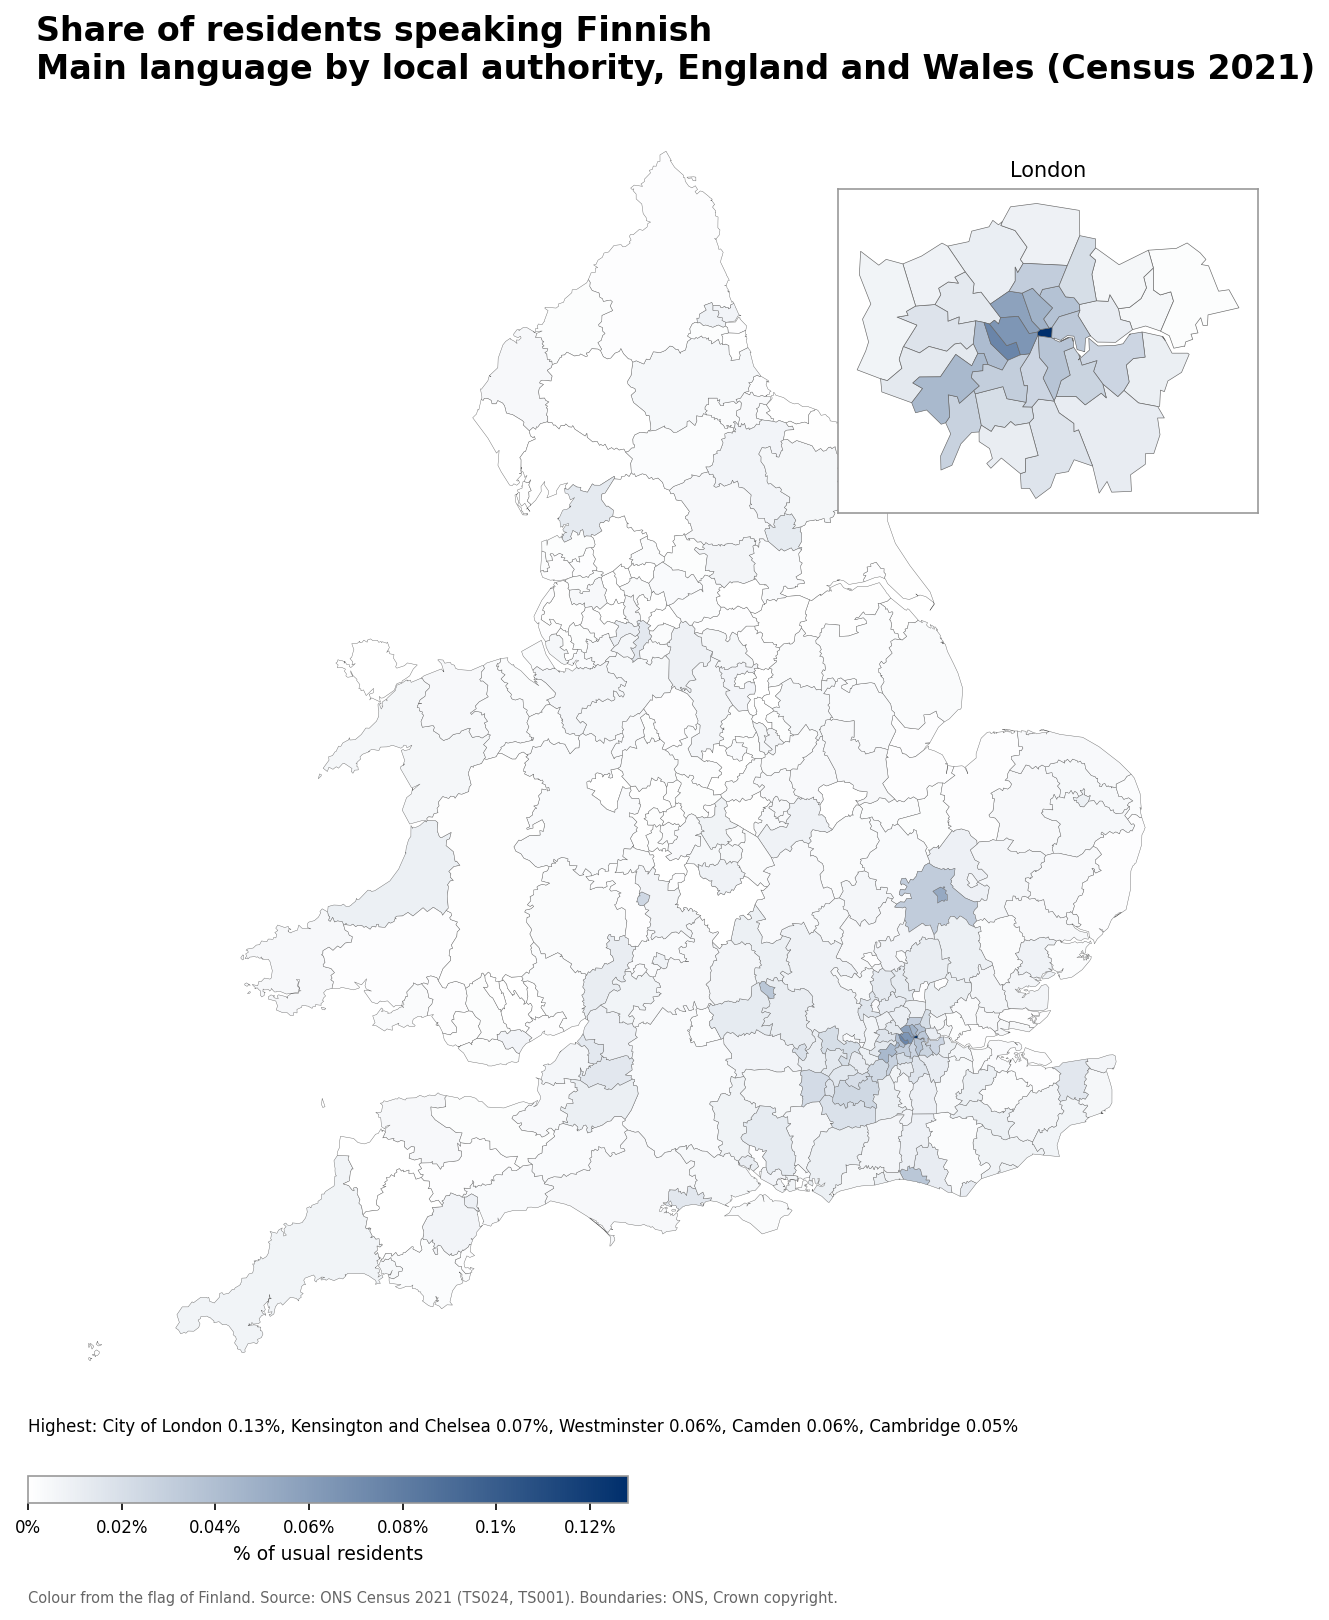
- City of London: 0.13% (11 speakers)
- Kensington and Chelsea: 0.07% (107 speakers)
- Westminster: 0.06% (132 speakers)
- Camden: 0.06% (120 speakers)
- Cambridge: 0.05% (77 speakers)
Number of Estonian speakers
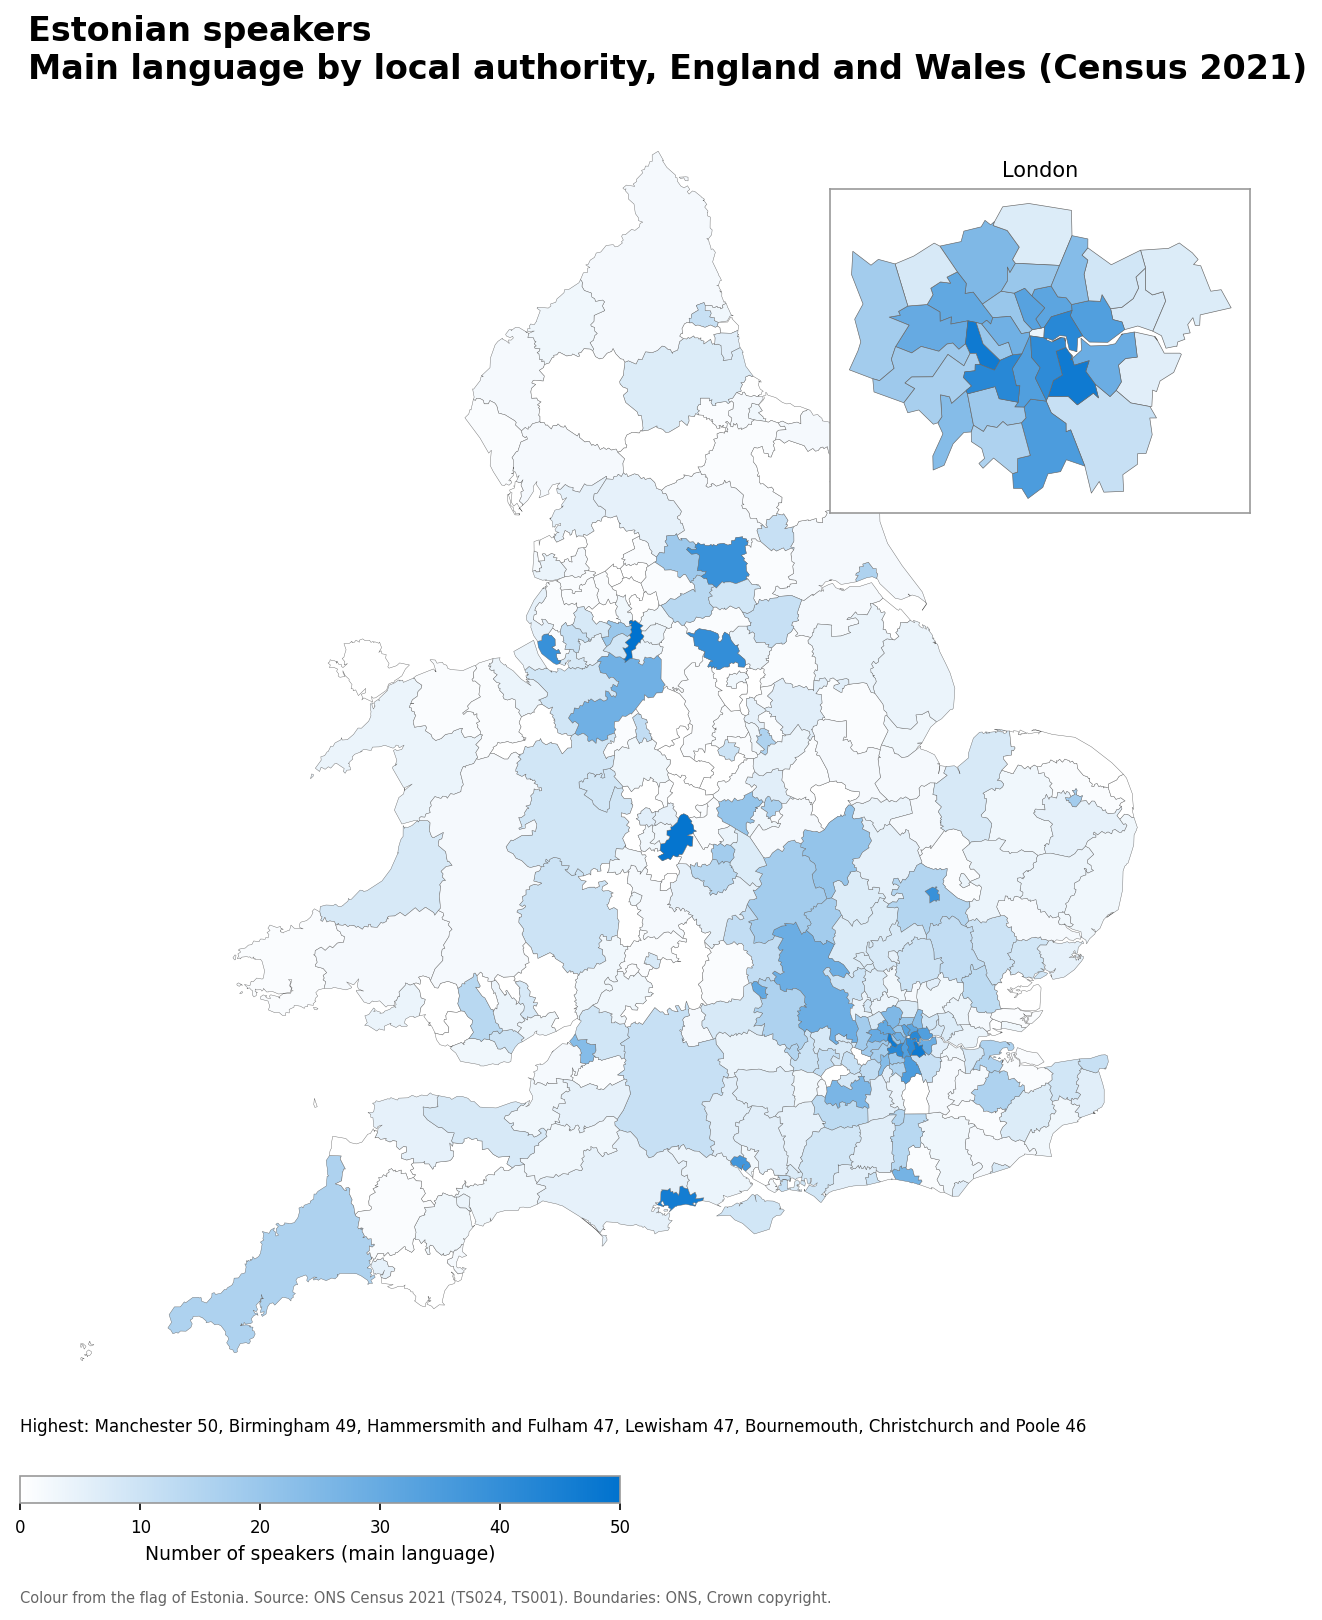
- Manchester: 50
- Birmingham: 49
- Lewisham: 47
- Hammersmith and Fulham: 47
- Bournemouth, Christchurch and Poole: 46
Estonian speakers as a share of the population
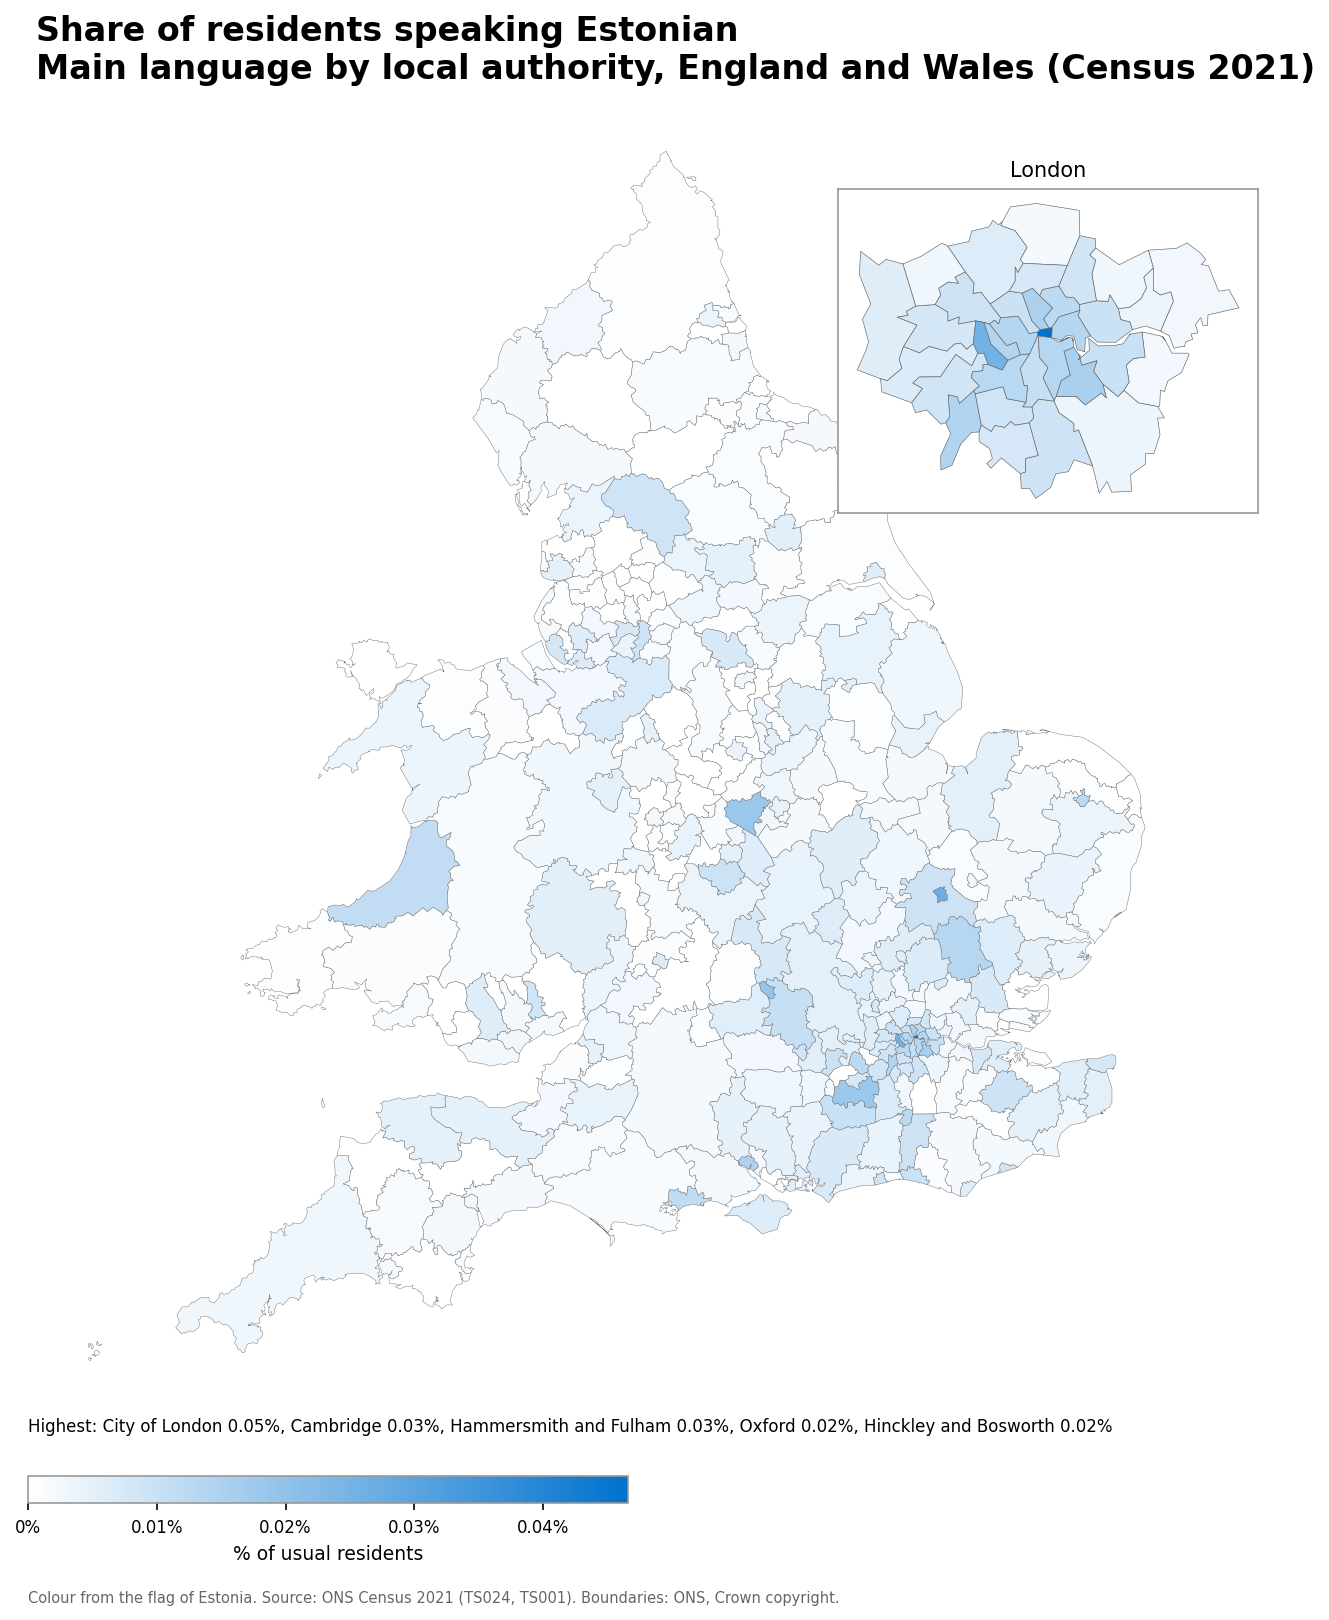
- City of London: 0.05% (4 speakers)
- Cambridge: 0.03% (39 speakers)
- Hammersmith and Fulham: 0.03% (47 speakers)
- Oxford: 0.02% (31 speakers)
- Hinckley and Bosworth: 0.02% (21 speakers)
Number of Latvian speakers
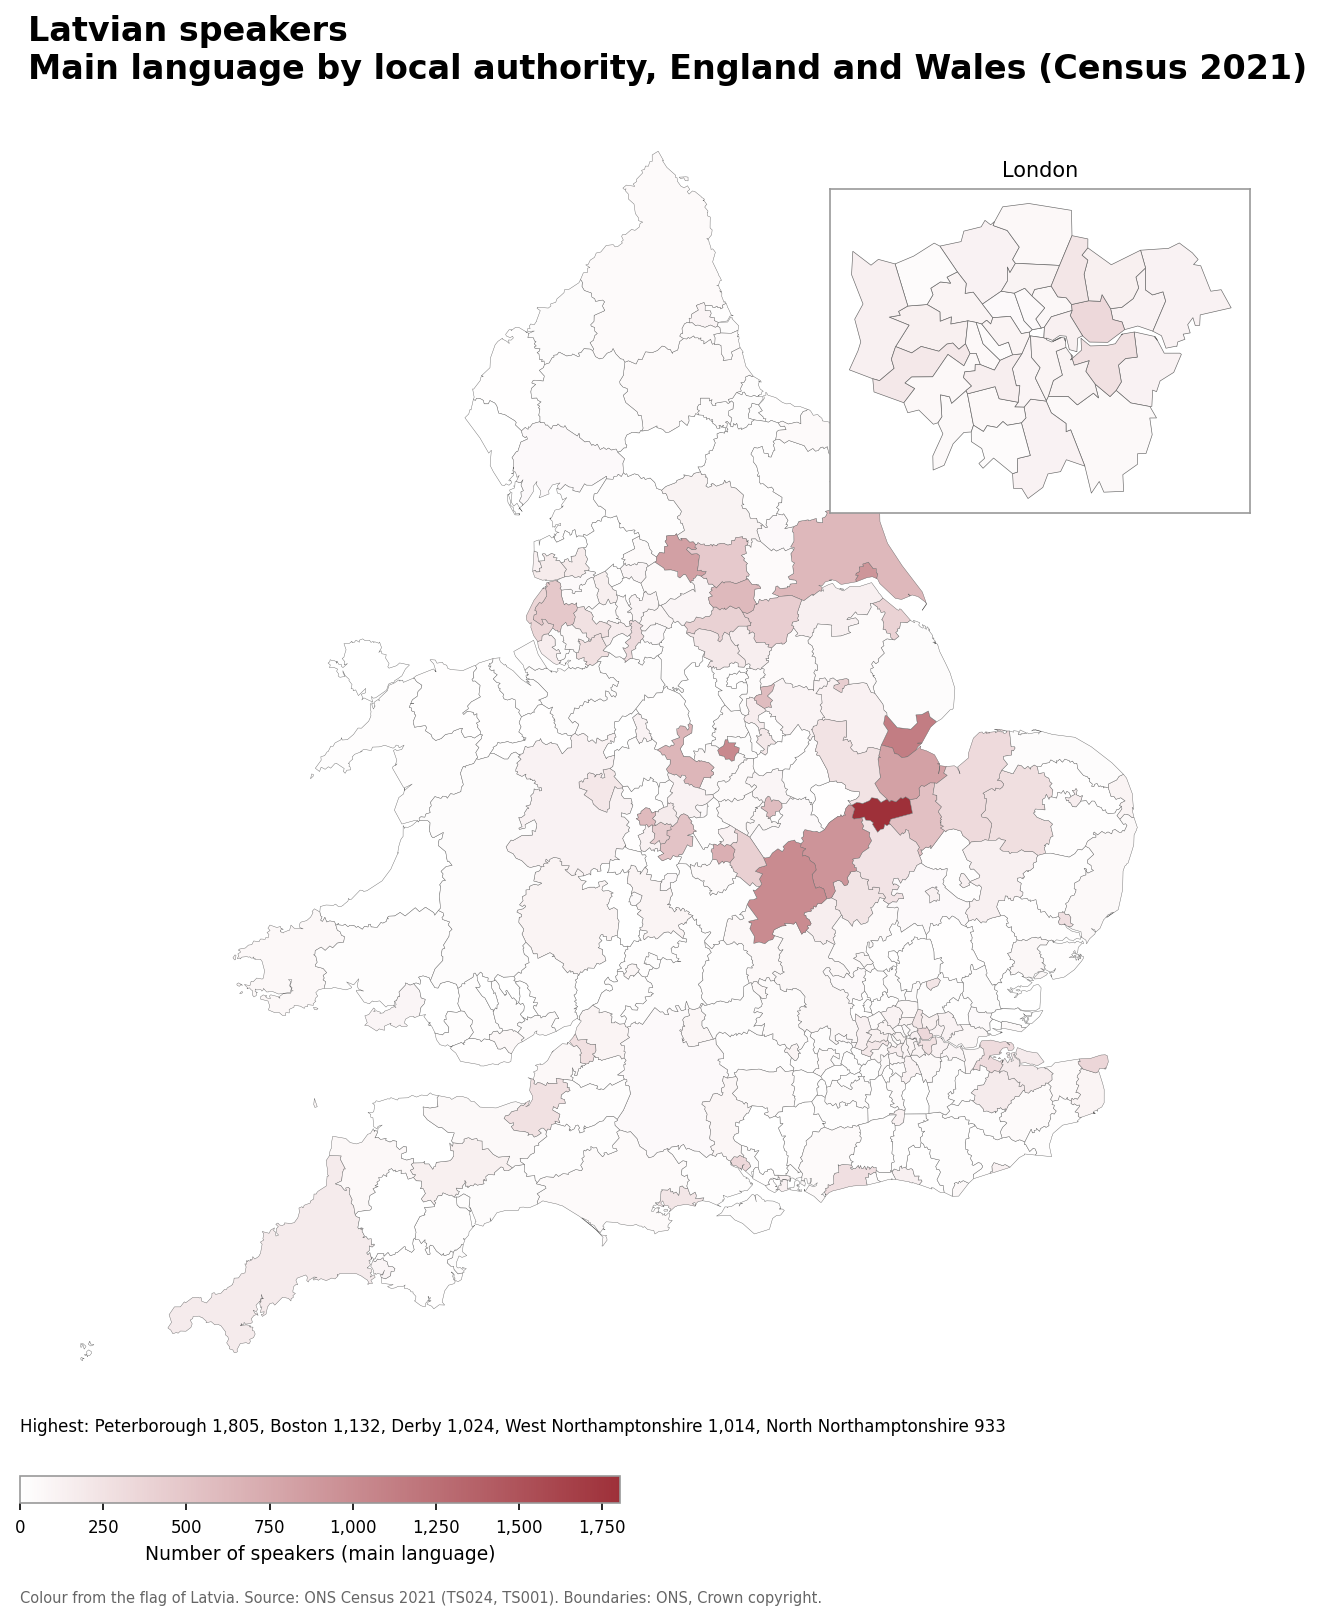
- Peterborough: 1,805
- Boston: 1,132
- Derby: 1,024
- West Northamptonshire: 1,014
- North Northamptonshire: 933
Latvian speakers as a share of the population
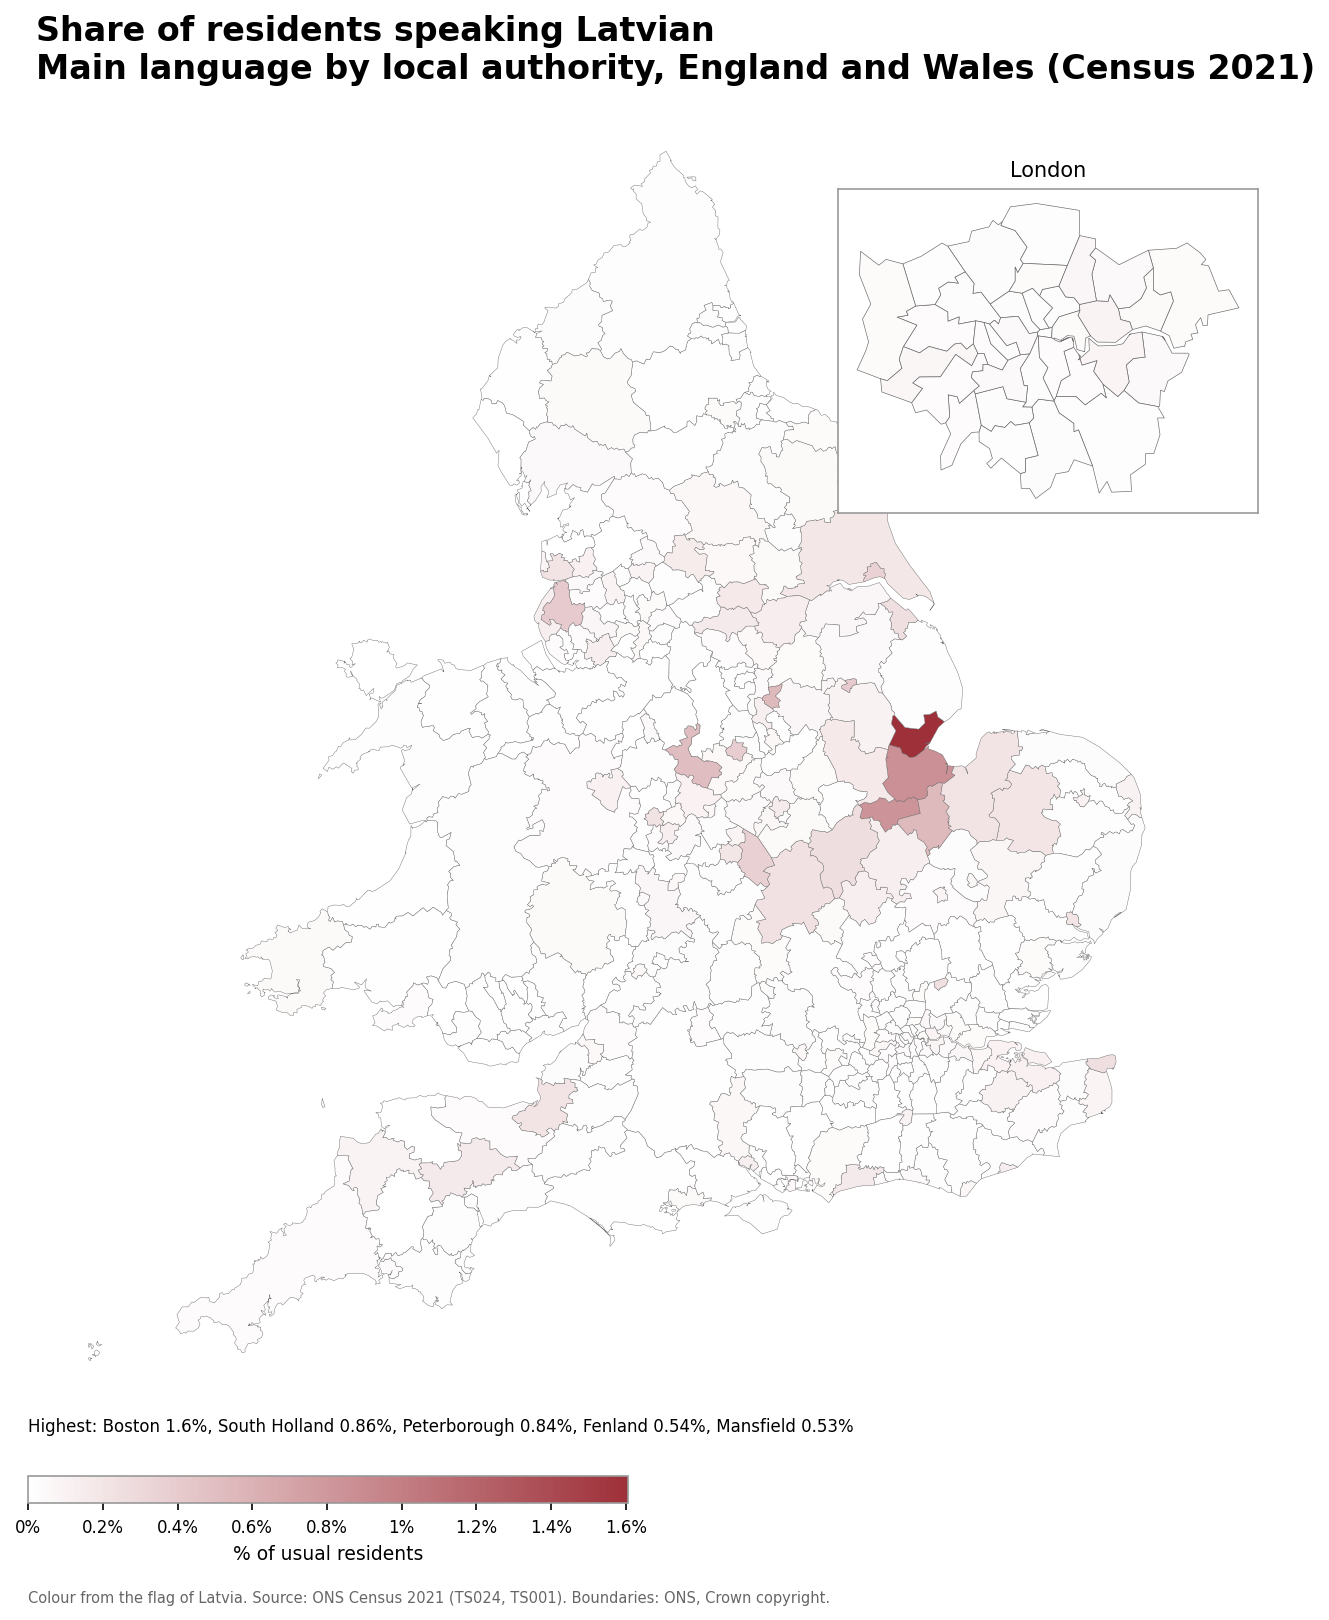
- Boston: 1.6% (1,132 speakers)
- South Holland: 0.86% (820 speakers)
- Peterborough: 0.84% (1,805 speakers)
- Fenland: 0.54% (549 speakers)
- Mansfield: 0.53% (590 speakers)
Number of Lithuanian speakers
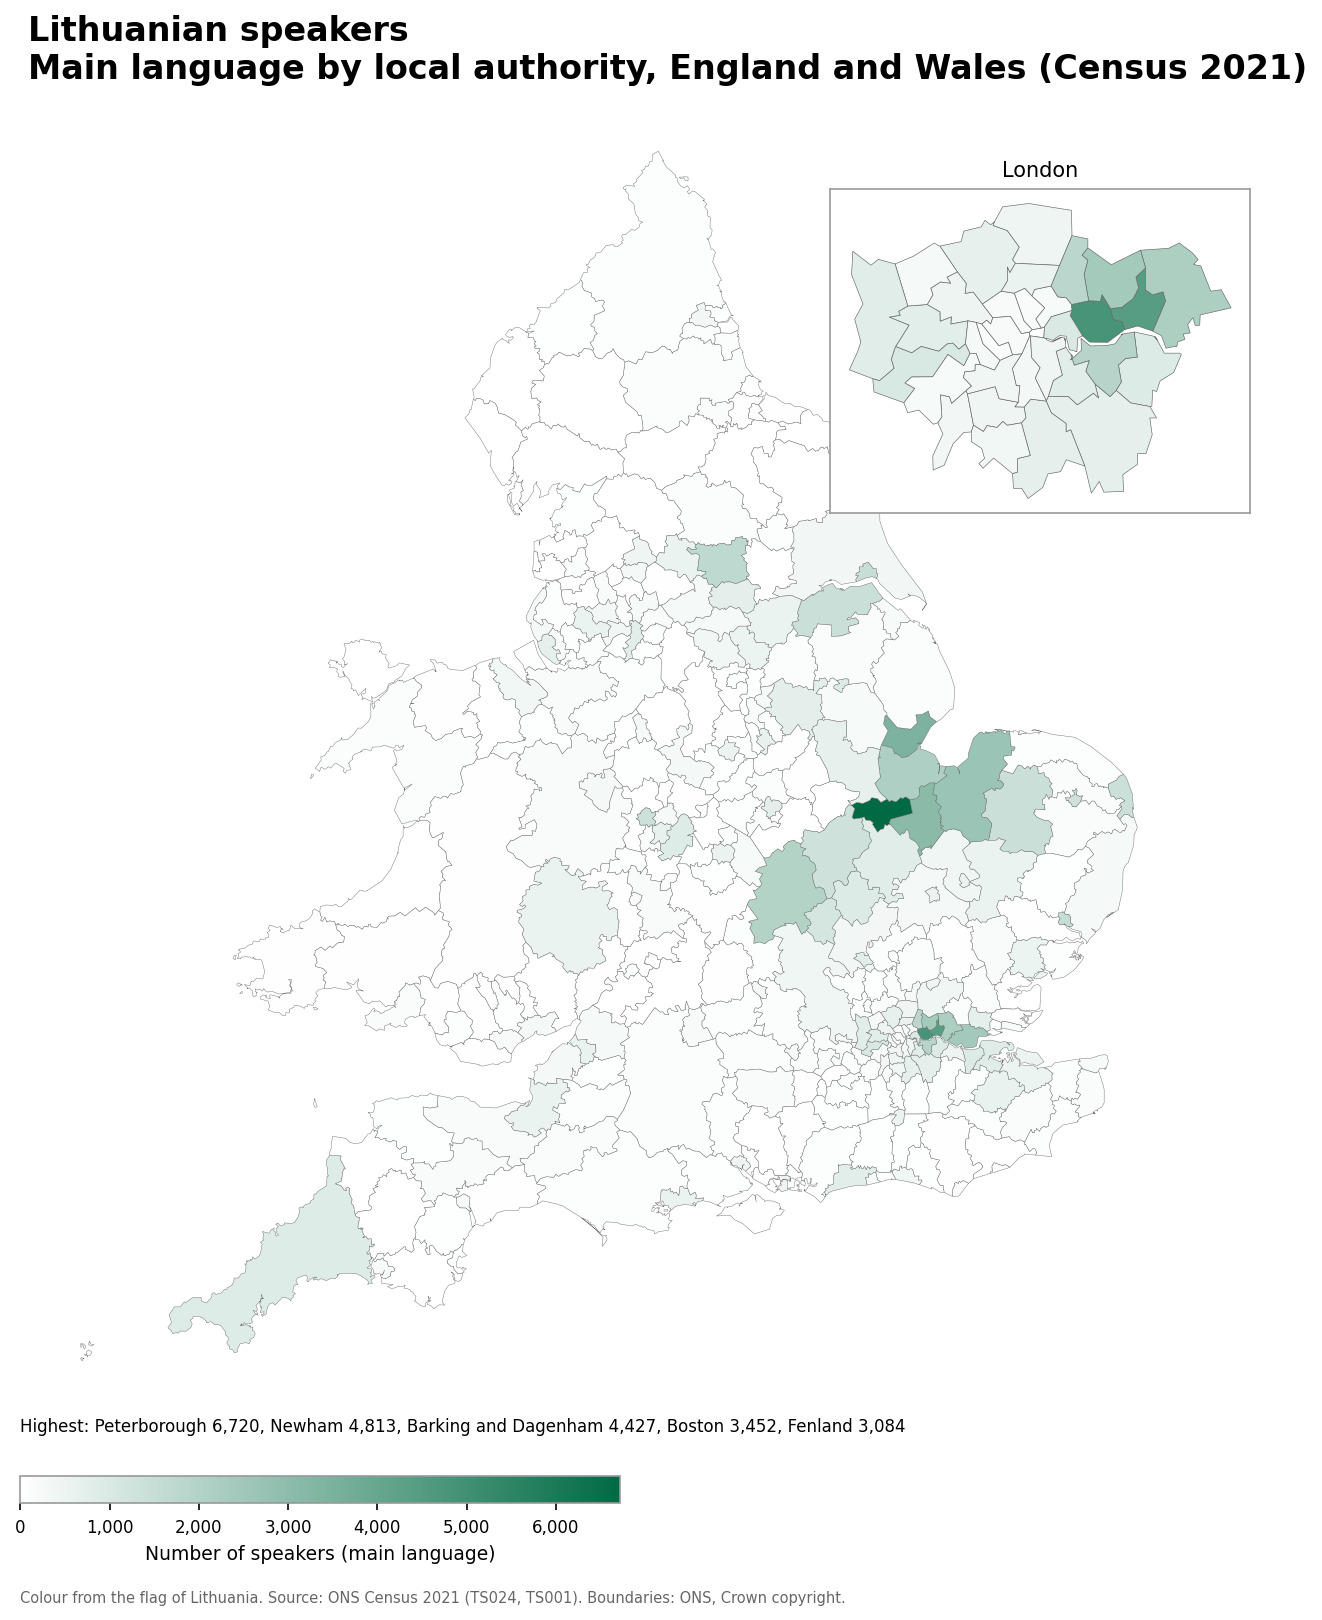
- Peterborough: 6,720
- Newham: 4,813
- Barking and Dagenham: 4,427
- Boston: 3,452
- Fenland: 3,084
Lithuanian speakers as a share of the population
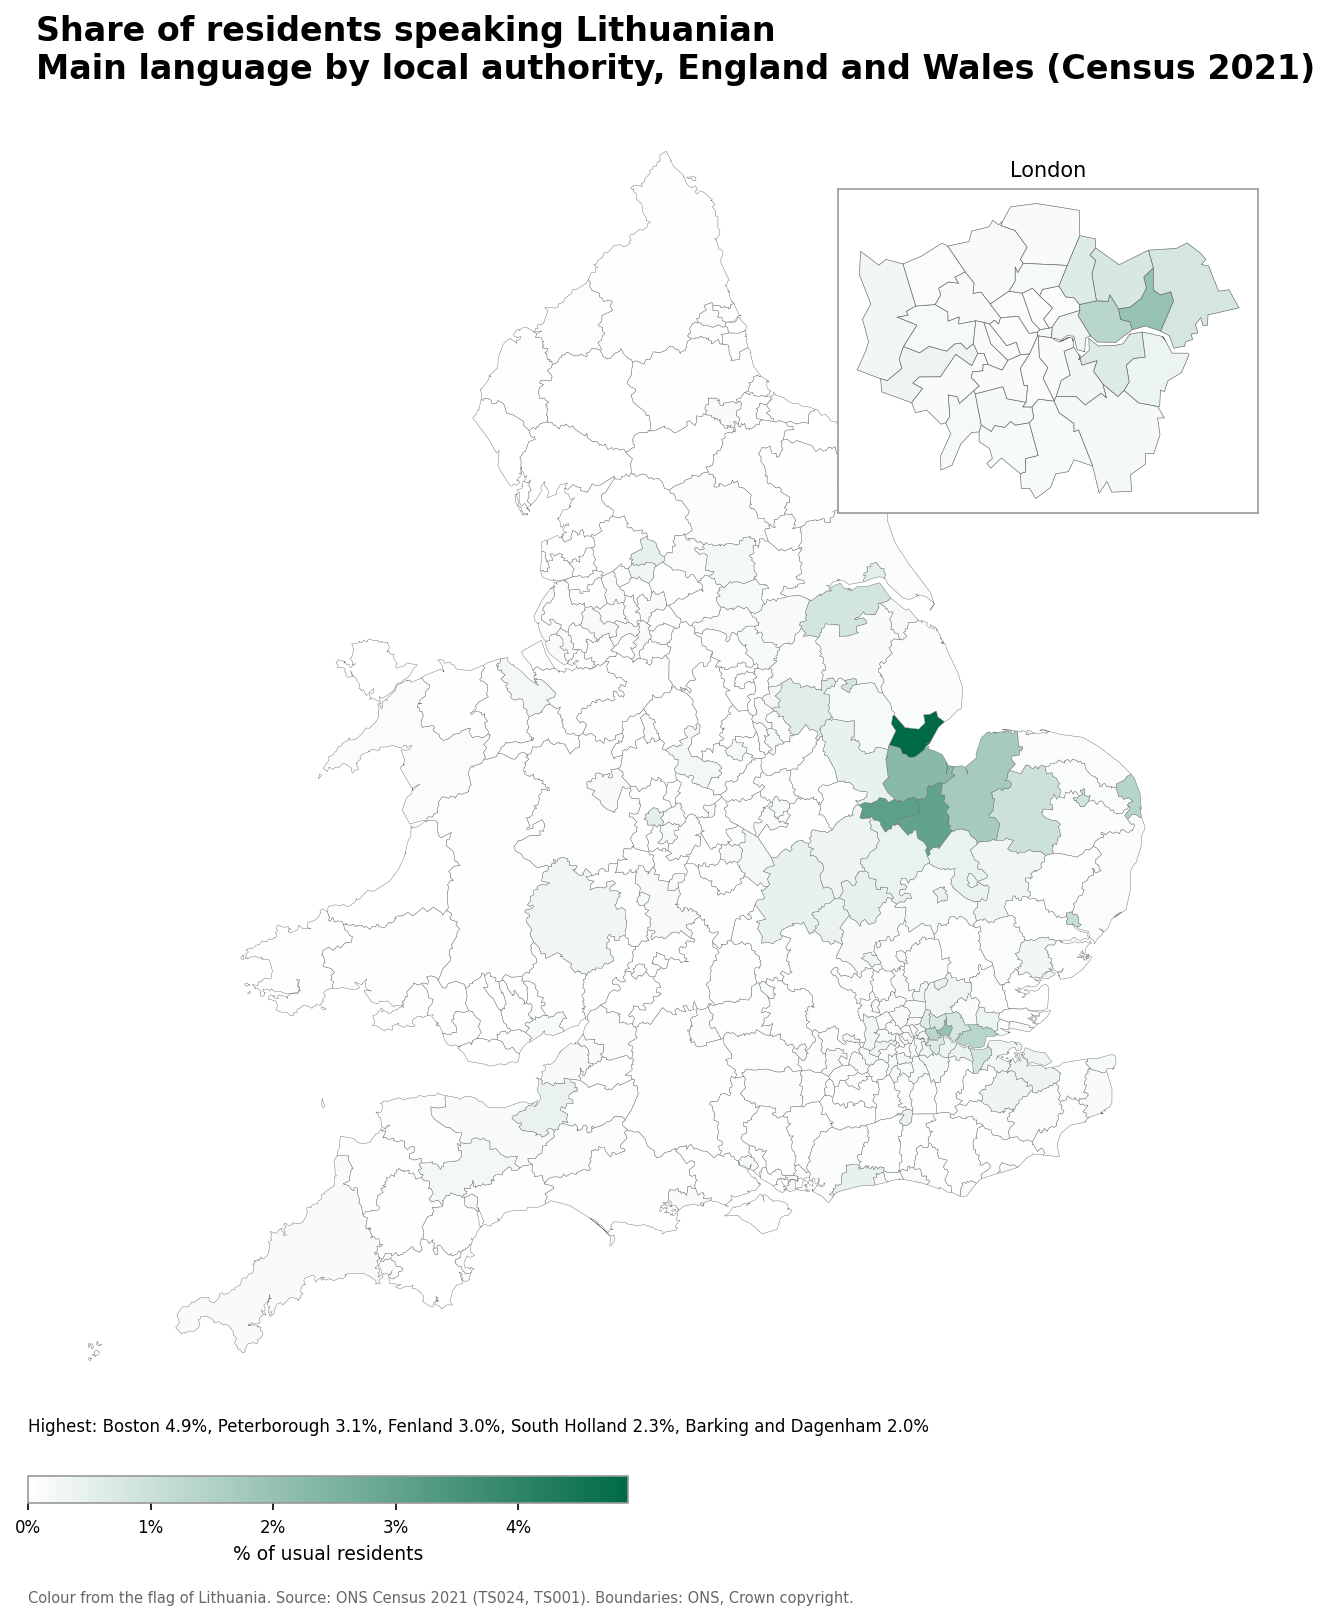
- Boston: 4.9% (3,452 speakers)
- Peterborough: 3.1% (6,720 speakers)
- Fenland: 3.0% (3,084 speakers)
- South Holland: 2.3% (2,147 speakers)
- Barking and Dagenham: 2.0% (4,427 speakers)
Number of Polish speakers
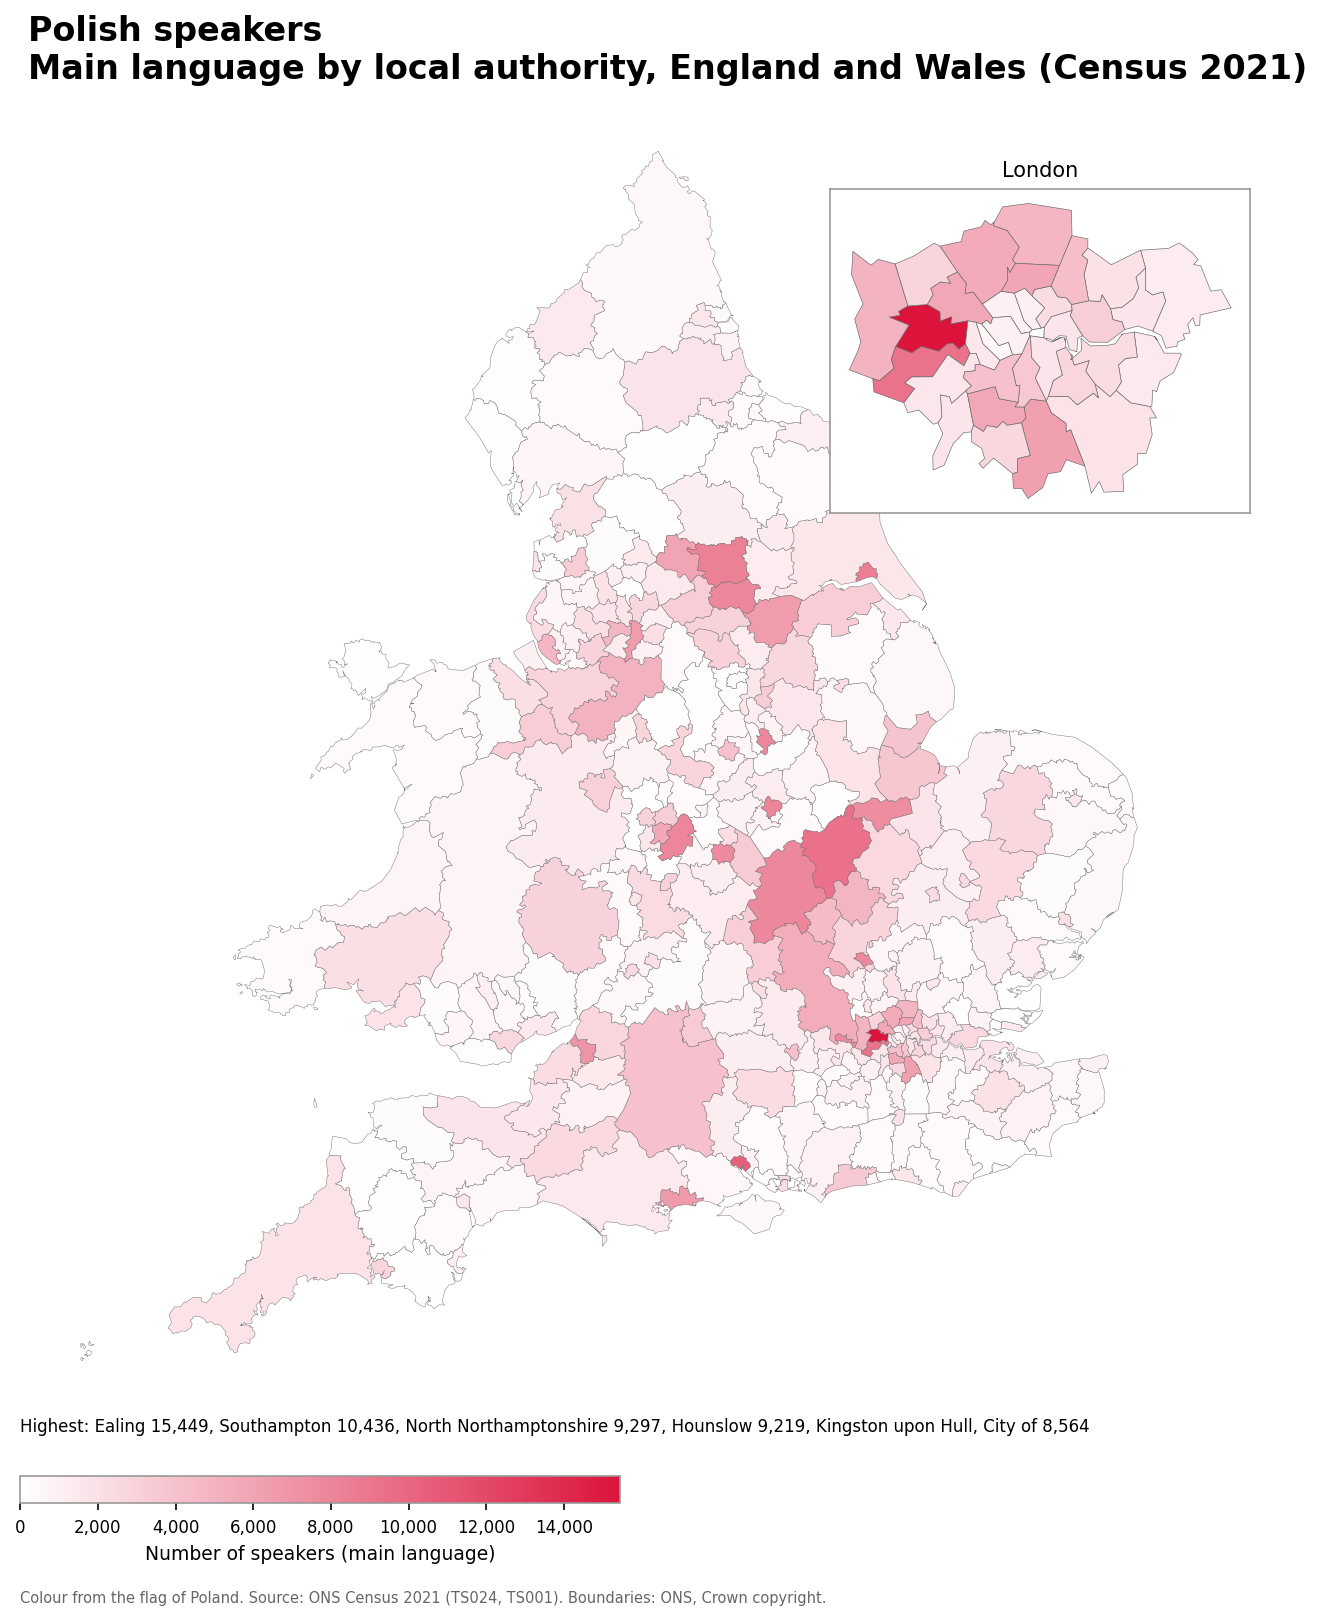
- Ealing: 15,449
- Southampton: 10,436
- North Northamptonshire: 9,297
- Hounslow: 9,219
- Kingston upon Hull: 8,564
Polish speakers as a share of the population
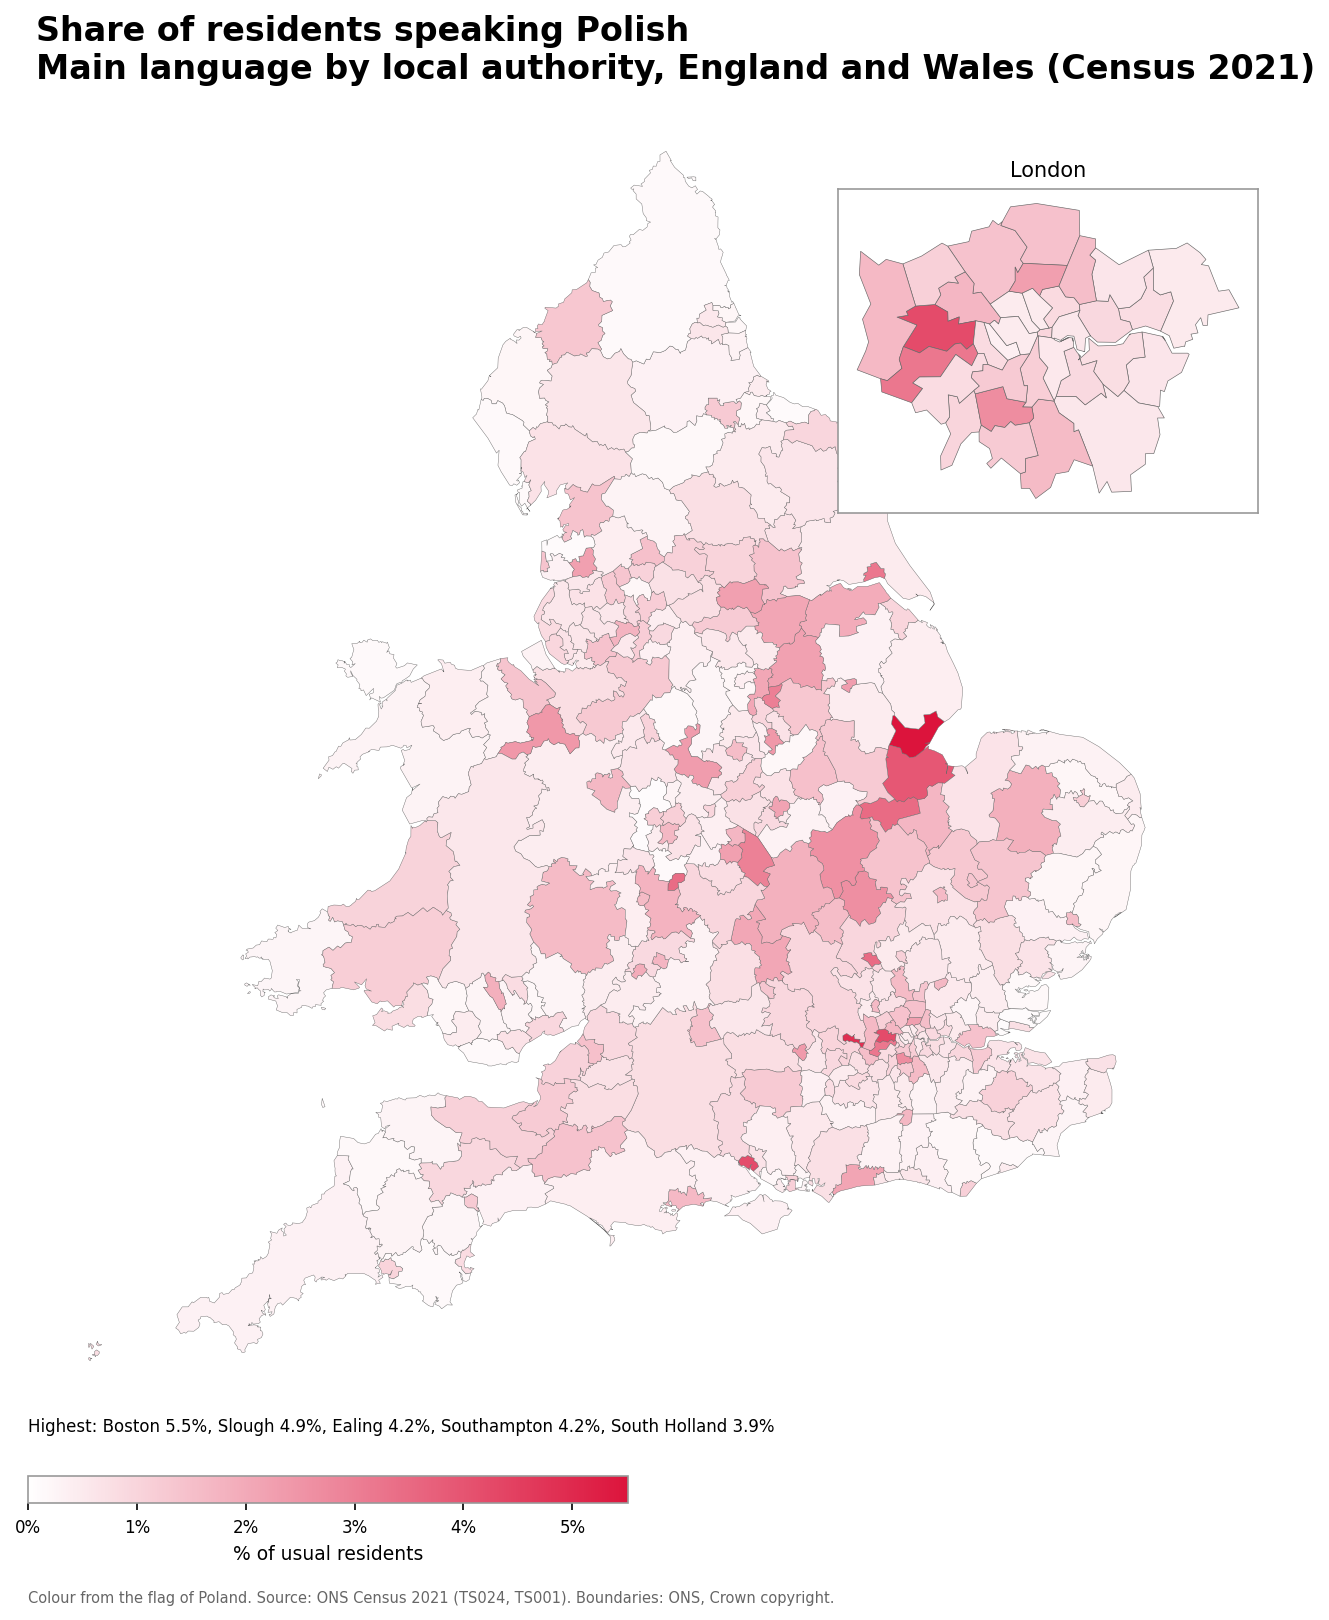
- Boston: 5.5% (3,886 speakers)
- Slough: 4.9% (7,724 speakers)
- Ealing: 4.2% (15,449 speakers)
- Southampton: 4.2% (10,436 speakers)
- South Holland: 3.9% (3,737 speakers)
Number of Slovak speakers
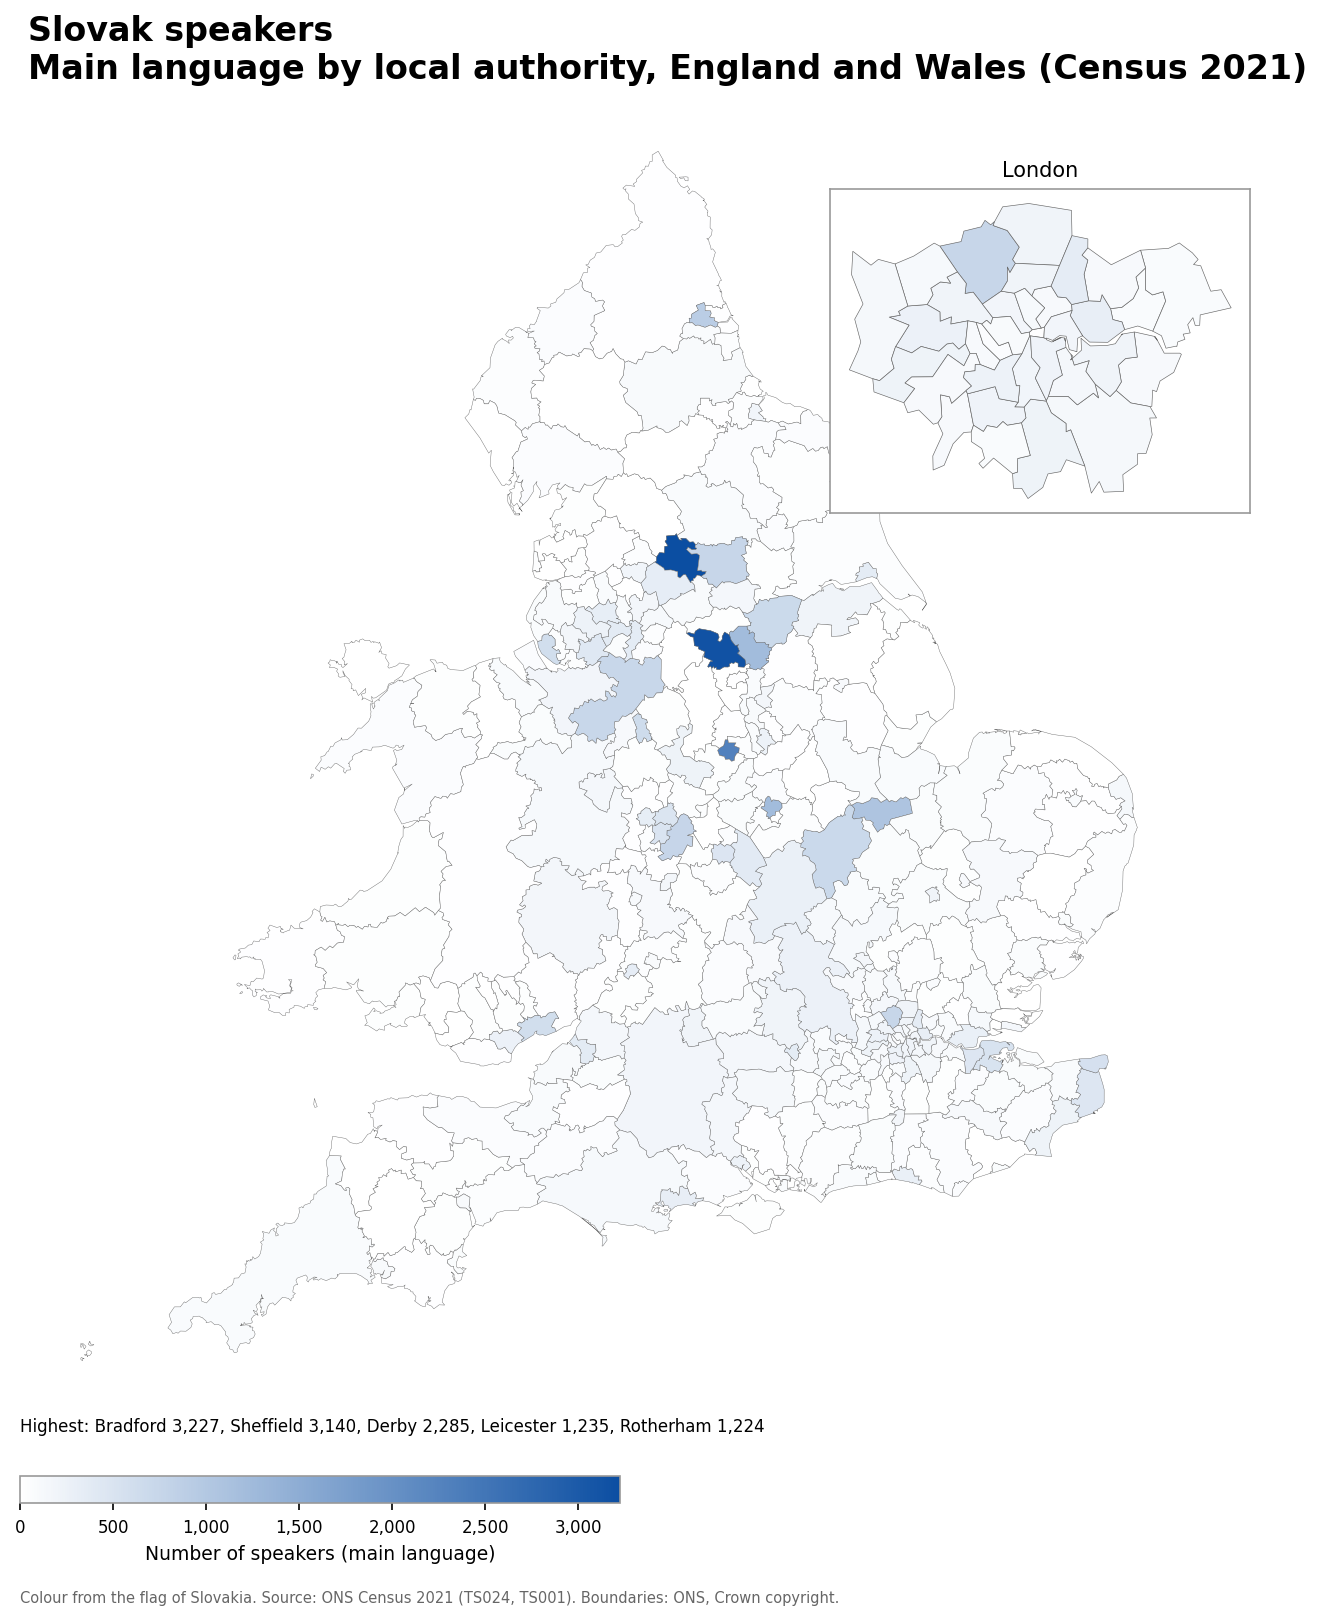
- Bradford: 3,227
- Sheffield: 3,140
- Derby: 2,285
- Leicester: 1,235
- Rotherham: 1,224
Slovak speakers as a share of the population
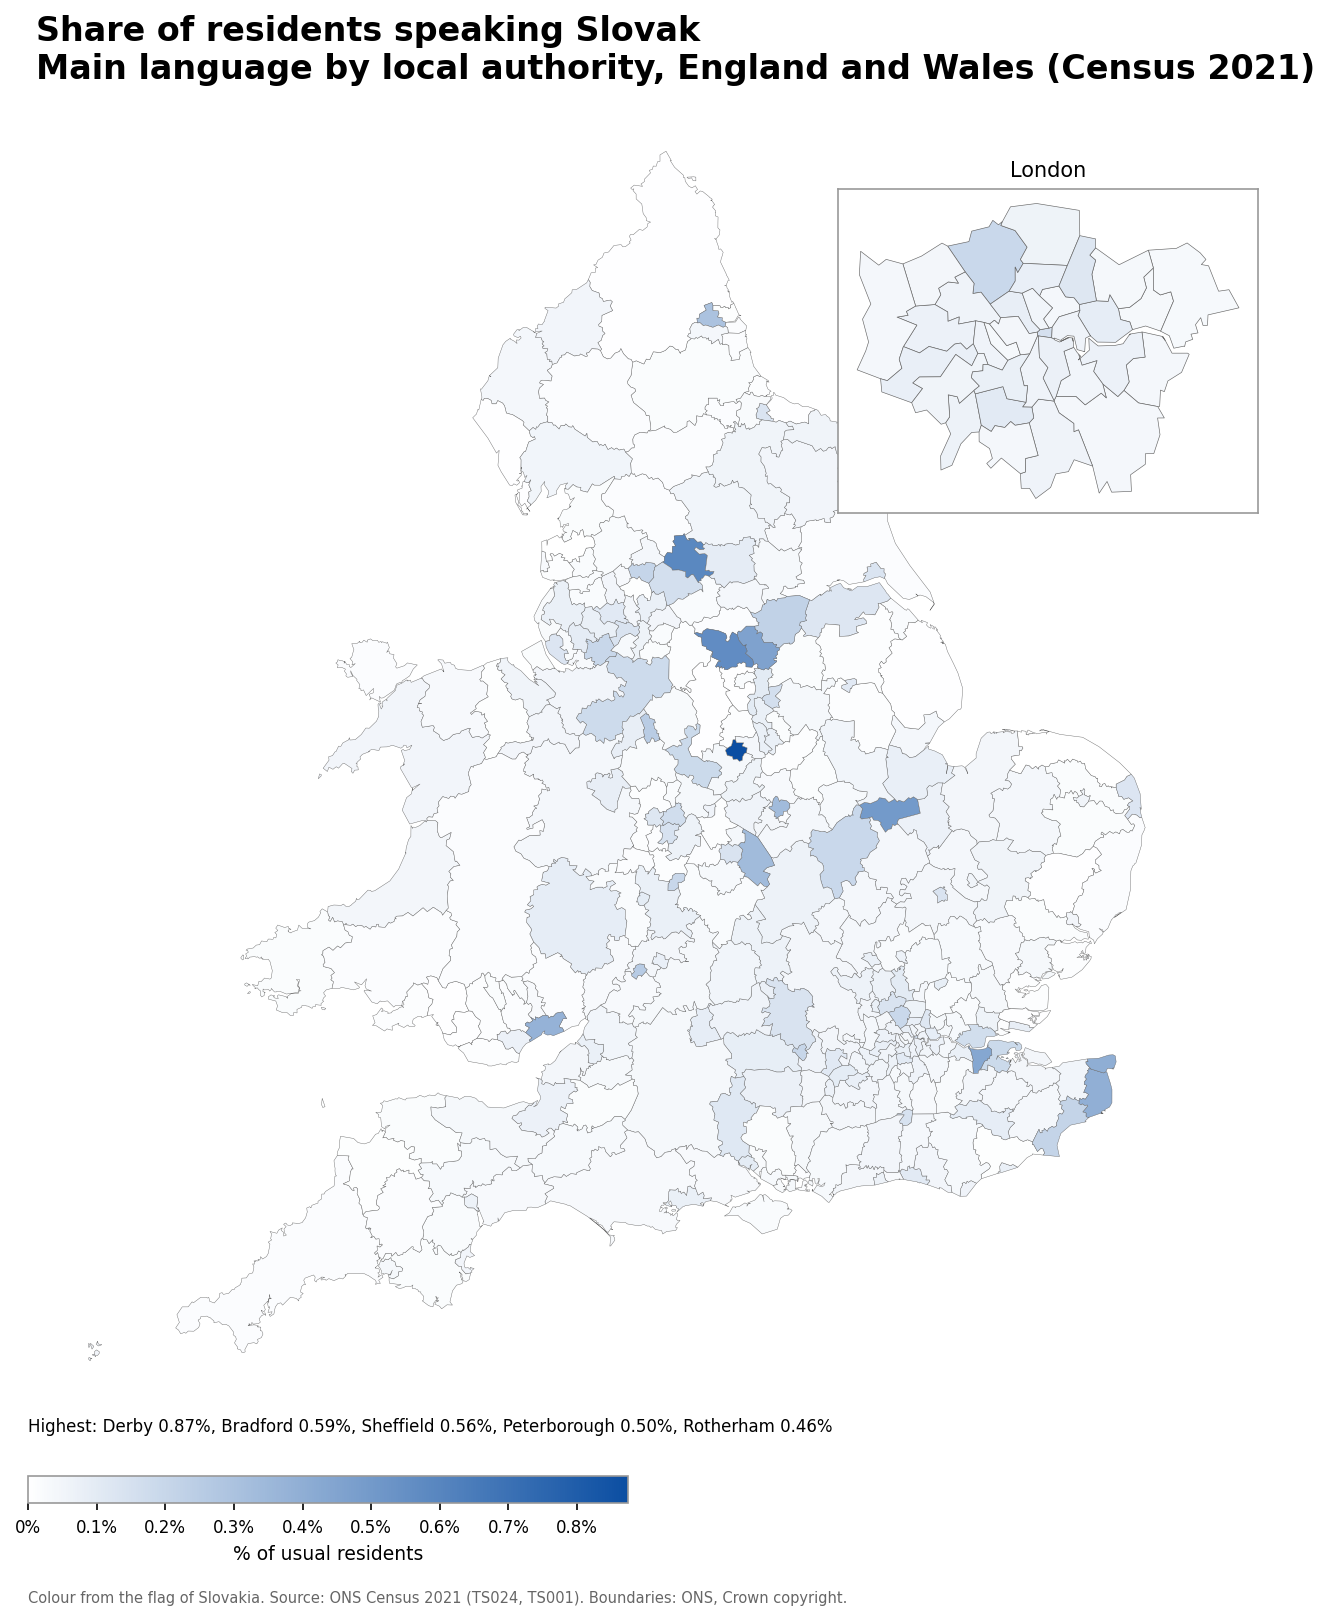
- Derby: 0.87% (2,285 speakers)
- Bradford: 0.59% (3,227 speakers)
- Sheffield: 0.56% (3,140 speakers)
- Peterborough: 0.50% (1,082 speakers)
- Rotherham: 0.46% (1,224 speakers)
Number of Czech speakers
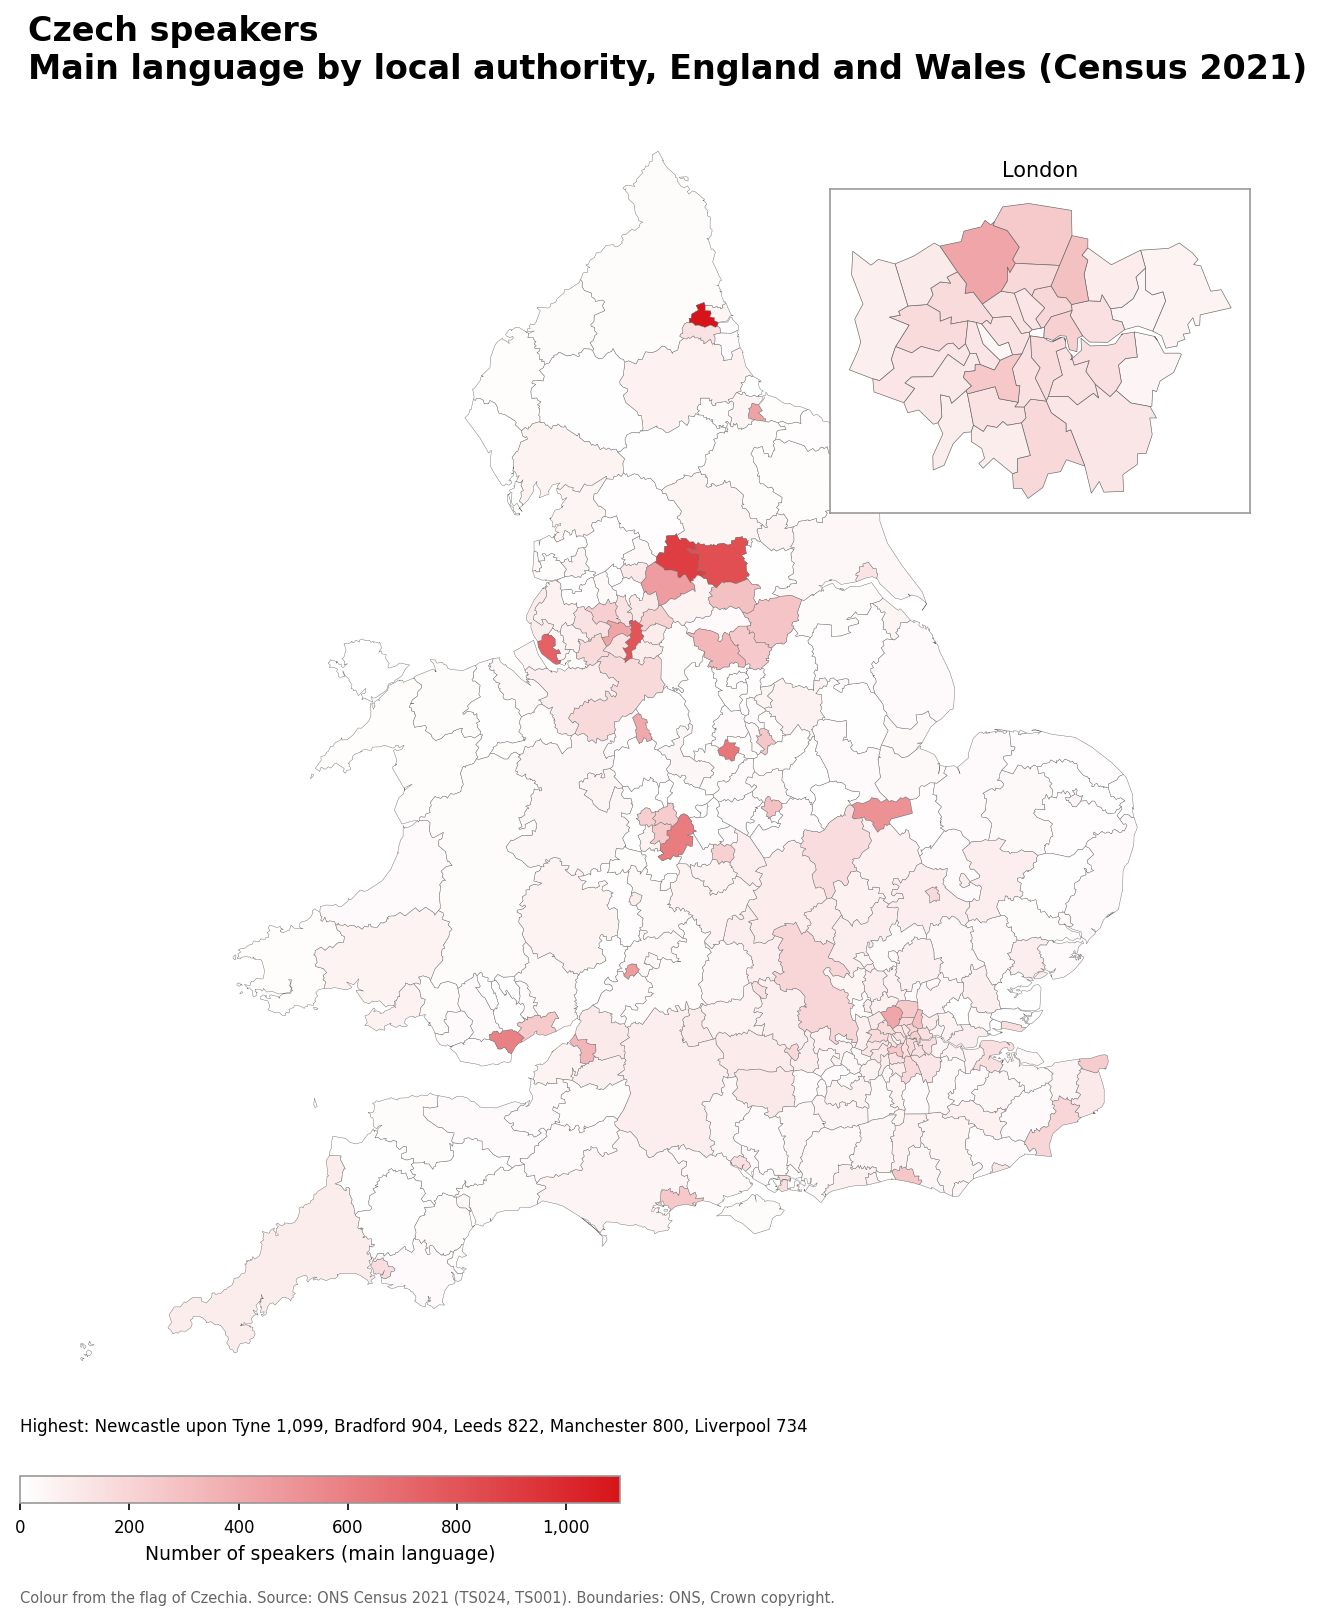
- Newcastle upon Tyne: 1,099
- Bradford: 904
- Leeds: 822
- Manchester: 800
- Liverpool: 734
Czech speakers as a share of the population
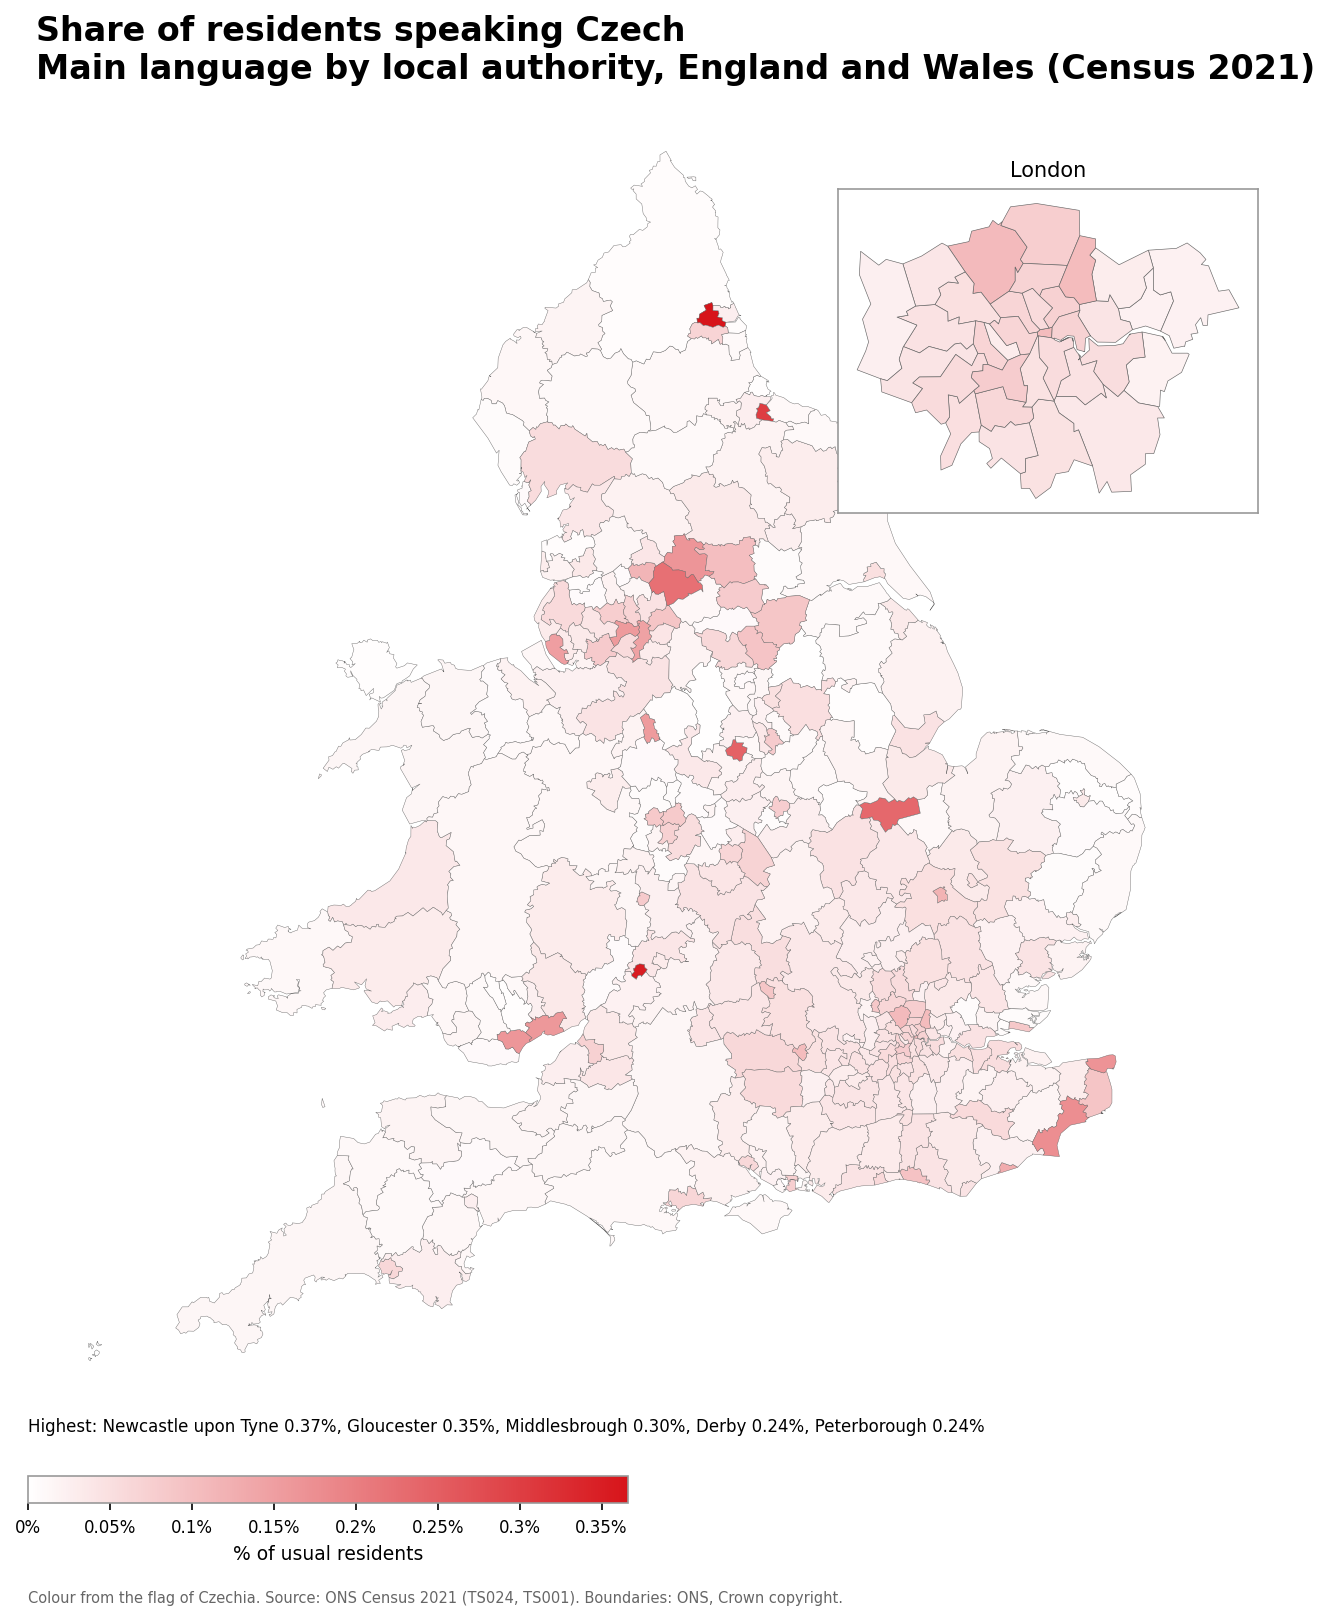
- Newcastle upon Tyne: 0.37% (1,099 speakers)
- Gloucester: 0.35% (468 speakers)
- Middlesbrough: 0.30% (435 speakers)
- Derby: 0.24% (639 speakers)
- Peterborough: 0.24% (509 speakers)
Number of Hungarian speakers
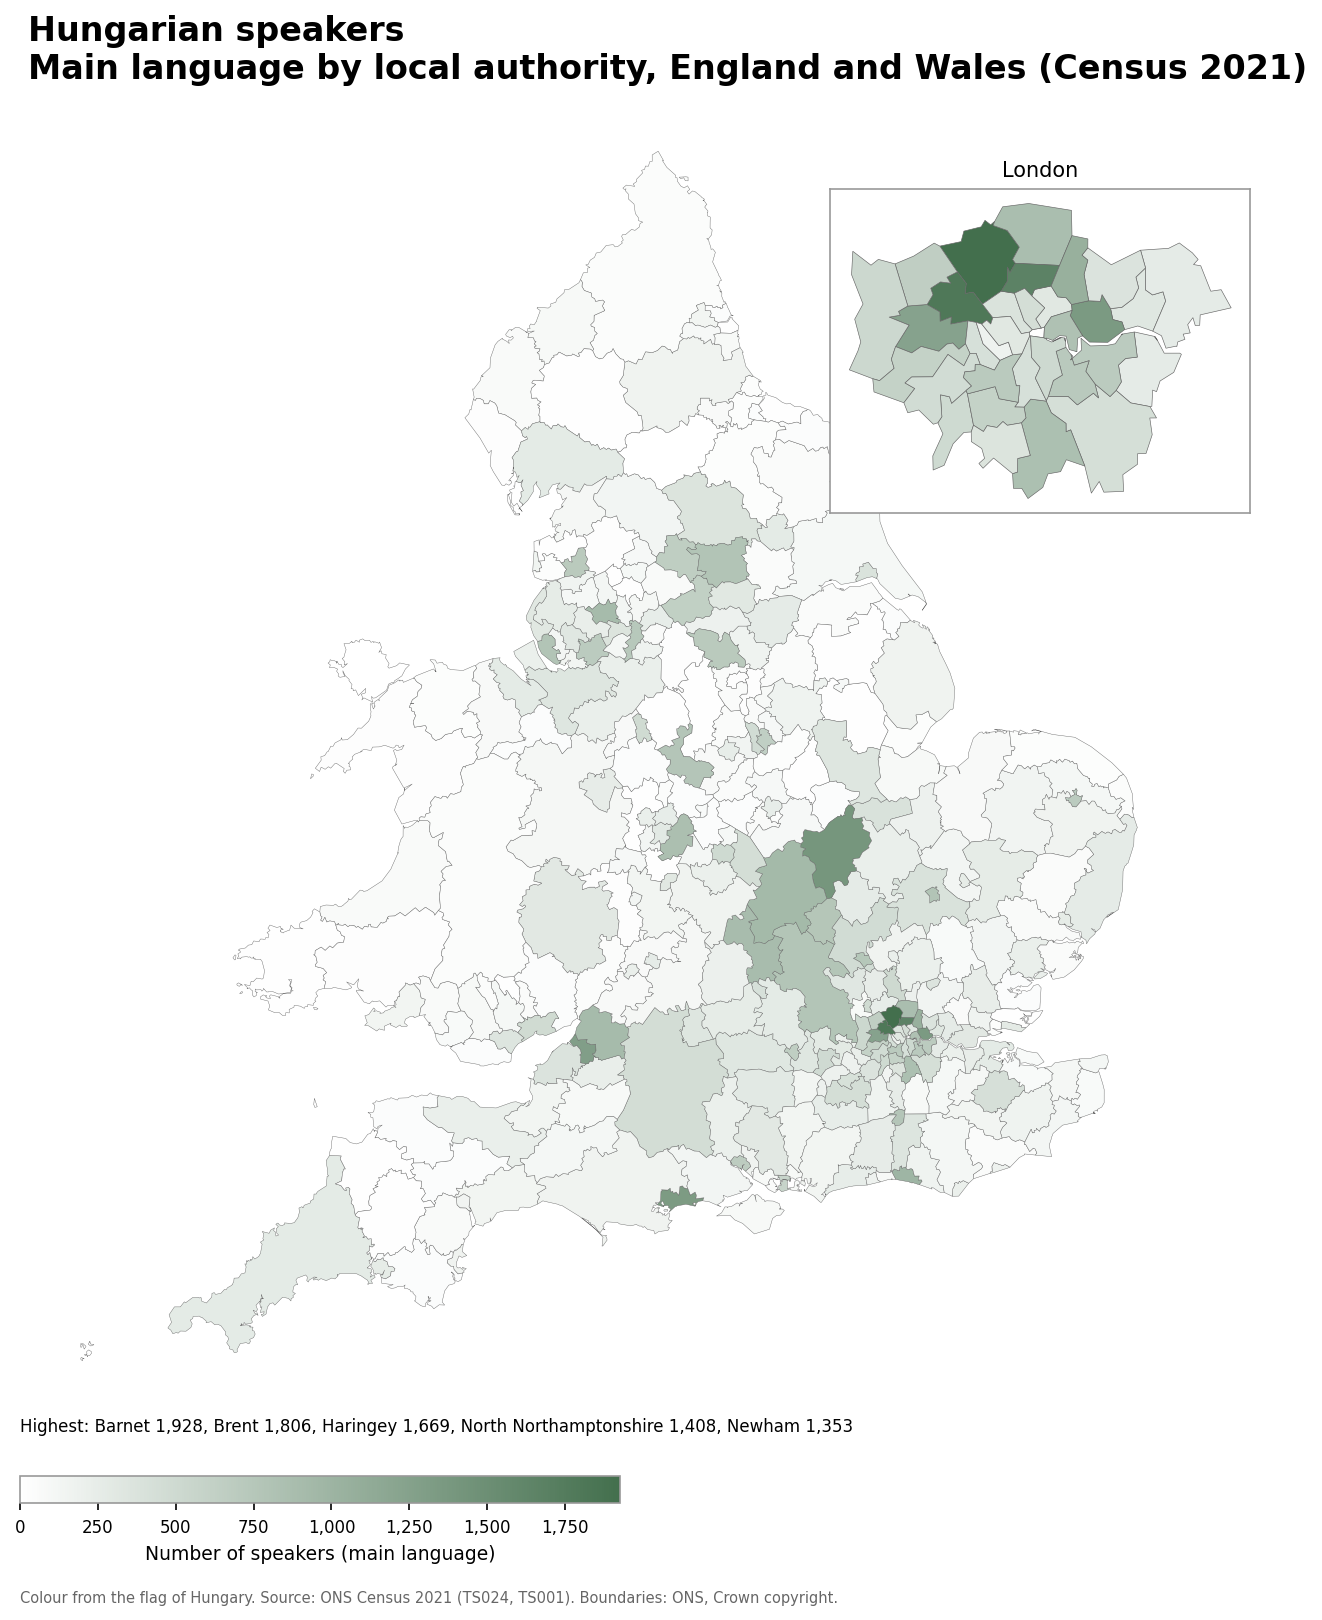
- Barnet: 1,928
- Brent: 1,806
- Haringey: 1,669
- North Northamptonshire: 1,408
- Newham: 1,353
Hungarian speakers as a share of the population
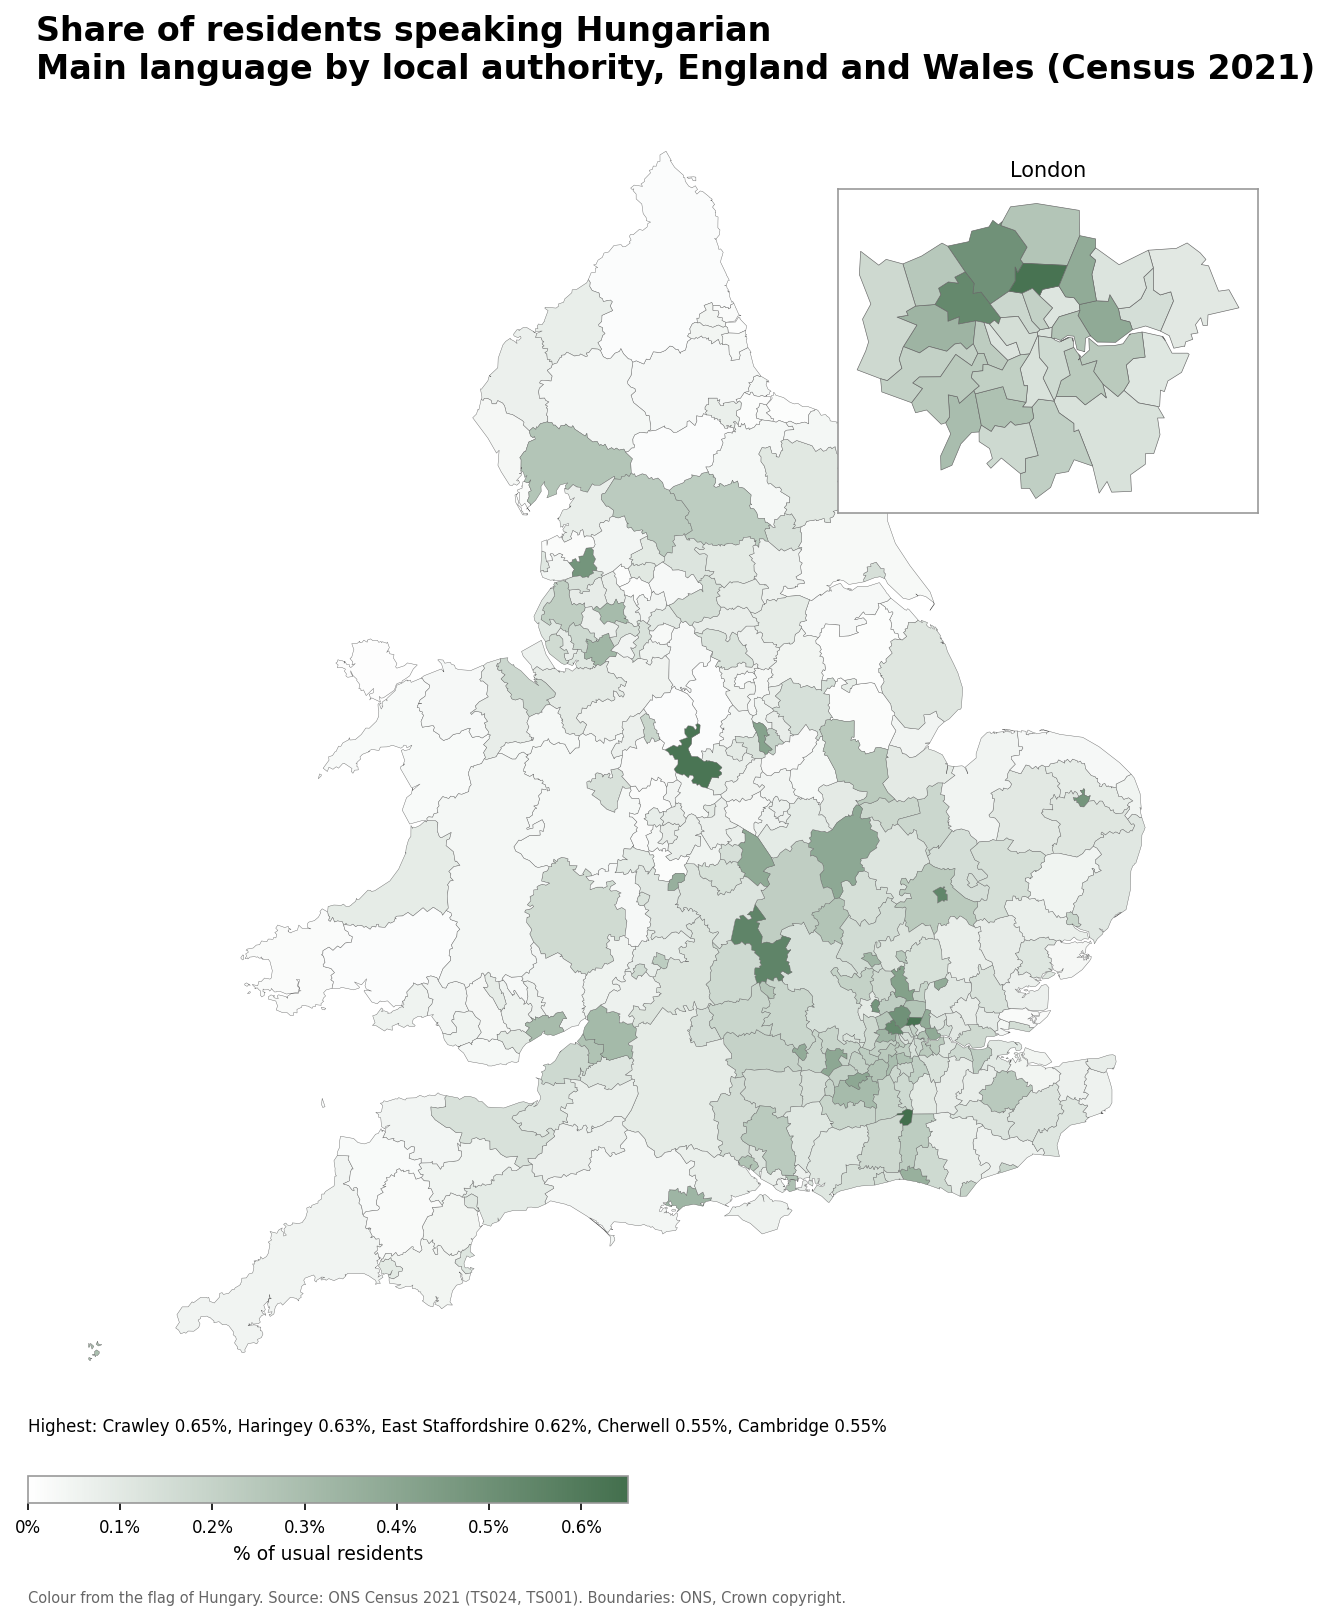
- Crawley: 0.65% (771 speakers)
- Haringey: 0.63% (1,669 speakers)
- East Staffordshire: 0.62% (774 speakers)
- Cherwell: 0.55% (891 speakers)
- Cambridge: 0.55% (795 speakers)
Number of Romanian speakers
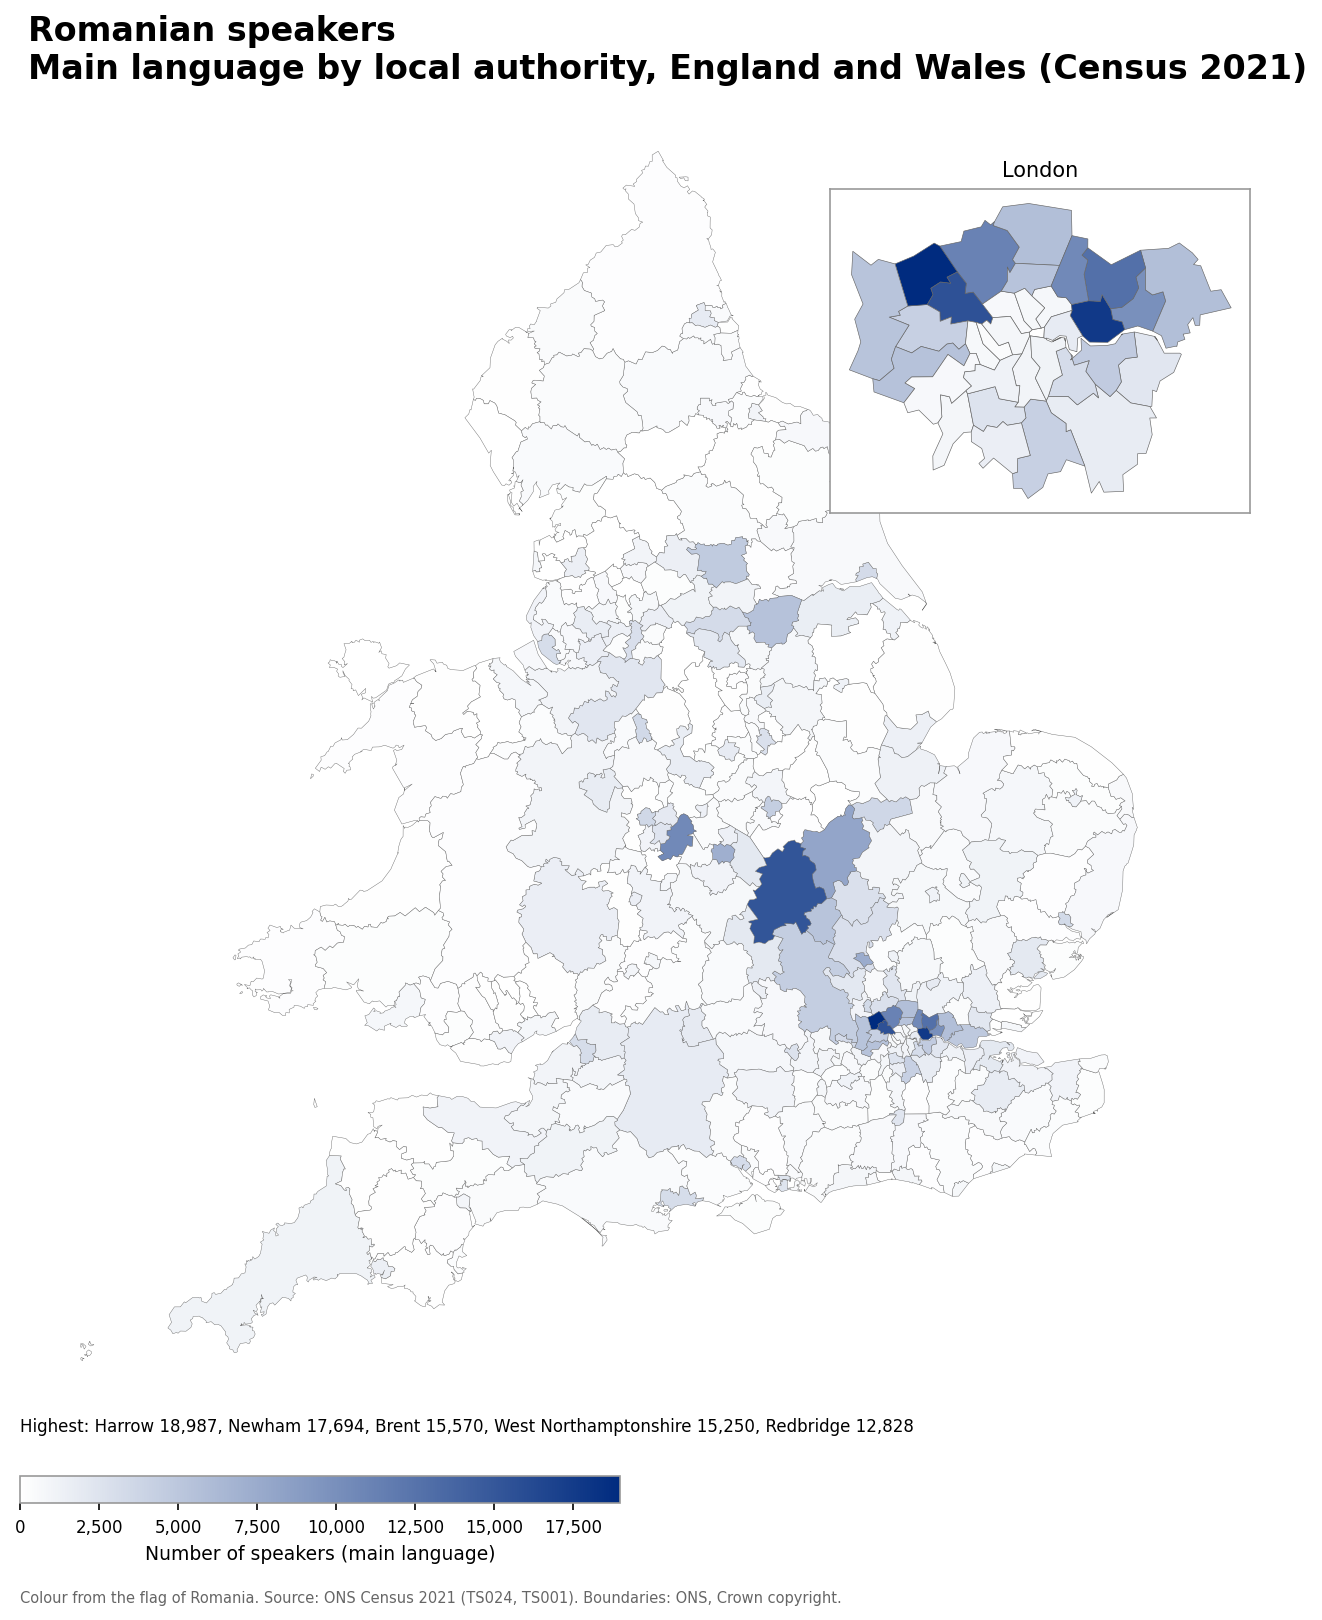
- Harrow: 18,987
- Newham: 17,694
- Brent: 15,570
- West Northamptonshire: 15,250
- Redbridge: 12,828
Romanian speakers as a share of the population
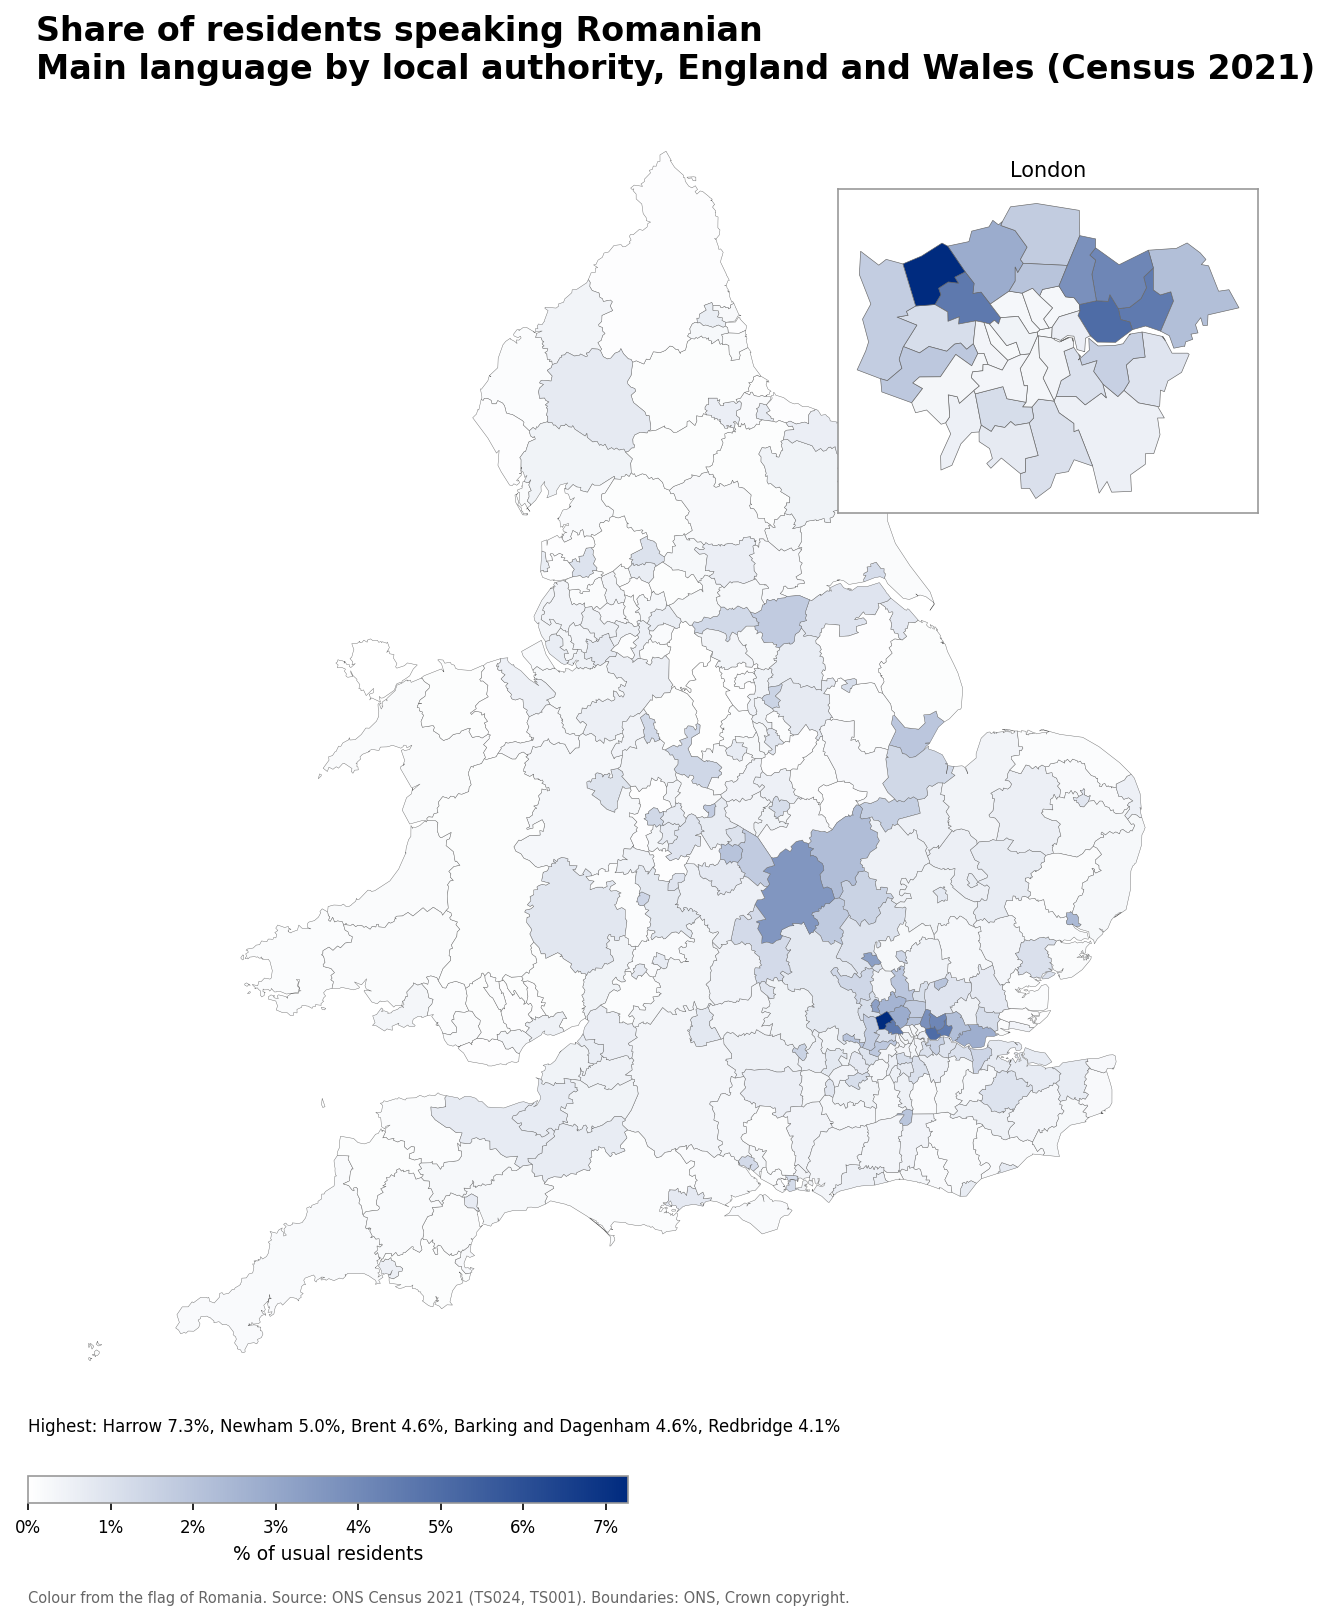
- Harrow: 7.3% (18,987 speakers)
- Newham: 5.0% (17,694 speakers)
- Brent: 4.6% (15,570 speakers)
- Barking and Dagenham: 4.6% (9,988 speakers)
- Redbridge: 4.1% (12,828 speakers)
Number of Bulgarian speakers
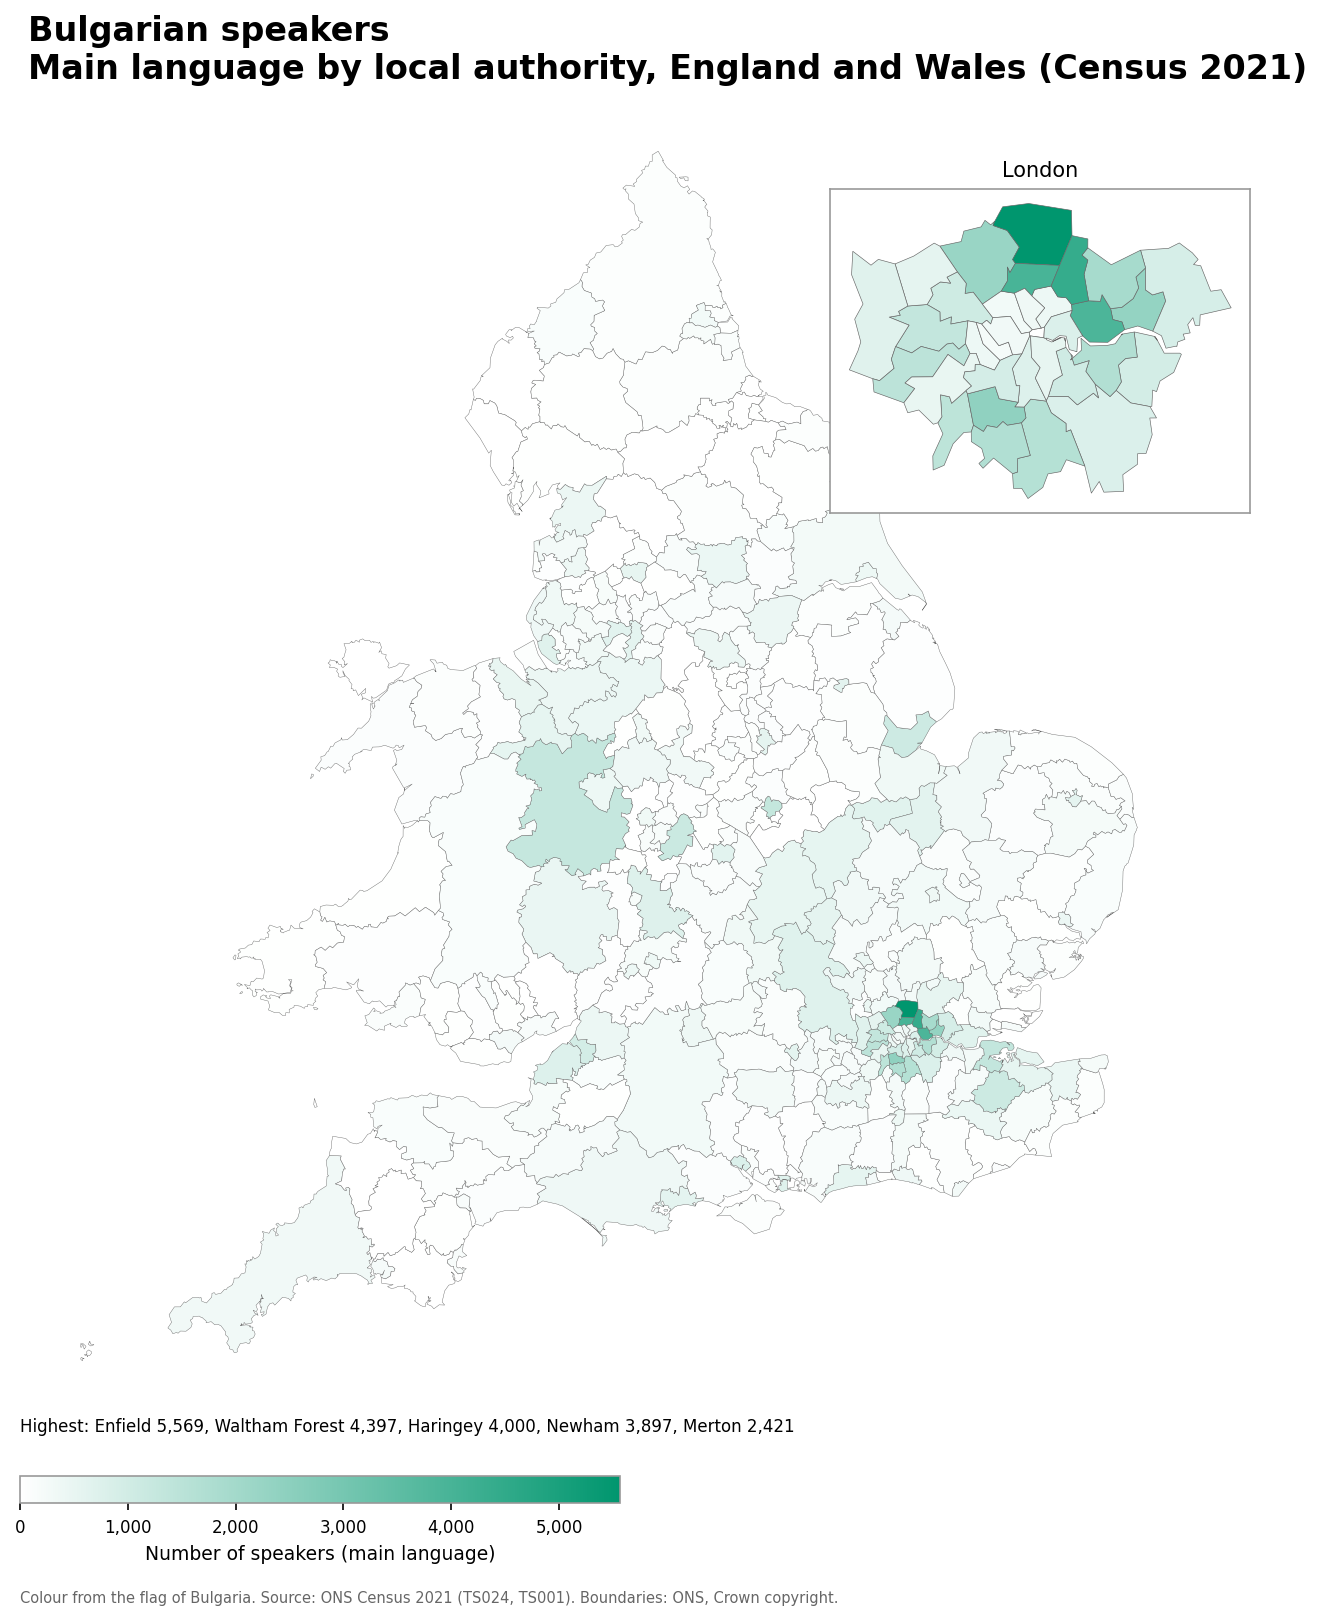
- Enfield: 5,569
- Waltham Forest: 4,397
- Haringey: 4,000
- Newham: 3,897
- Merton: 2,421
Bulgarian speakers as a share of the population
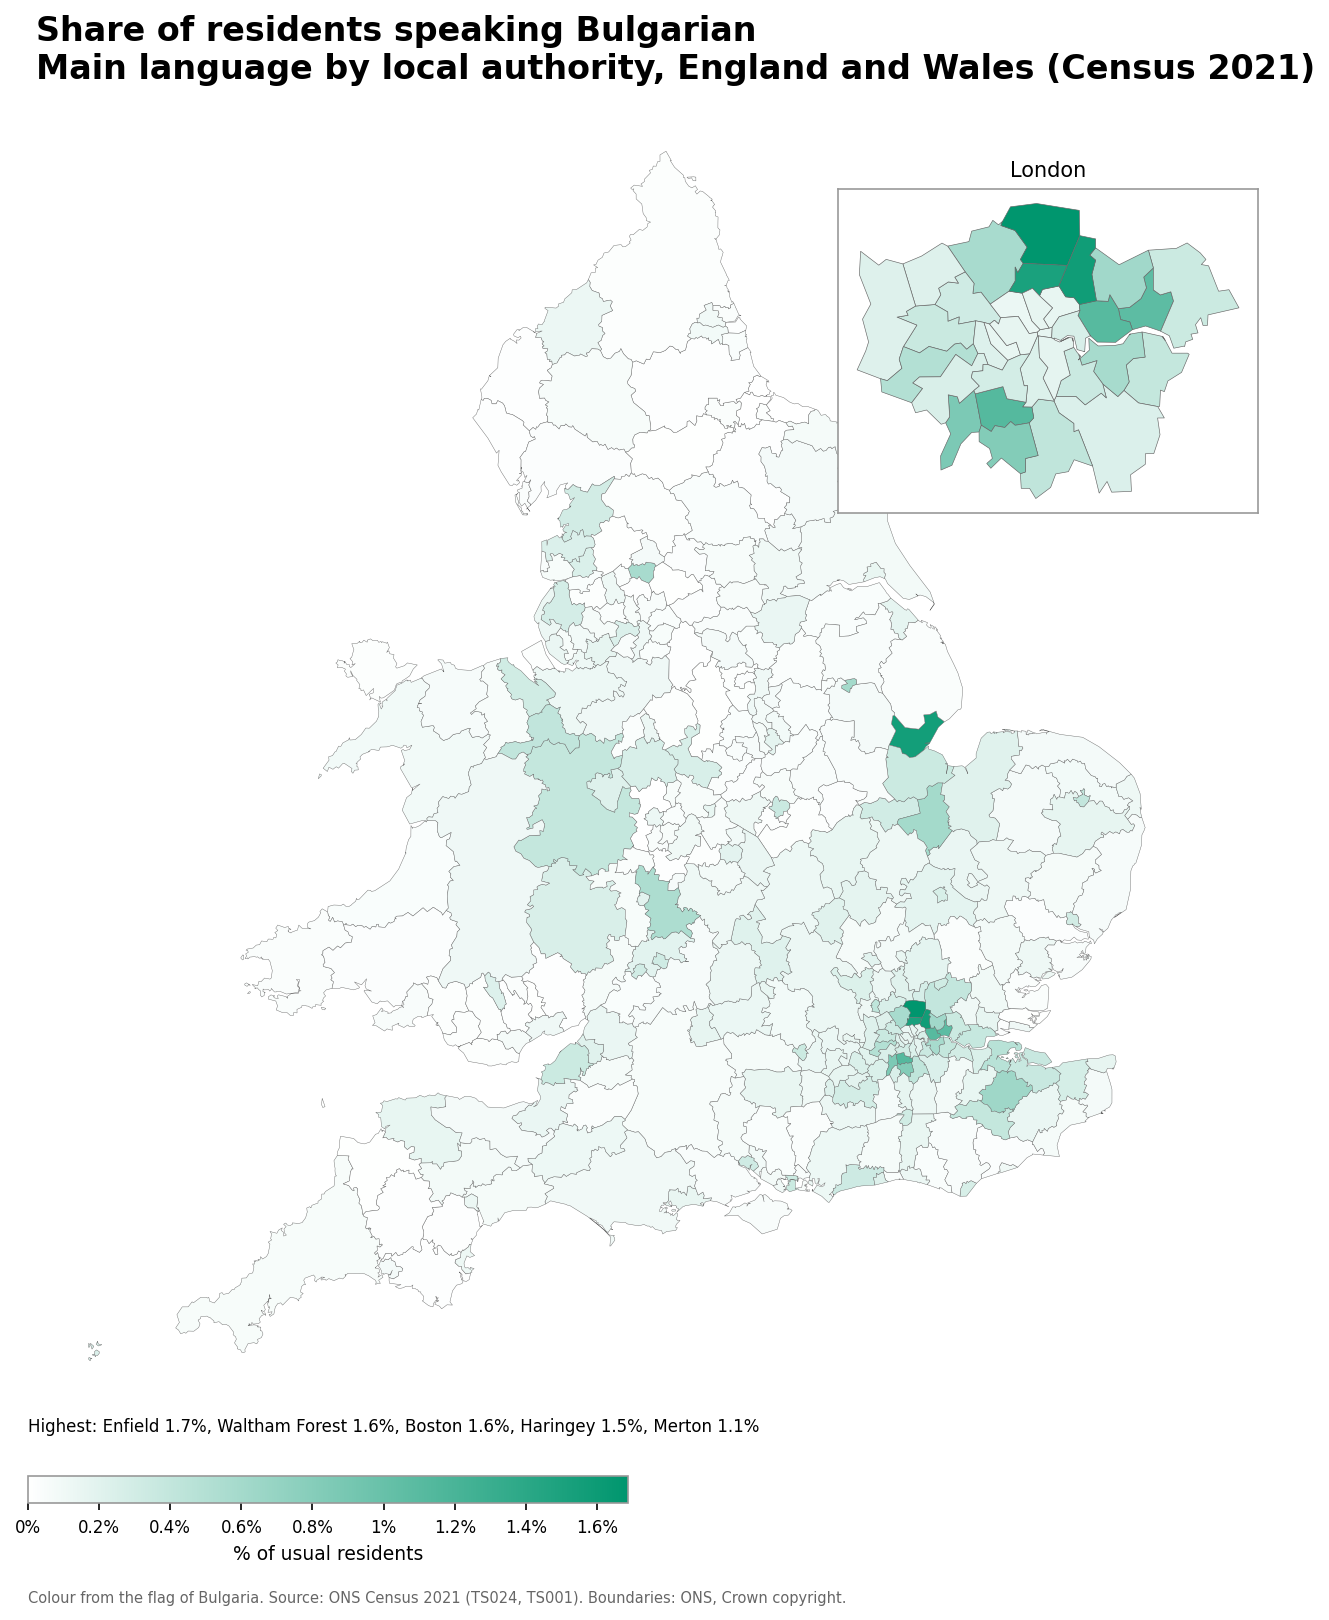
- Enfield: 1.7% (5,569 speakers)
- Waltham Forest: 1.6% (4,397 speakers)
- Boston: 1.6% (1,098 speakers)
- Haringey: 1.5% (4,000 speakers)
- Merton: 1.1% (2,421 speakers)
Number of Slovenian speakers
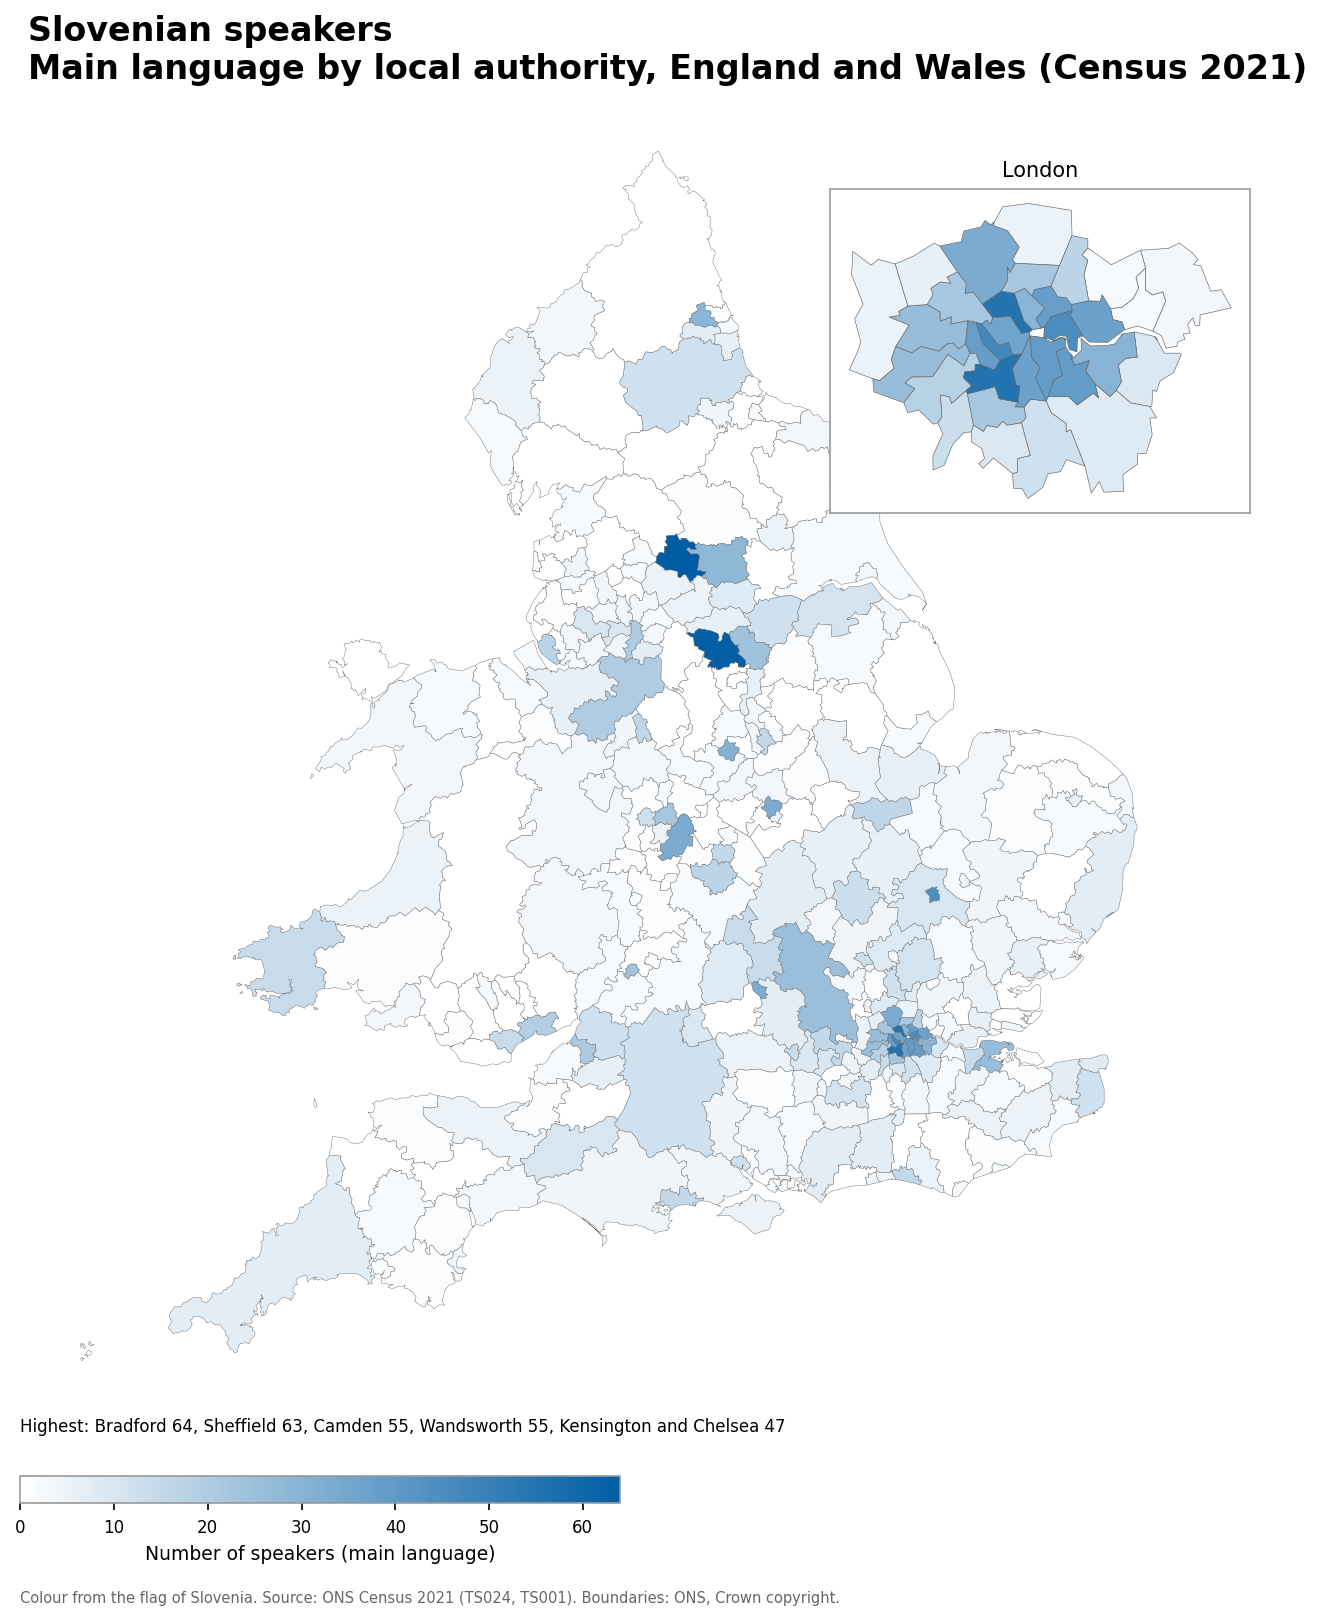
- Bradford: 64
- Sheffield: 63
- Camden: 55
- Wandsworth: 55
- Kensington and Chelsea: 47
Slovenian speakers as a share of the population
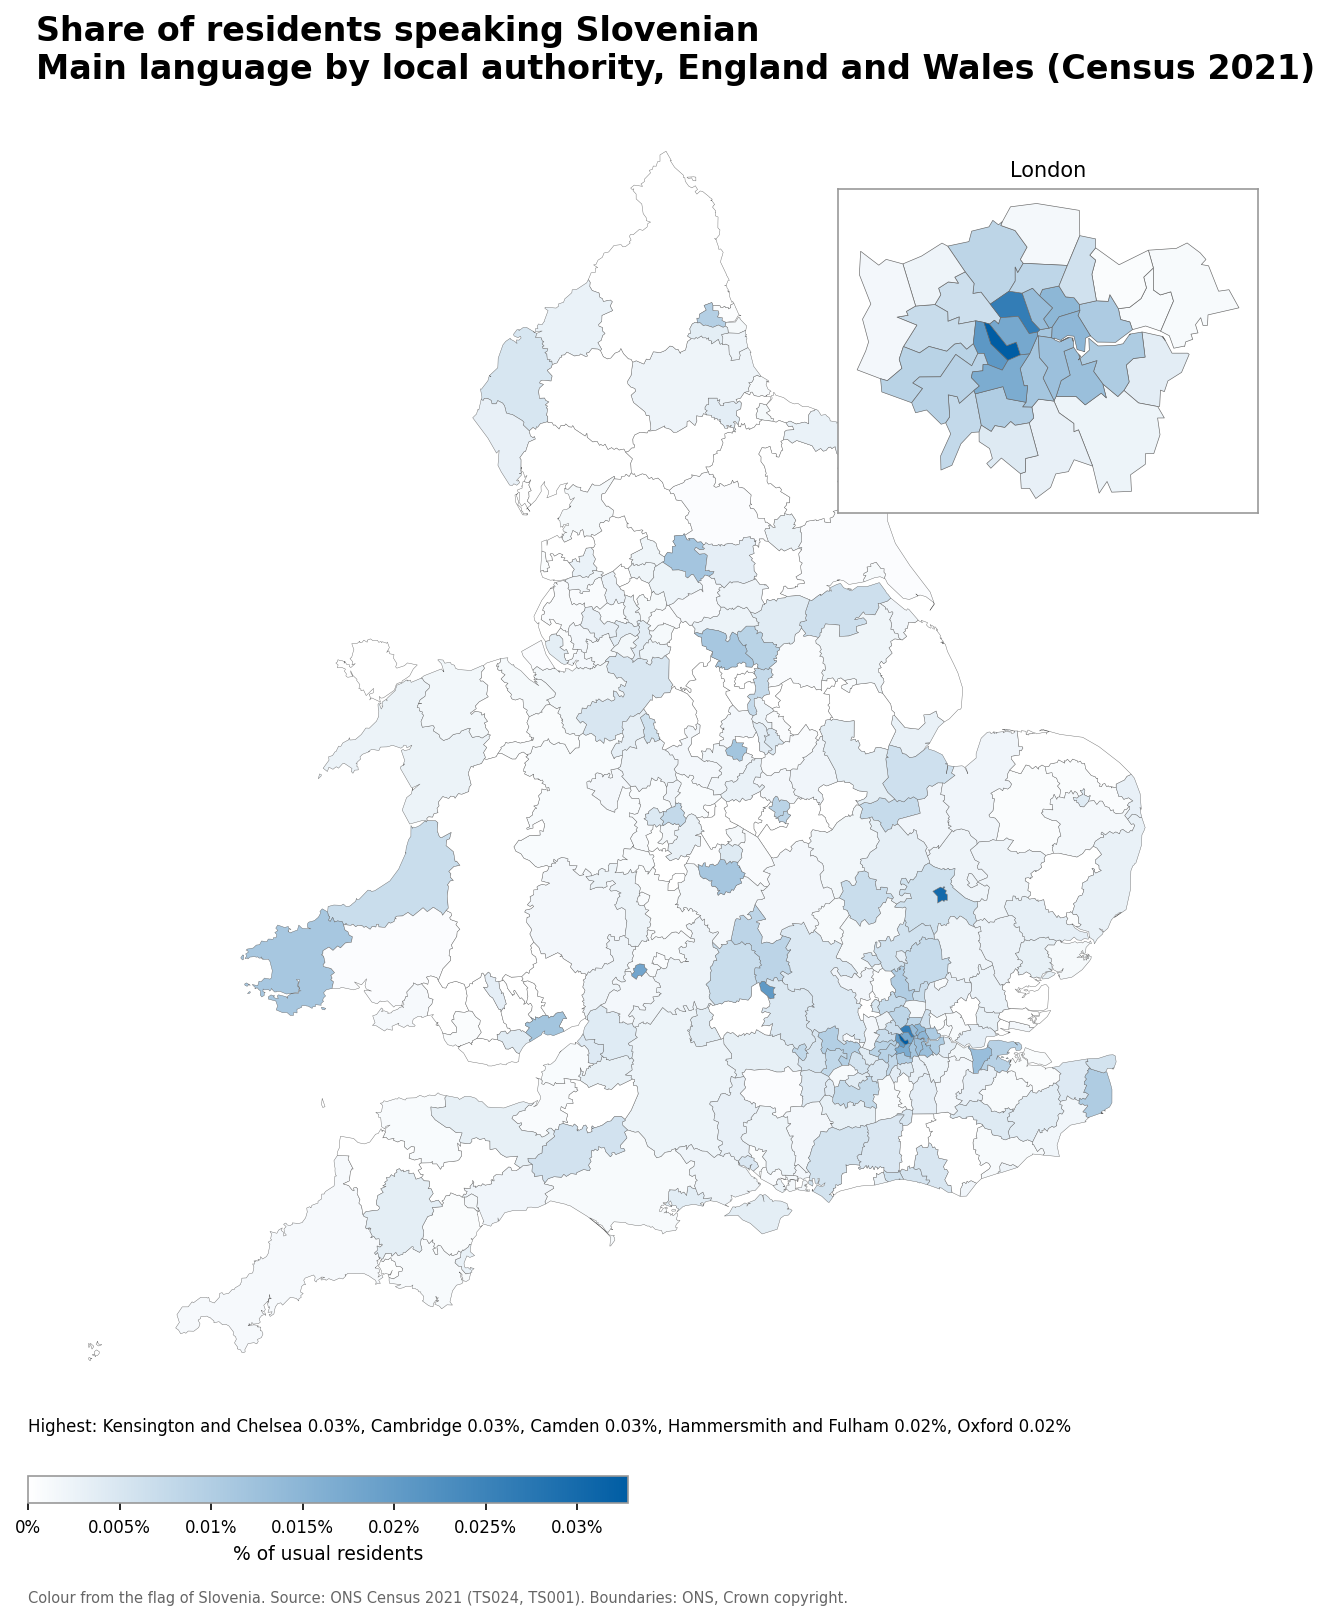
- Kensington and Chelsea: 0.03% (47 speakers)
- Cambridge: 0.03% (44 speakers)
- Camden: 0.03% (55 speakers)
- Hammersmith and Fulham: 0.02% (38 speakers)
- Oxford: 0.02% (33 speakers)
Number of Bosnian, Croatian, Serbian and Montenegrin speakers
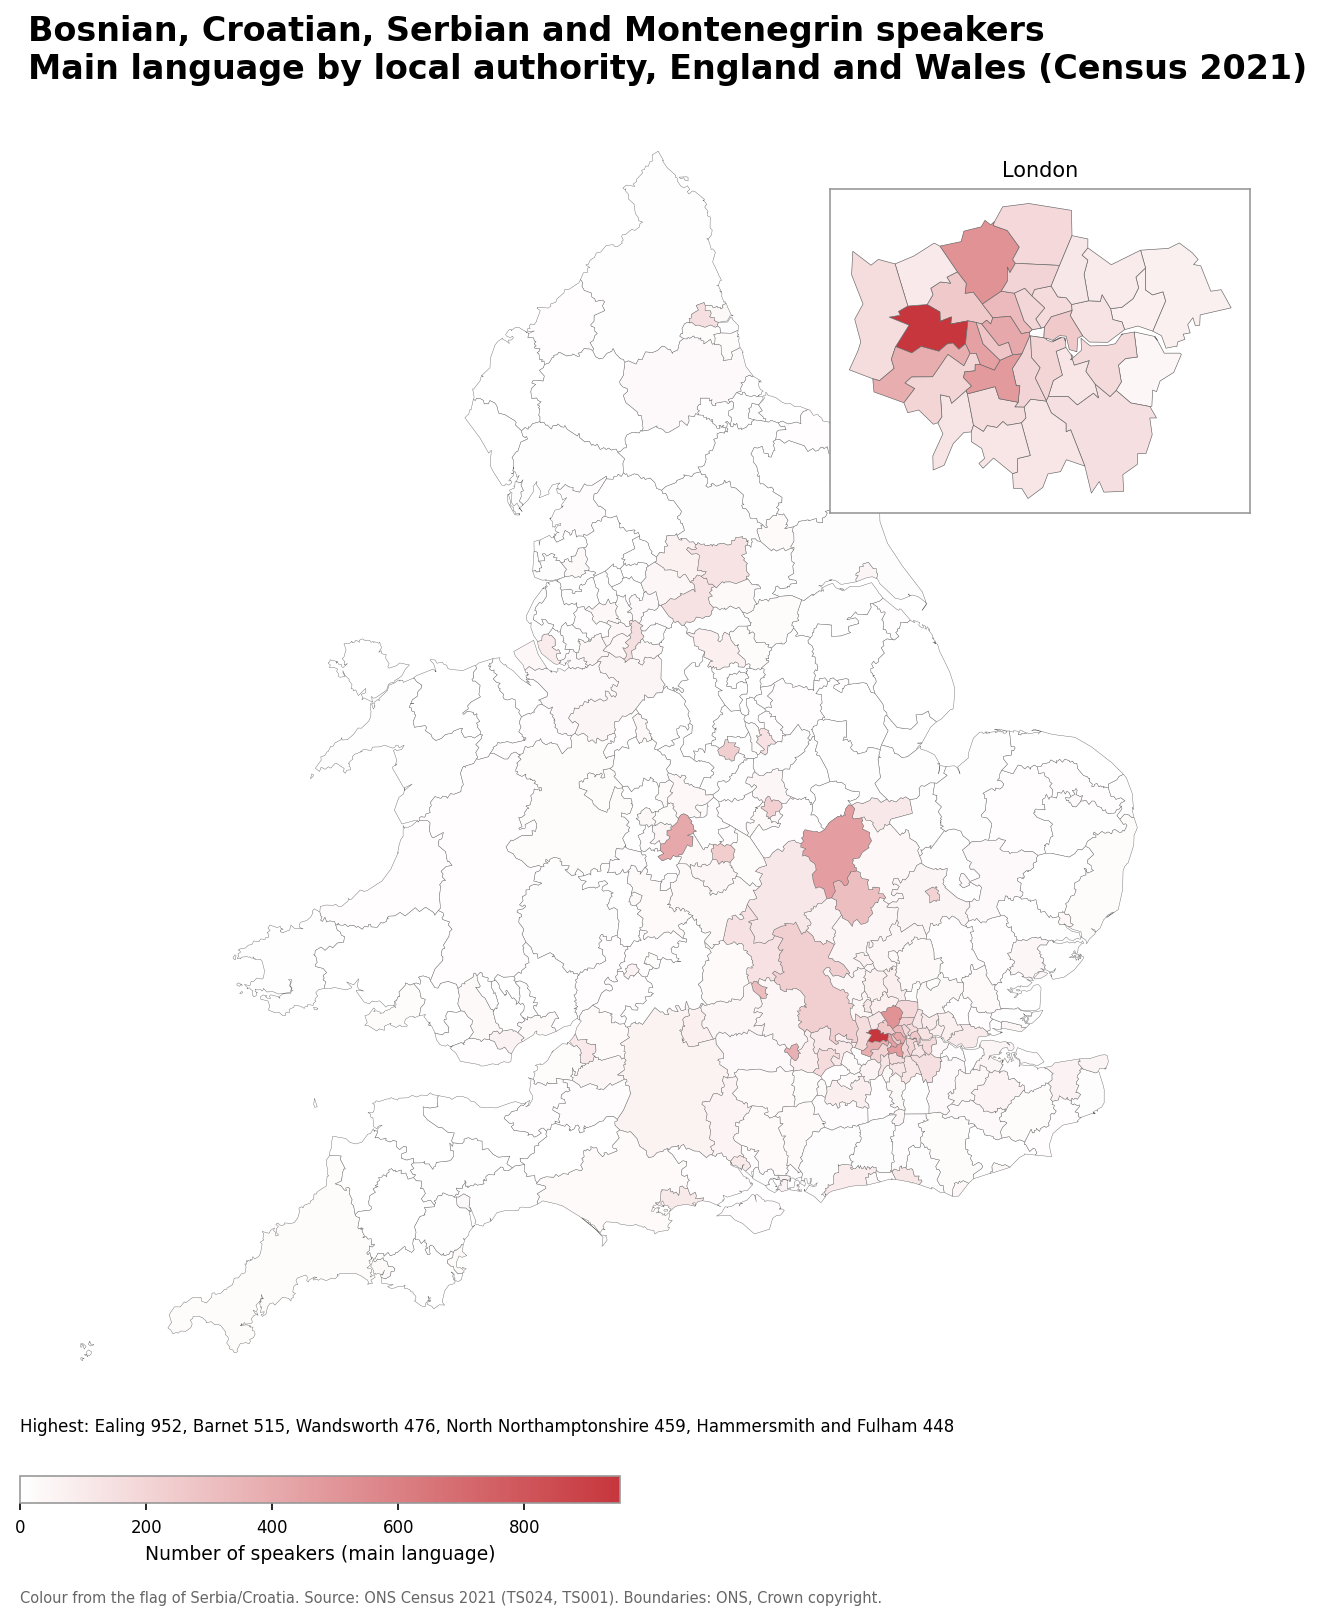
- Ealing: 952
- Barnet: 515
- Wandsworth: 476
- North Northamptonshire: 459
- Hammersmith and Fulham: 448
Bosnian, Croatian, Serbian and Montenegrin speakers as a share of the population
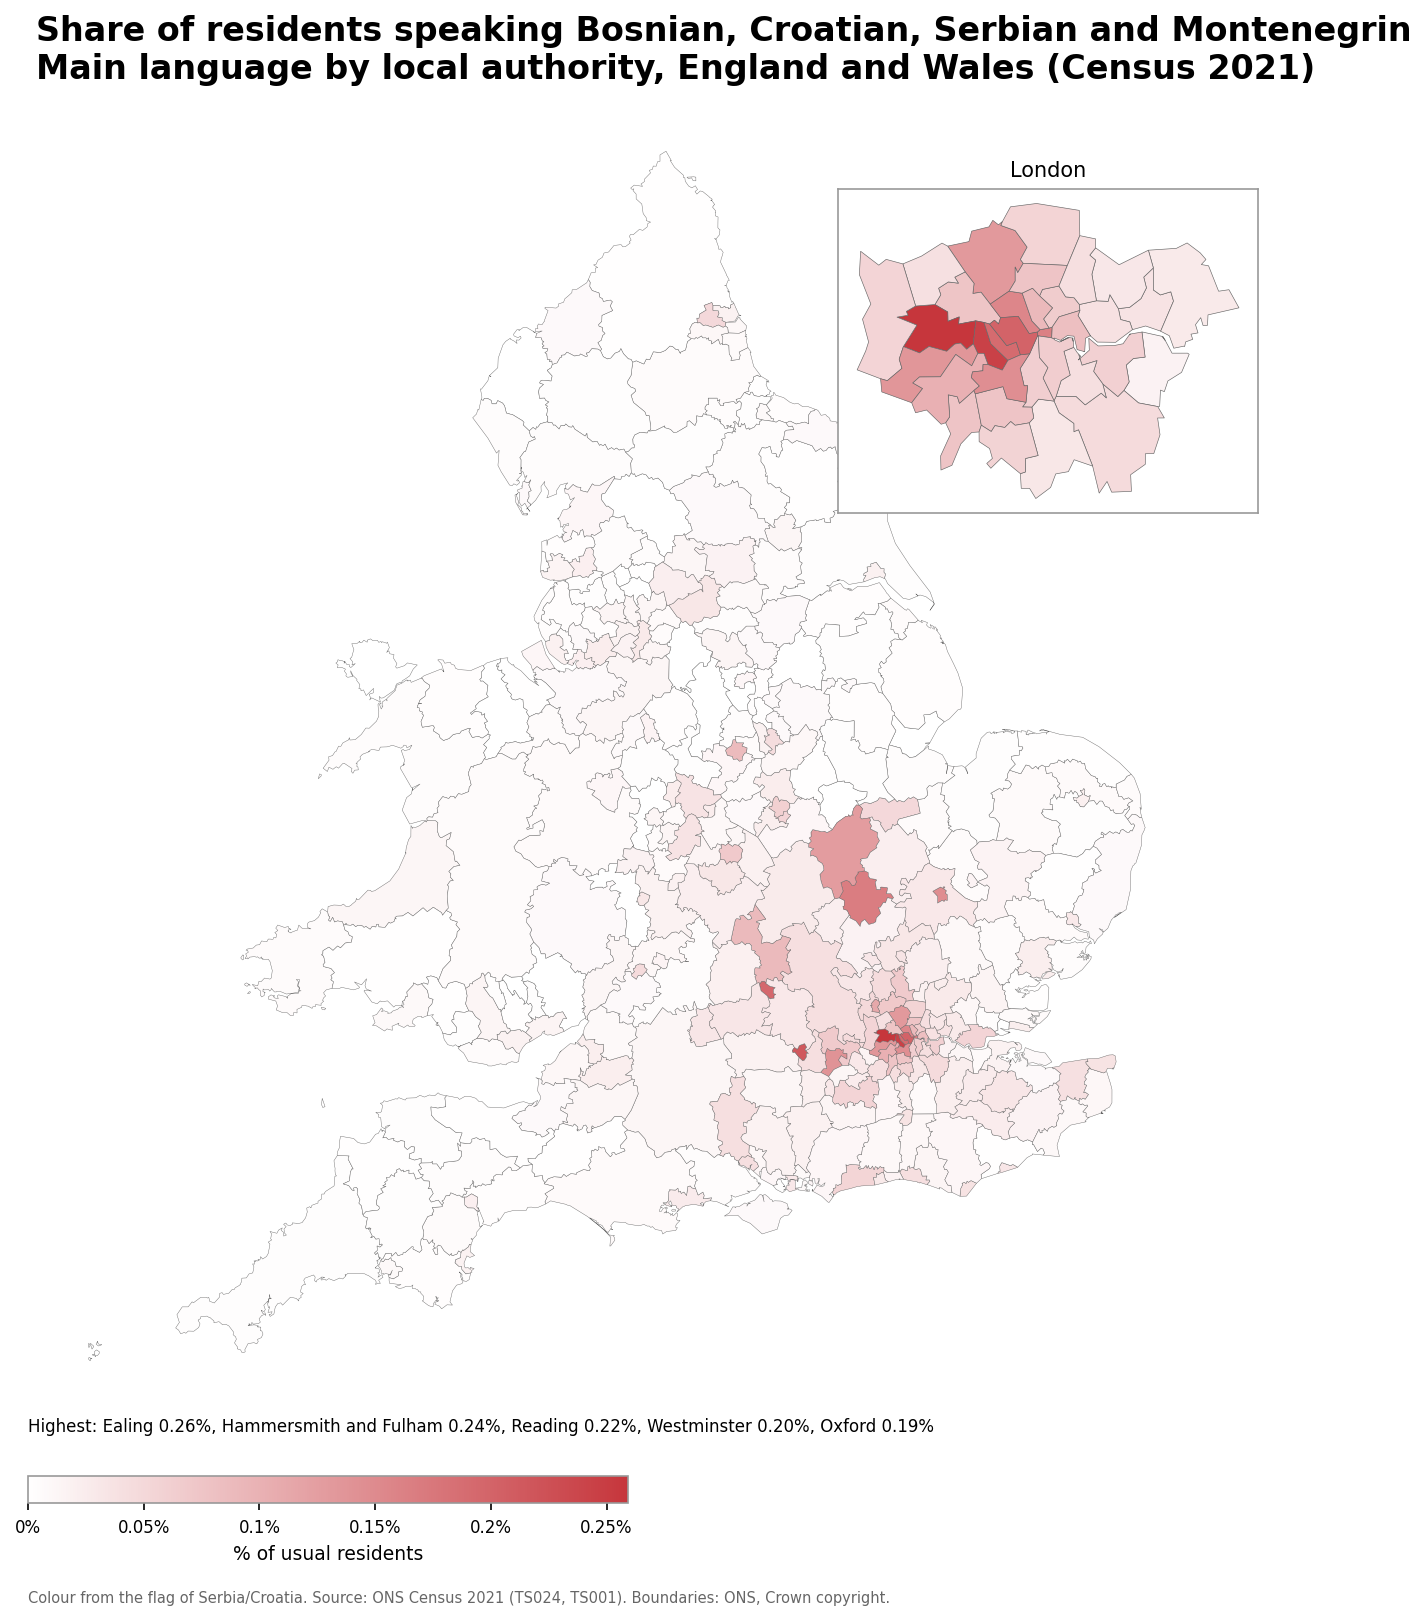
- Ealing: 0.26% (952 speakers)
- Hammersmith and Fulham: 0.24% (448 speakers)
- Reading: 0.22% (375 speakers)
- Westminster: 0.20% (411 speakers)
- Oxford: 0.19% (315 speakers)
Number of Albanian speakers
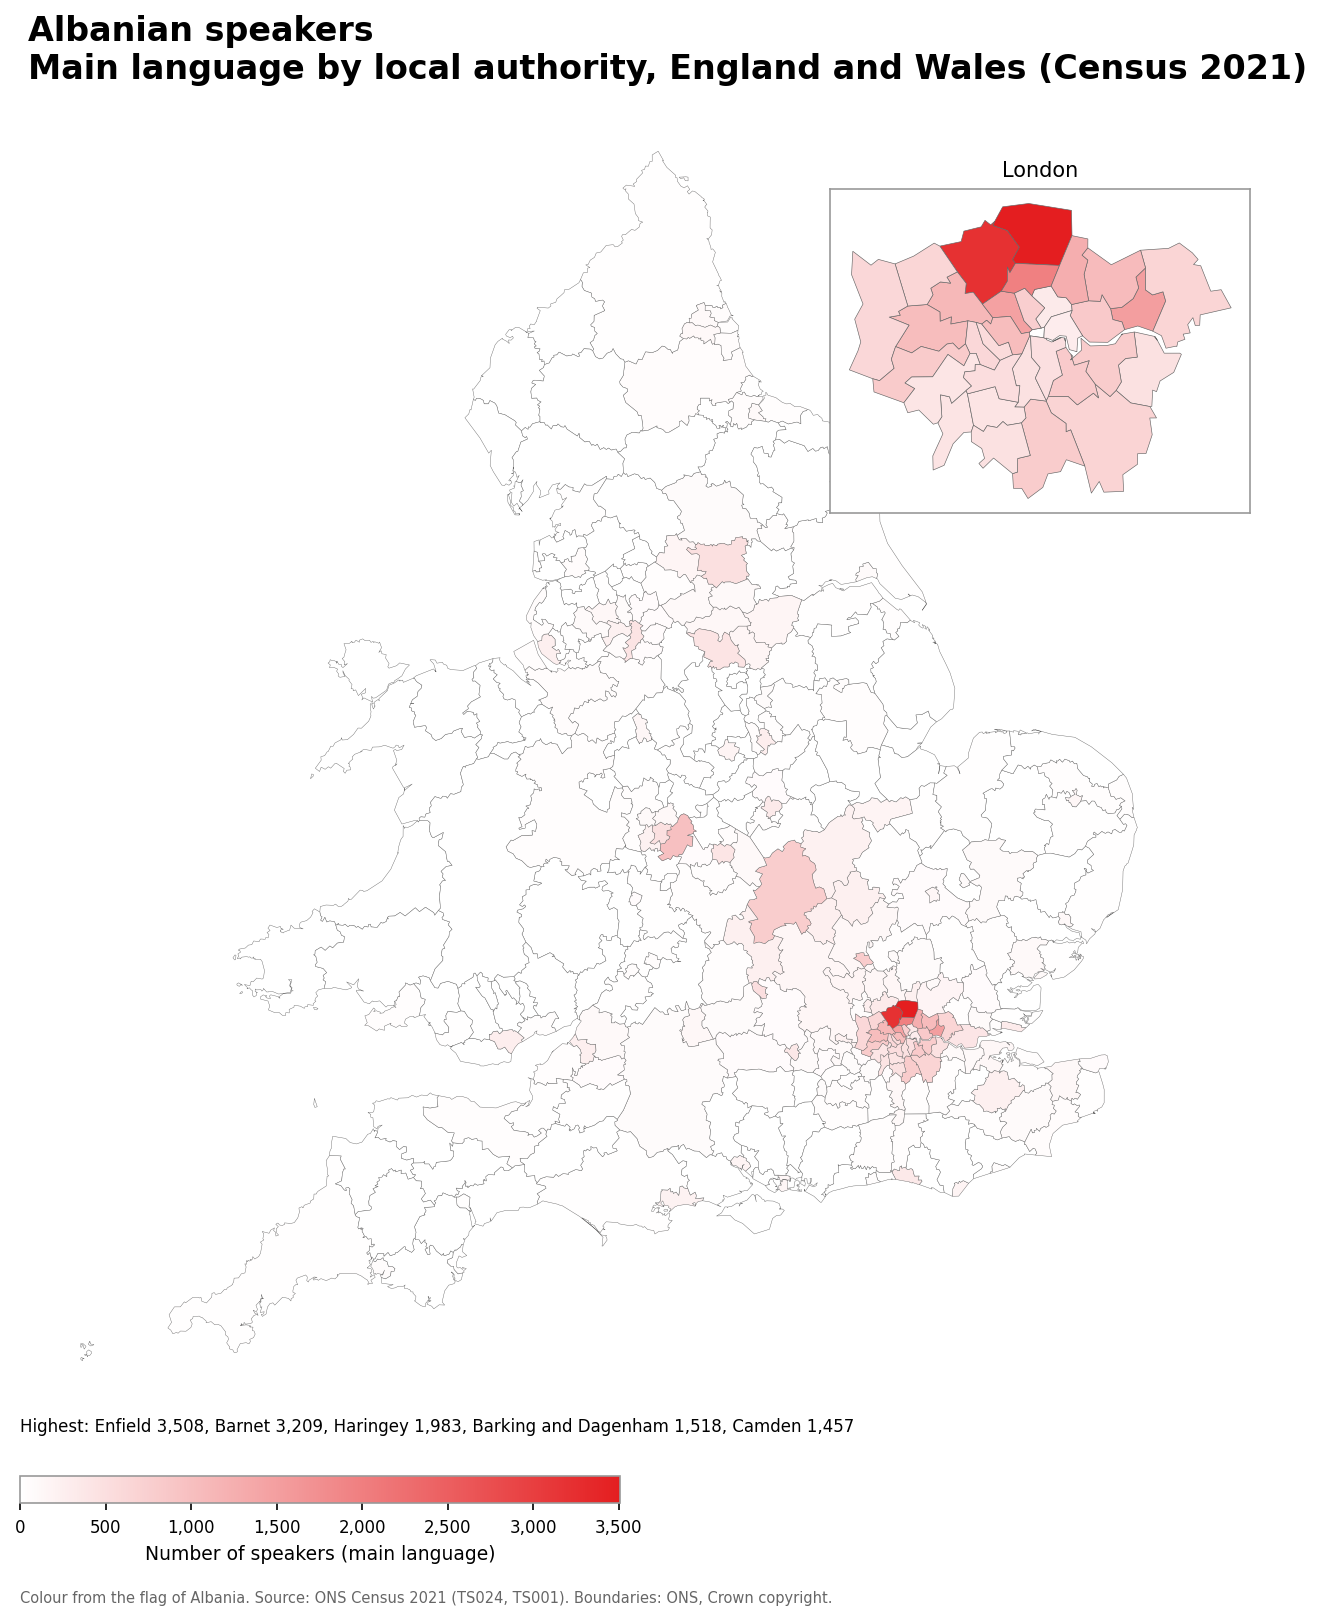
- Enfield: 3,508
- Barnet: 3,209
- Haringey: 1,983
- Barking and Dagenham: 1,518
- Camden: 1,457
Albanian speakers as a share of the population
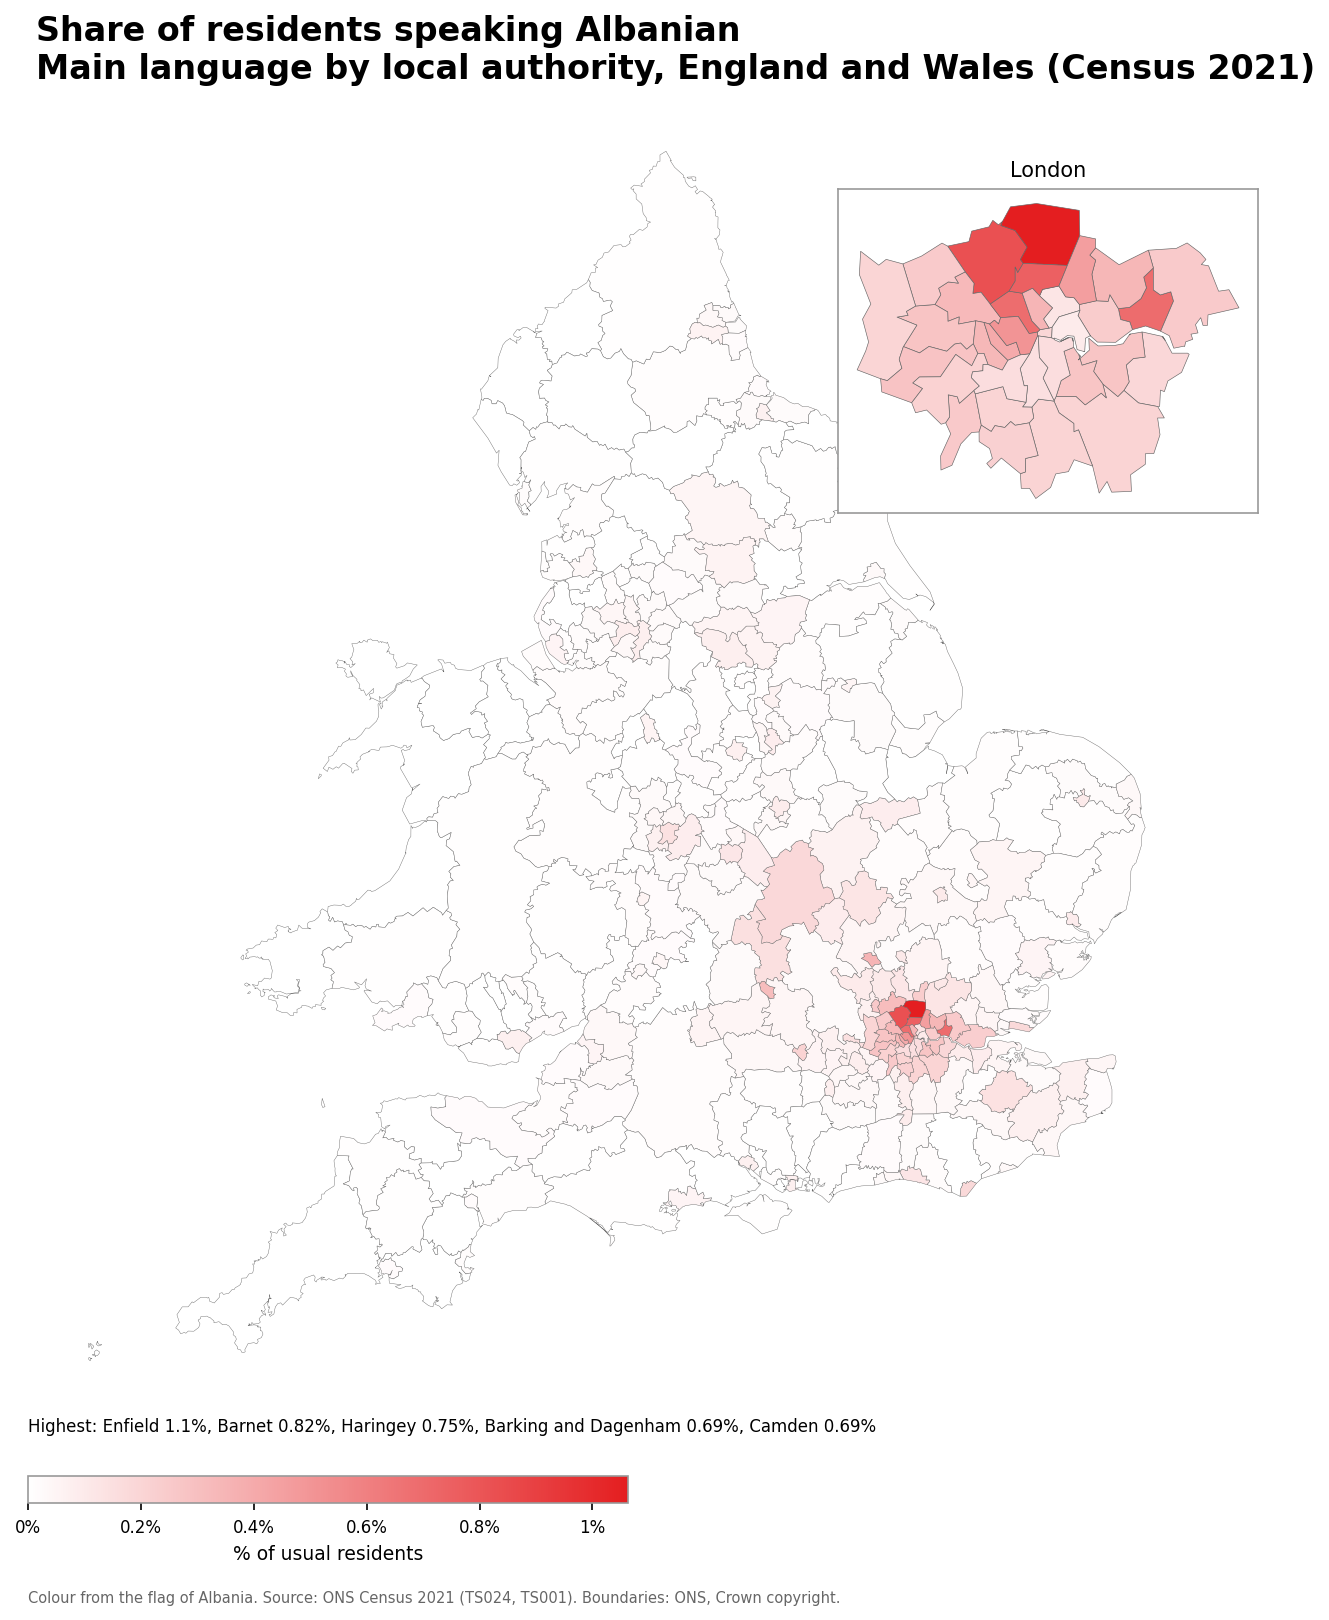
- Enfield: 1.1% (3,508 speakers)
- Barnet: 0.82% (3,209 speakers)
- Haringey: 0.75% (1,983 speakers)
- Barking and Dagenham: 0.69% (1,518 speakers)
- Camden: 0.69% (1,457 speakers)
Number of Ukrainian speakers
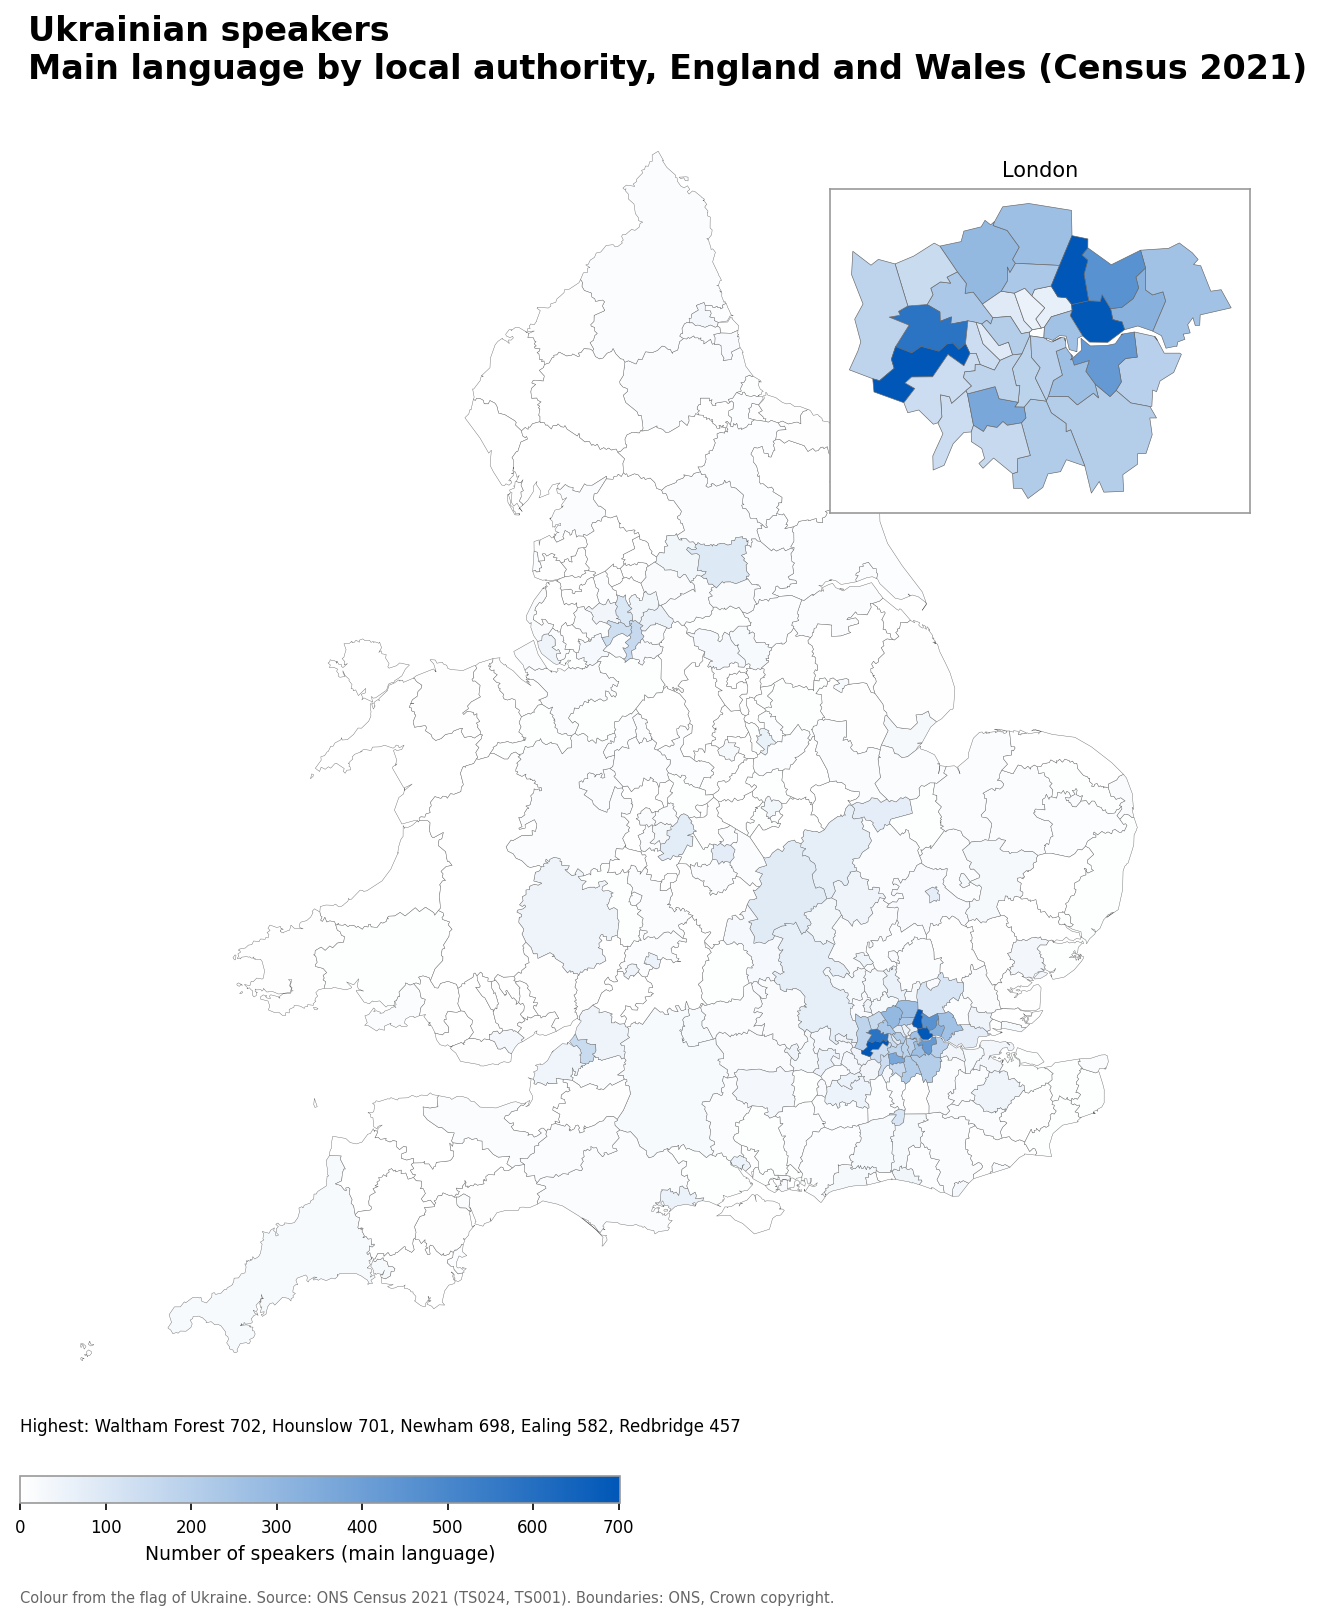
- Waltham Forest: 702
- Hounslow: 701
- Newham: 698
- Ealing: 582
- Redbridge: 457
Ukrainian speakers as a share of the population
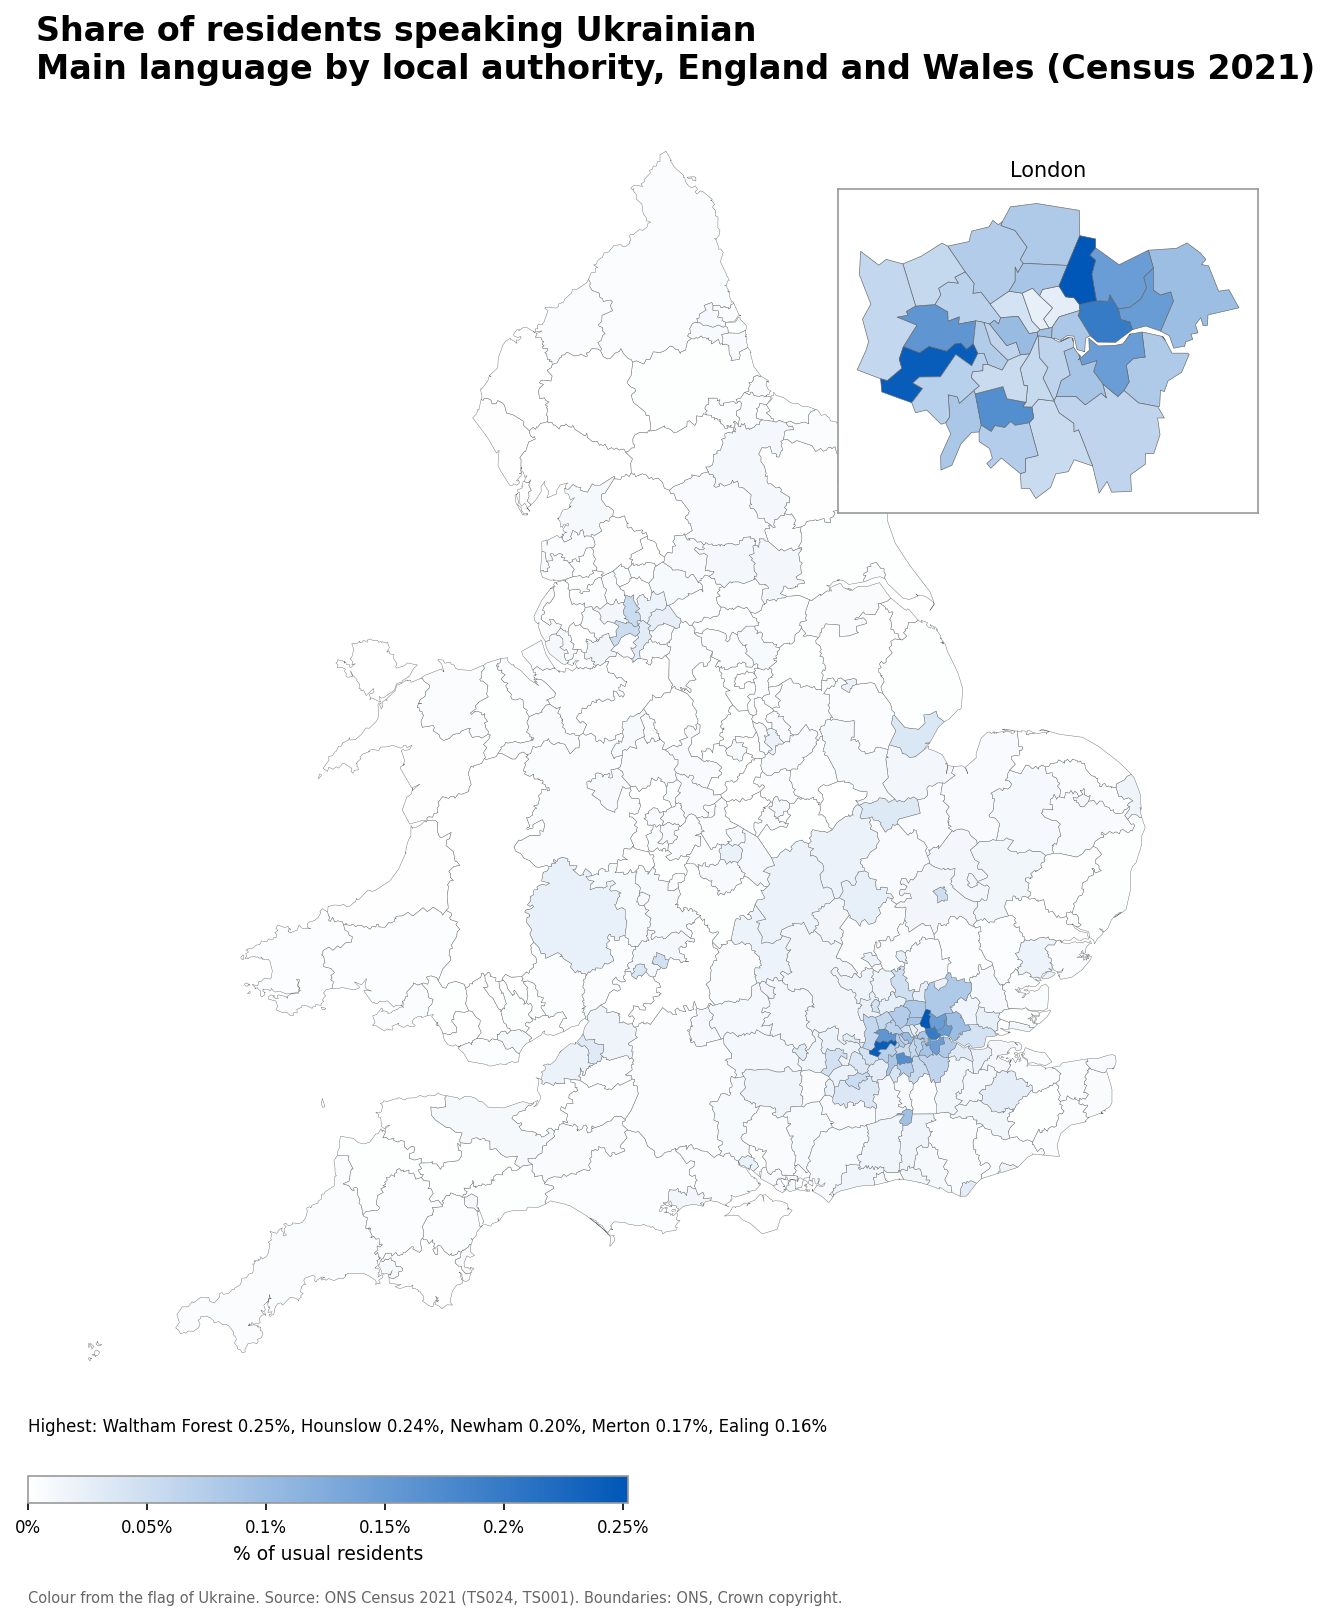
- Waltham Forest: 0.25% (702 speakers)
- Hounslow: 0.24% (701 speakers)
- Newham: 0.20% (698 speakers)
- Merton: 0.17% (366 speakers)
- Ealing: 0.16% (582 speakers)
Number of Russian speakers
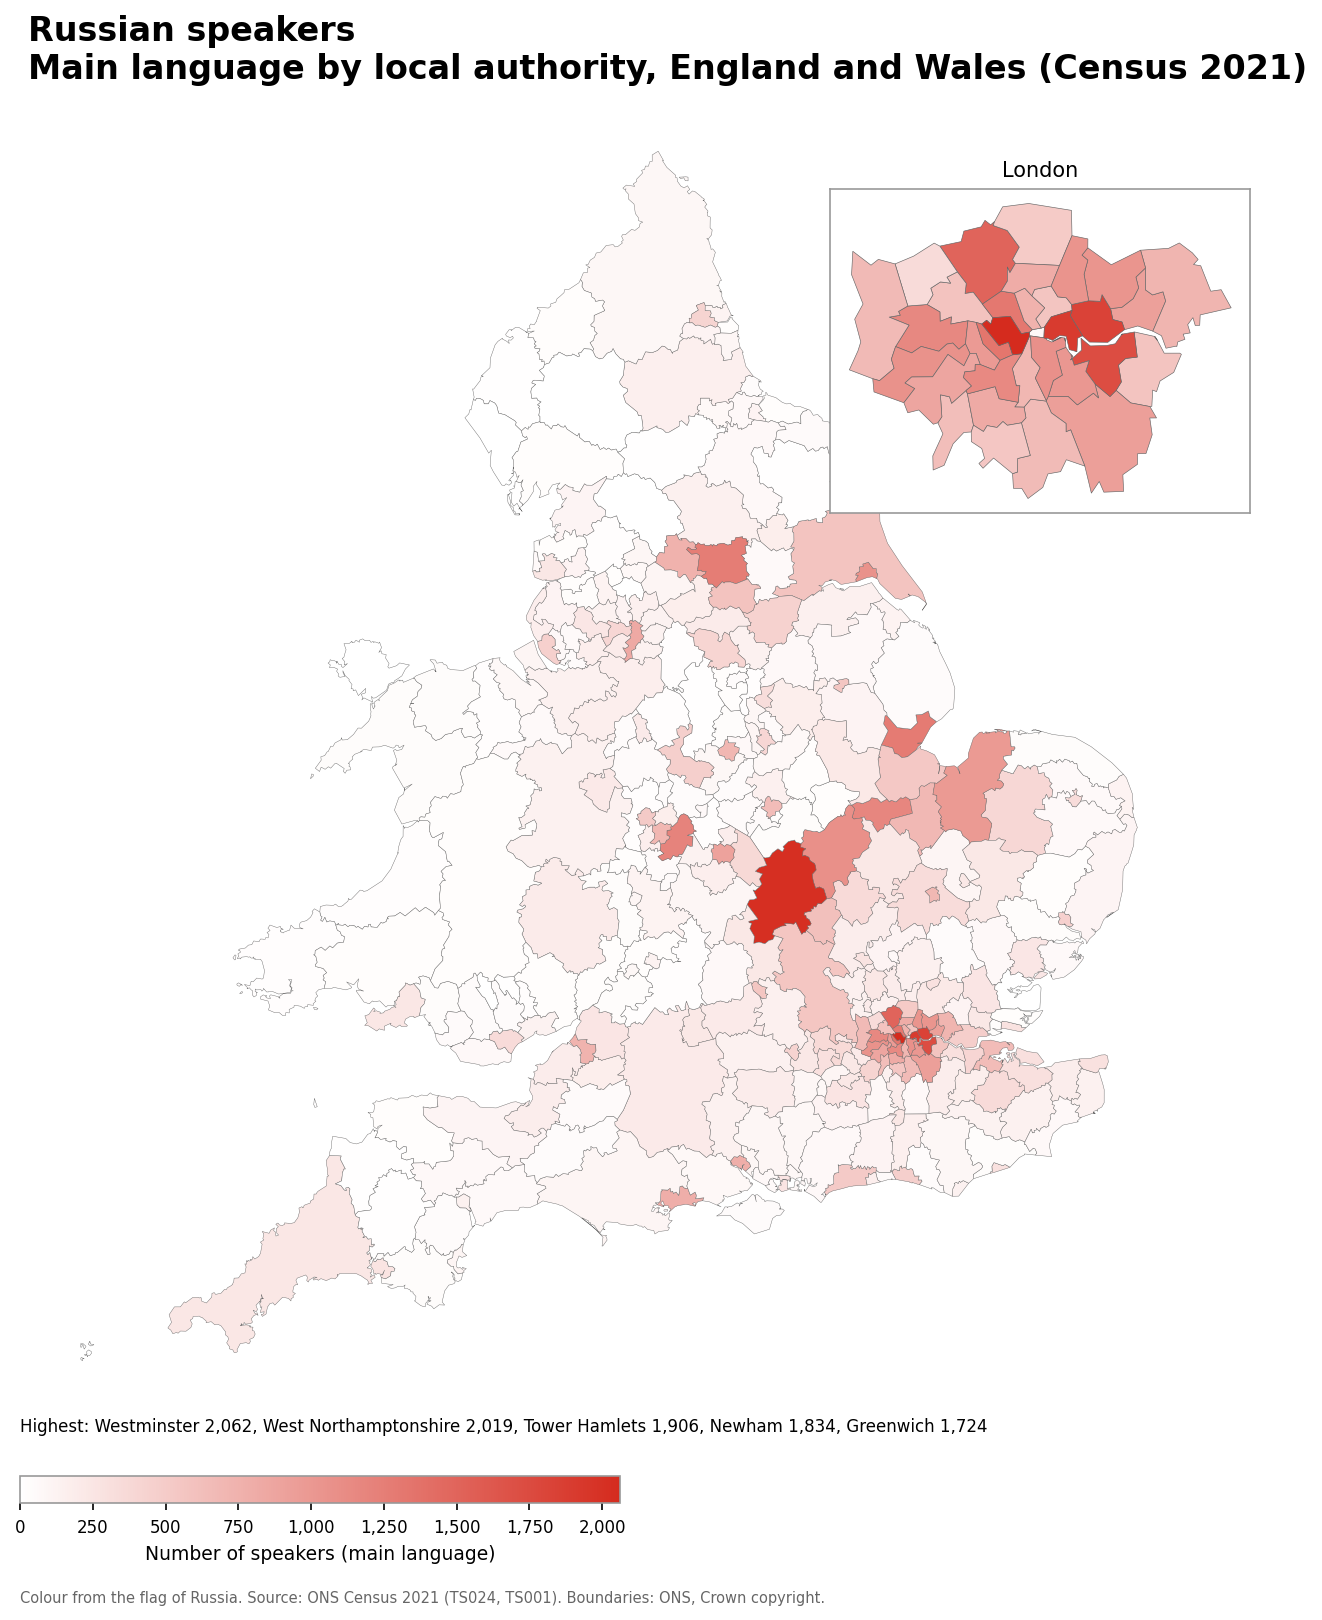
- Westminster: 2,062
- West Northamptonshire: 2,019
- Tower Hamlets: 1,906
- Newham: 1,834
- Greenwich: 1,724
Russian speakers as a share of the population
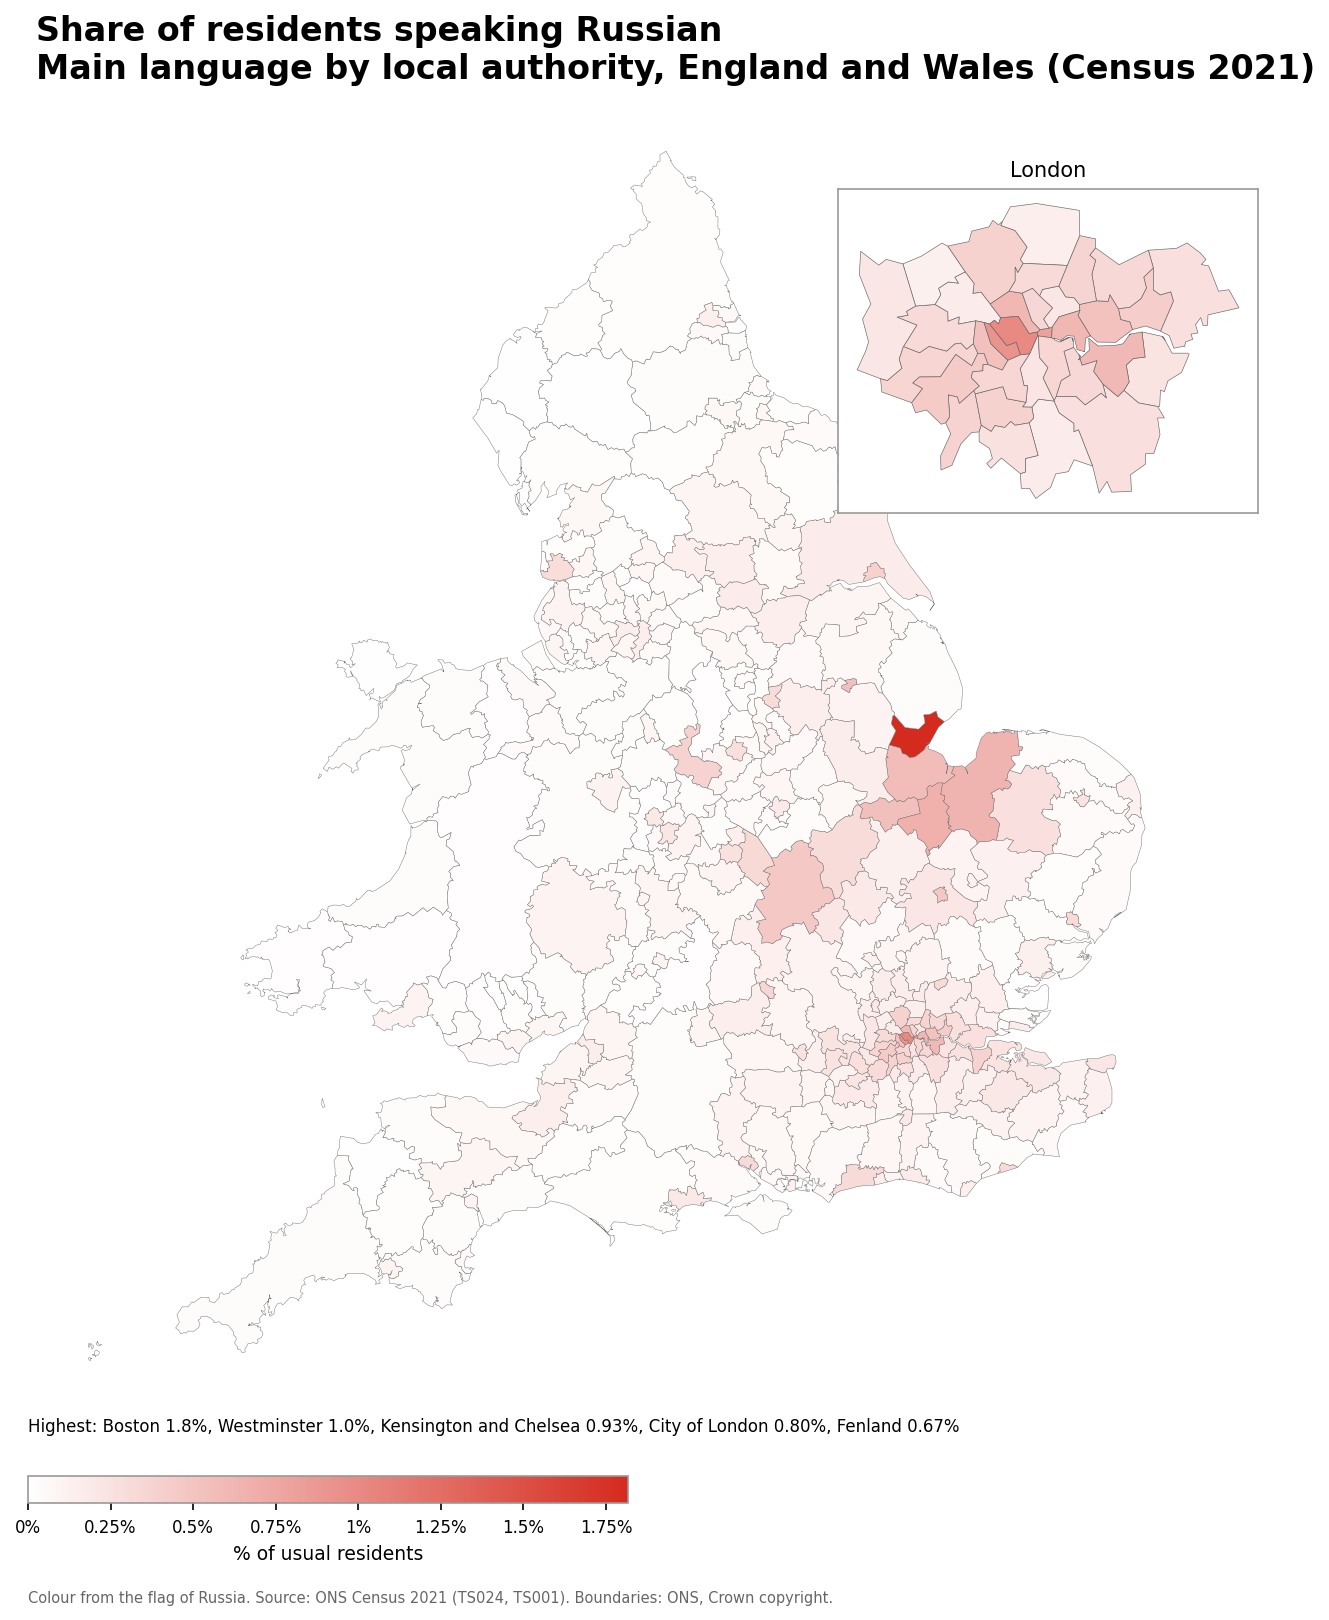
- Boston: 1.8% (1,281 speakers)
- Westminster: 1.0% (2,062 speakers)
- Kensington and Chelsea: 0.93% (1,332 speakers)
- City of London: 0.80% (69 speakers)
- Fenland: 0.67% (690 speakers)
Number of Romani speakers
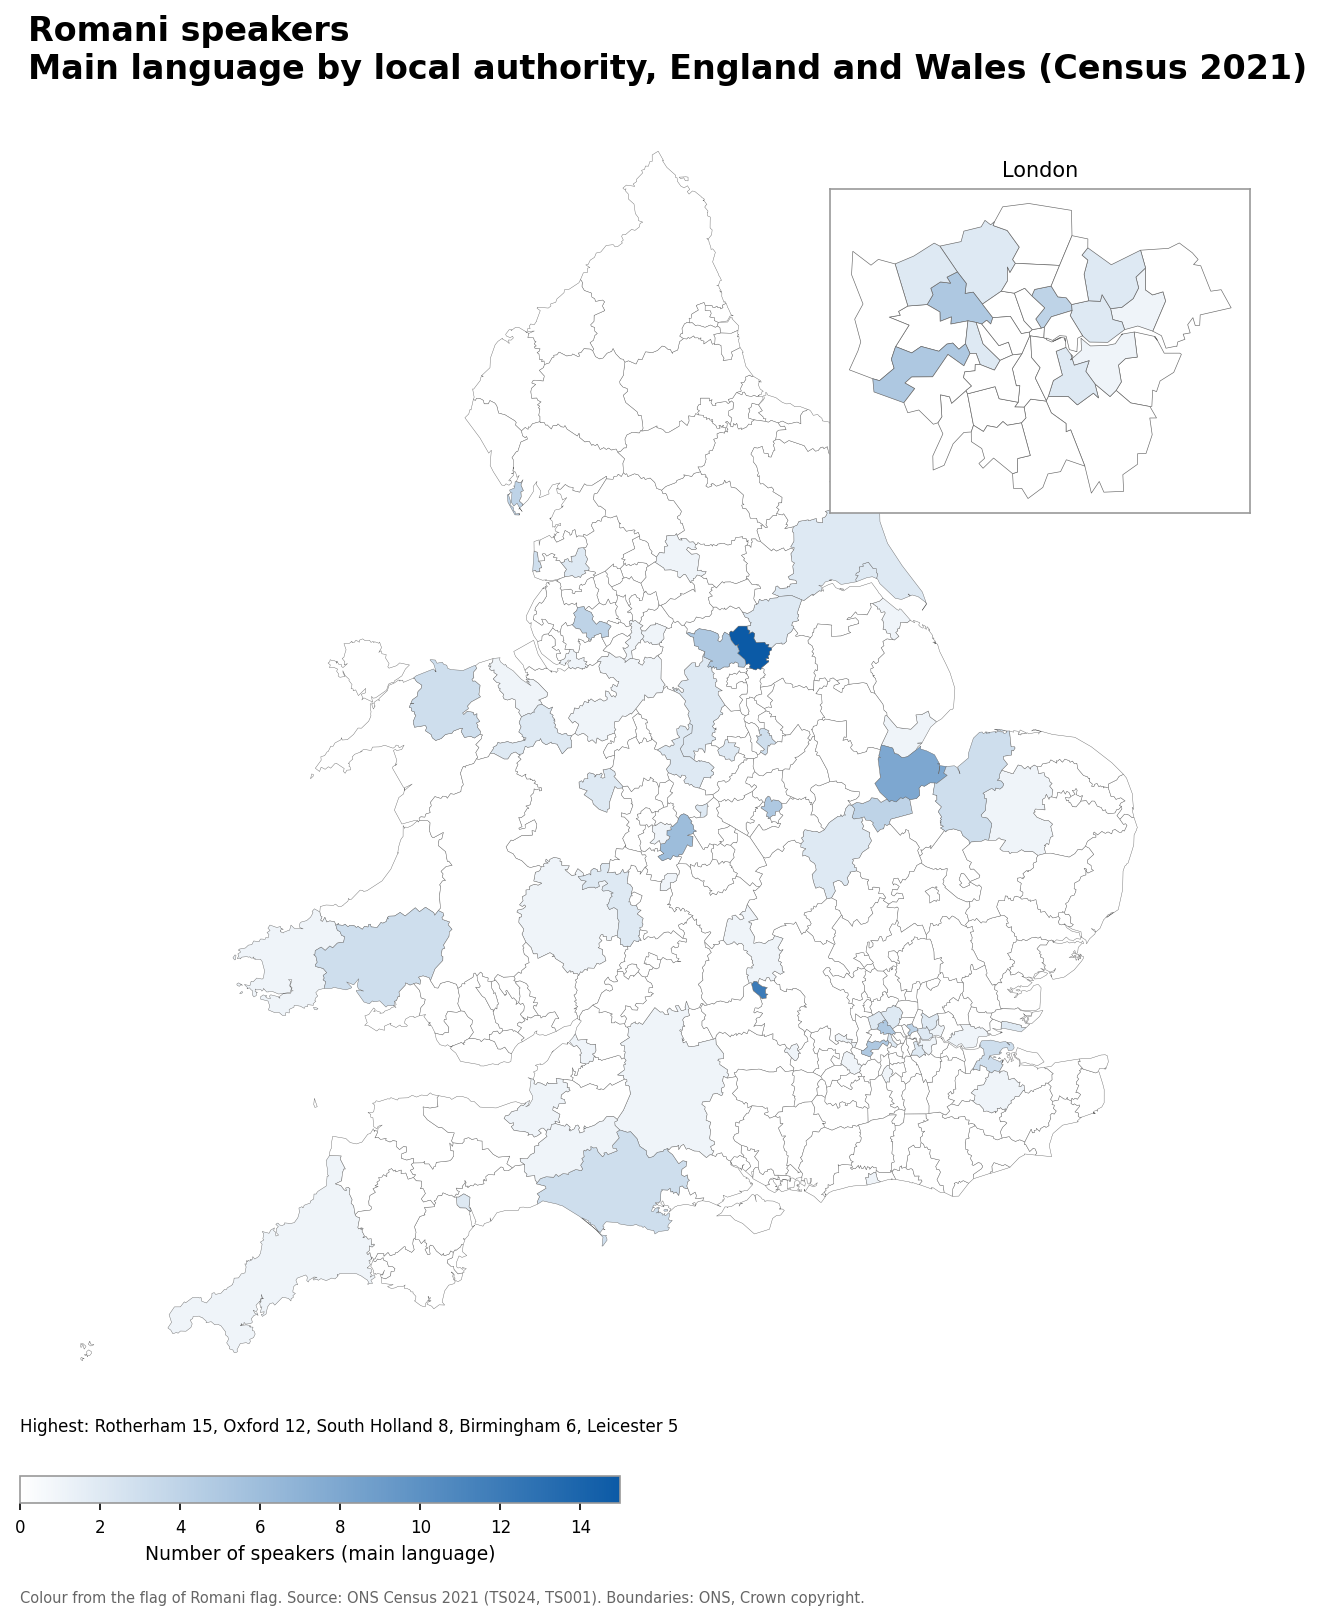
- Rotherham: 15
- Oxford: 12
- South Holland: 8
- Birmingham: 6
- Brent: 5
Romani speakers as a share of the population
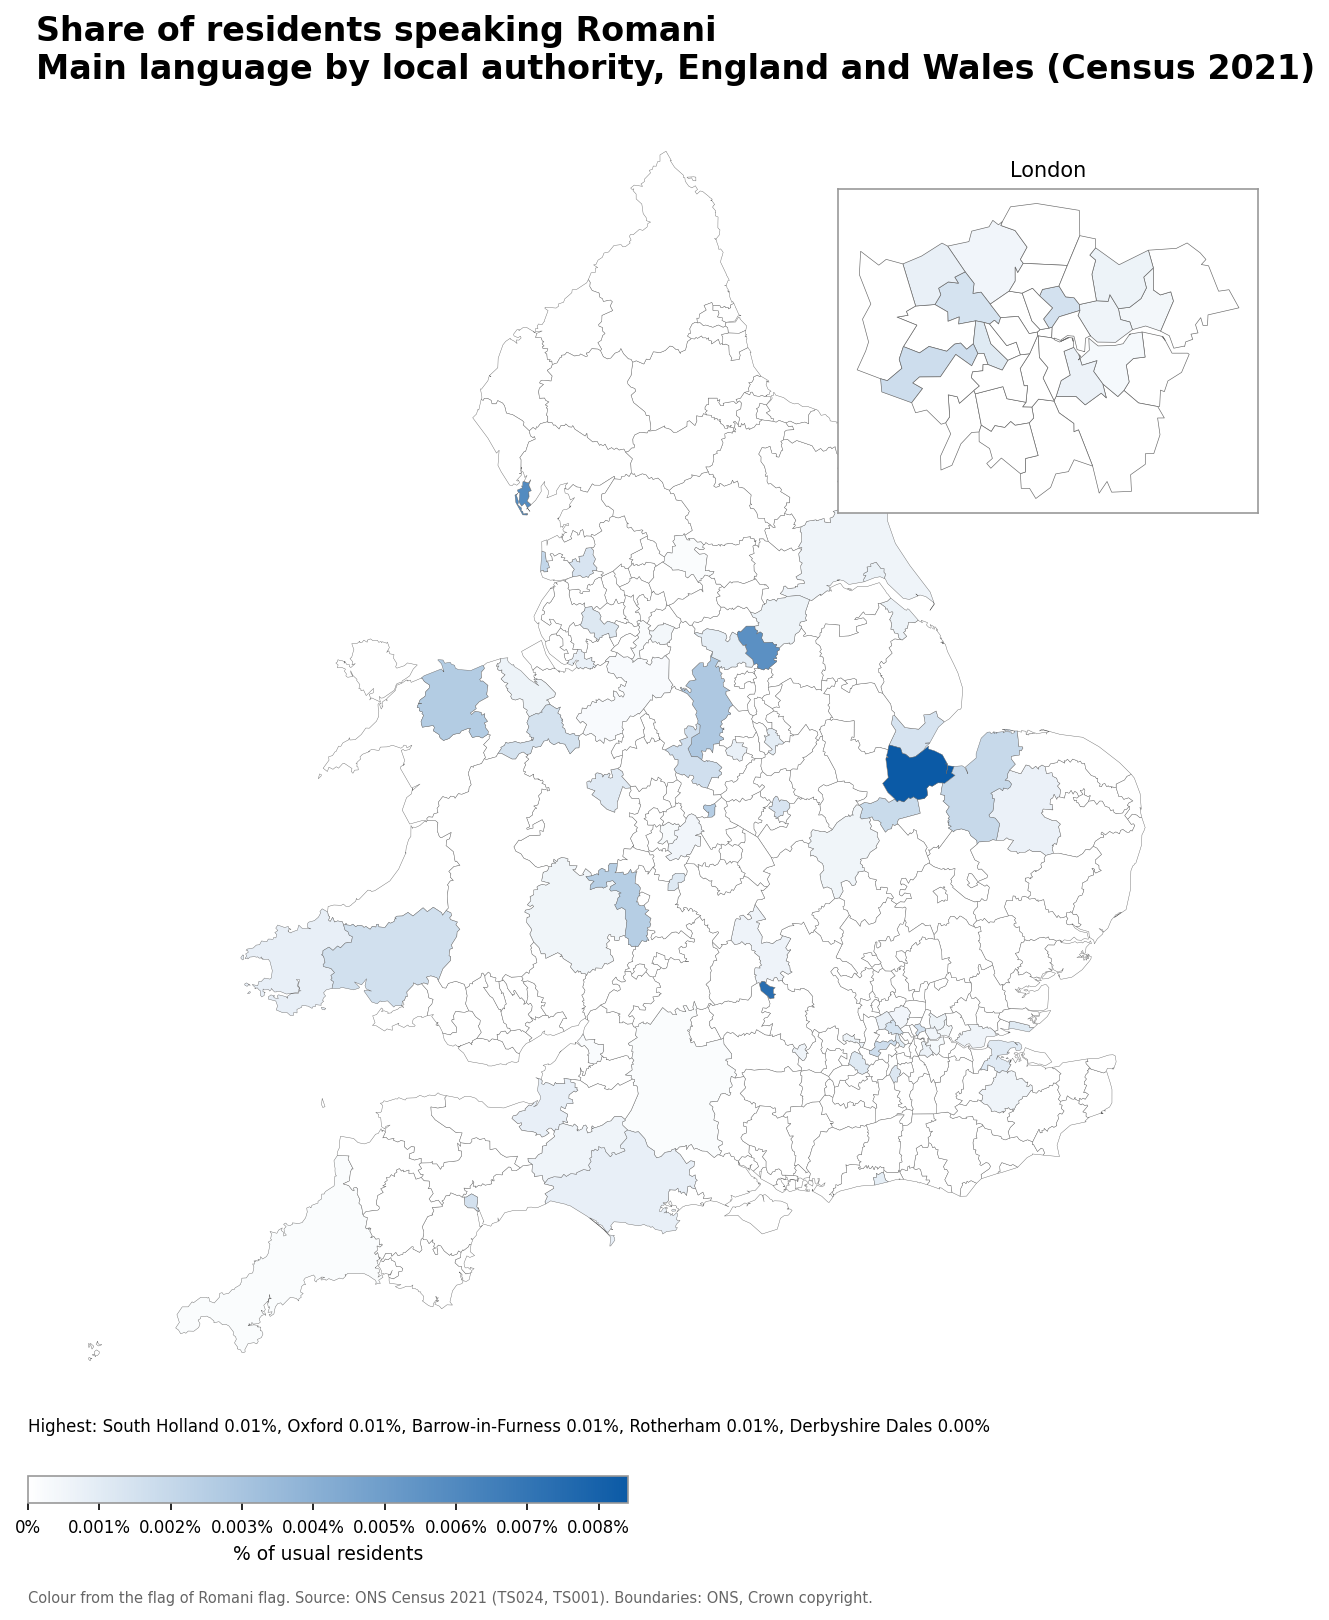
- South Holland: 0.01% (8 speakers)
- Oxford: 0.01% (12 speakers)
- Barrow-in-Furness: 0.01% (4 speakers)
- Rotherham: 0.01% (15 speakers)
- Derbyshire Dales: 0.00% (2 speakers)
Number of Yiddish speakers
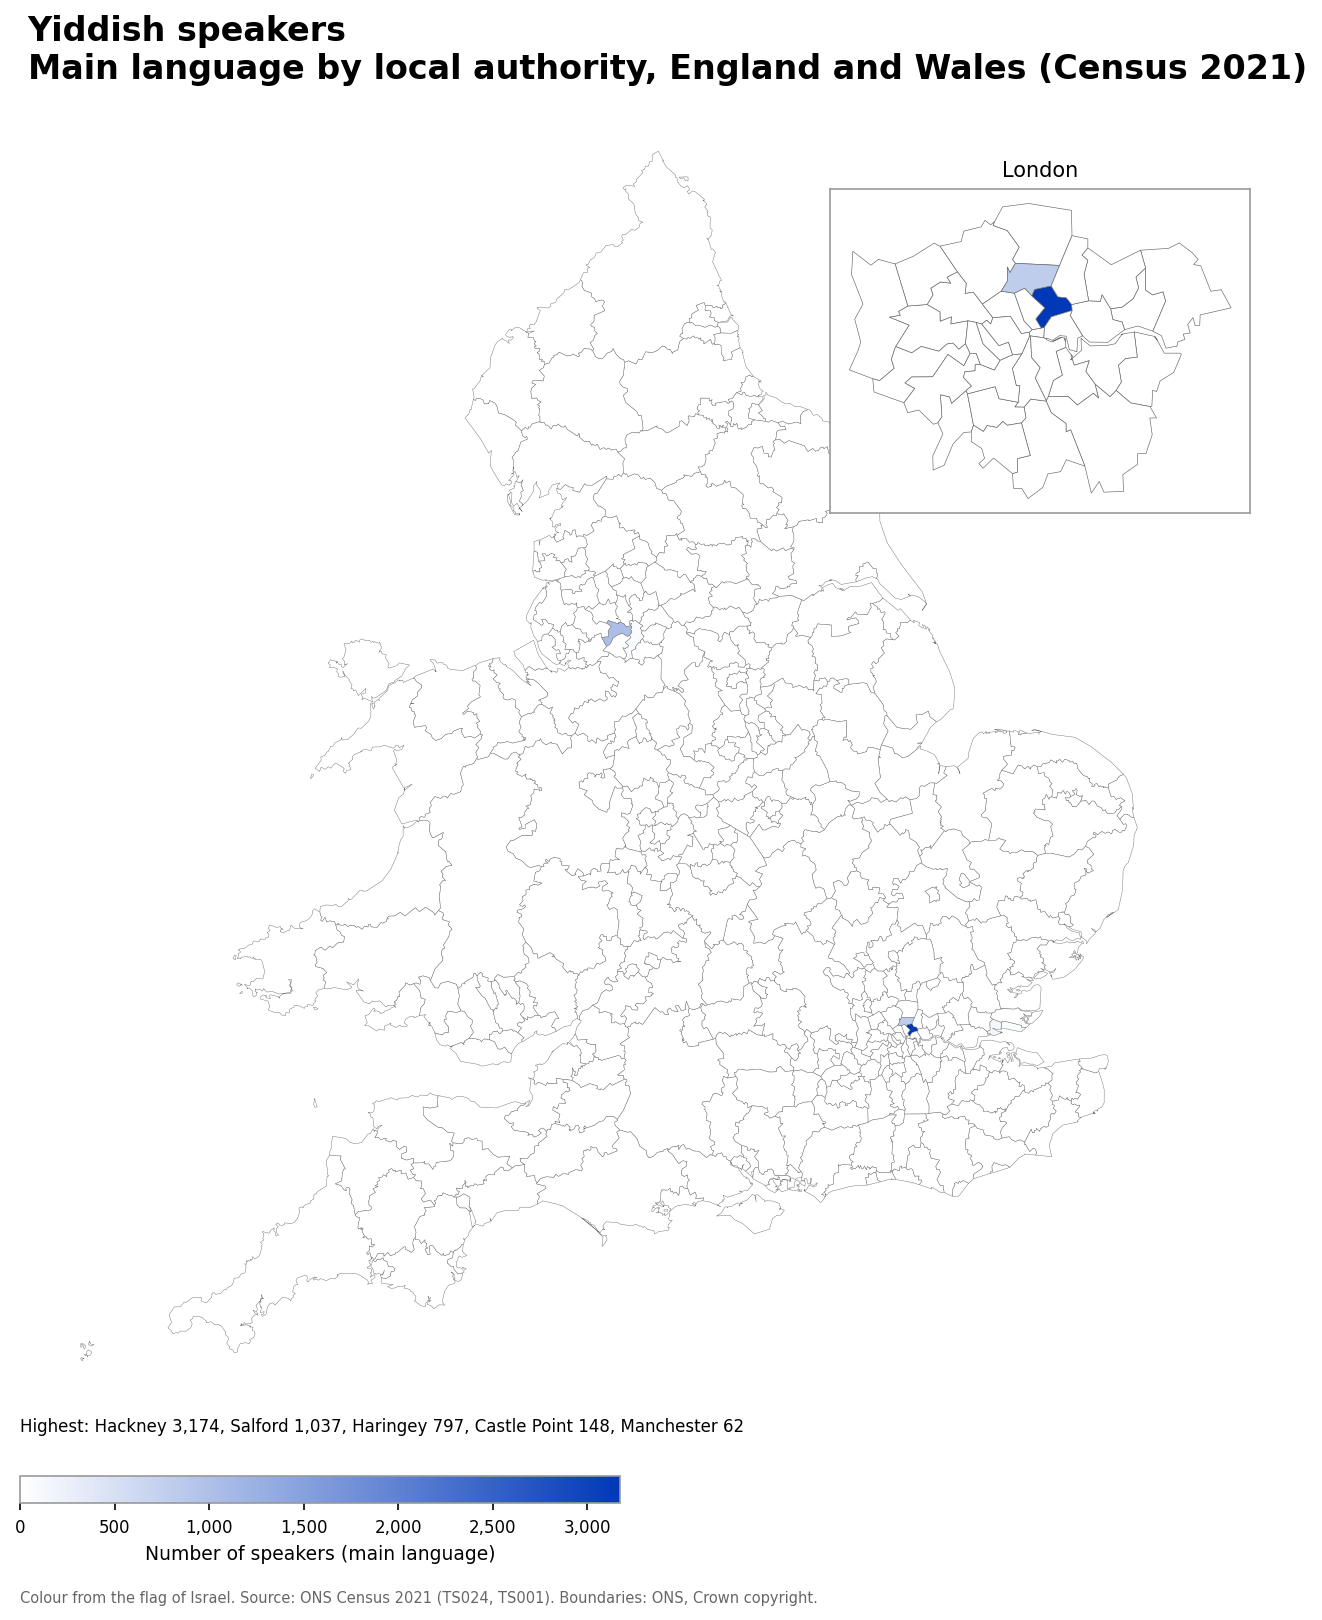
- Hackney: 3,174
- Salford: 1,037
- Haringey: 797
- Castle Point: 148
- Manchester: 62
Yiddish speakers as a share of the population
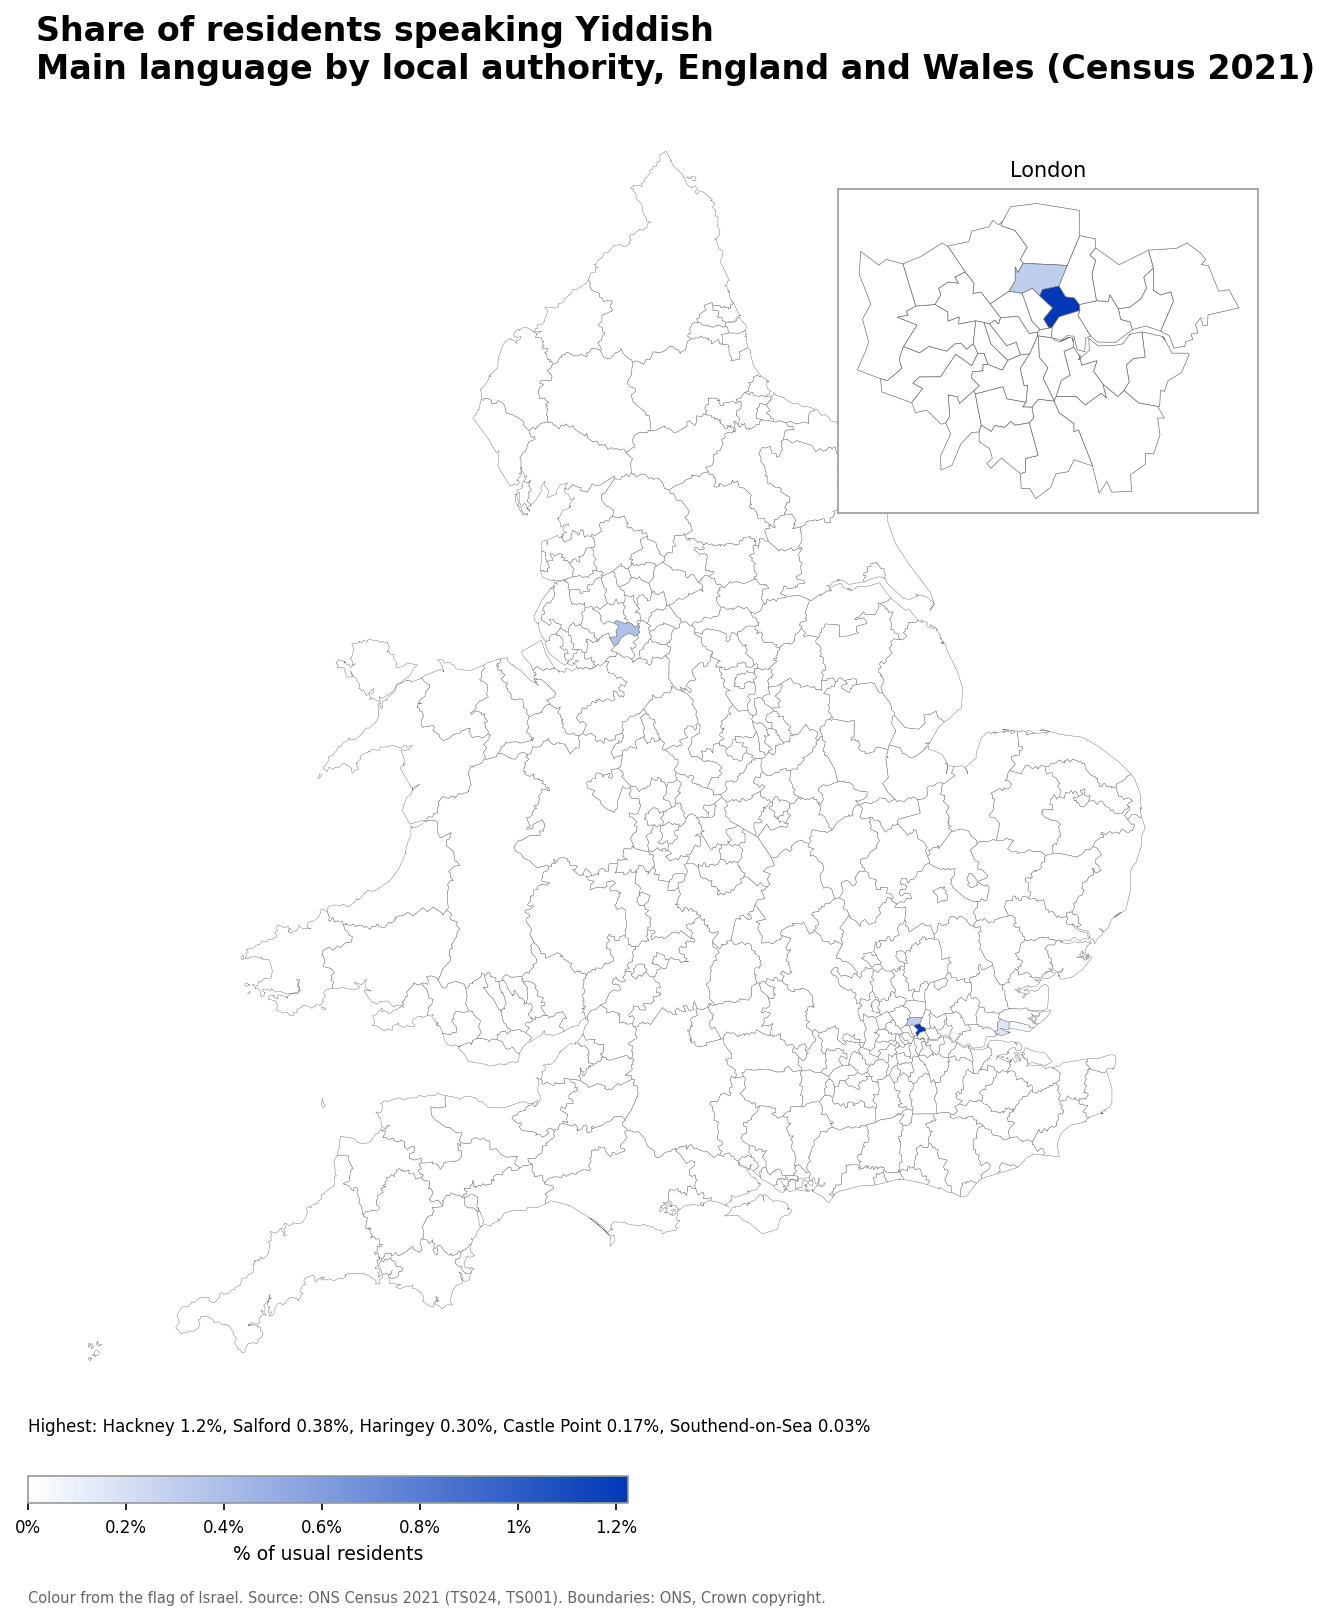
- Hackney: 1.2% (3,174 speakers)
- Salford: 0.38% (1,037 speakers)
- Haringey: 0.30% (797 speakers)
- Castle Point: 0.17% (148 speakers)
- Southend-on-Sea: 0.03% (56 speakers)
Number of Turkish speakers
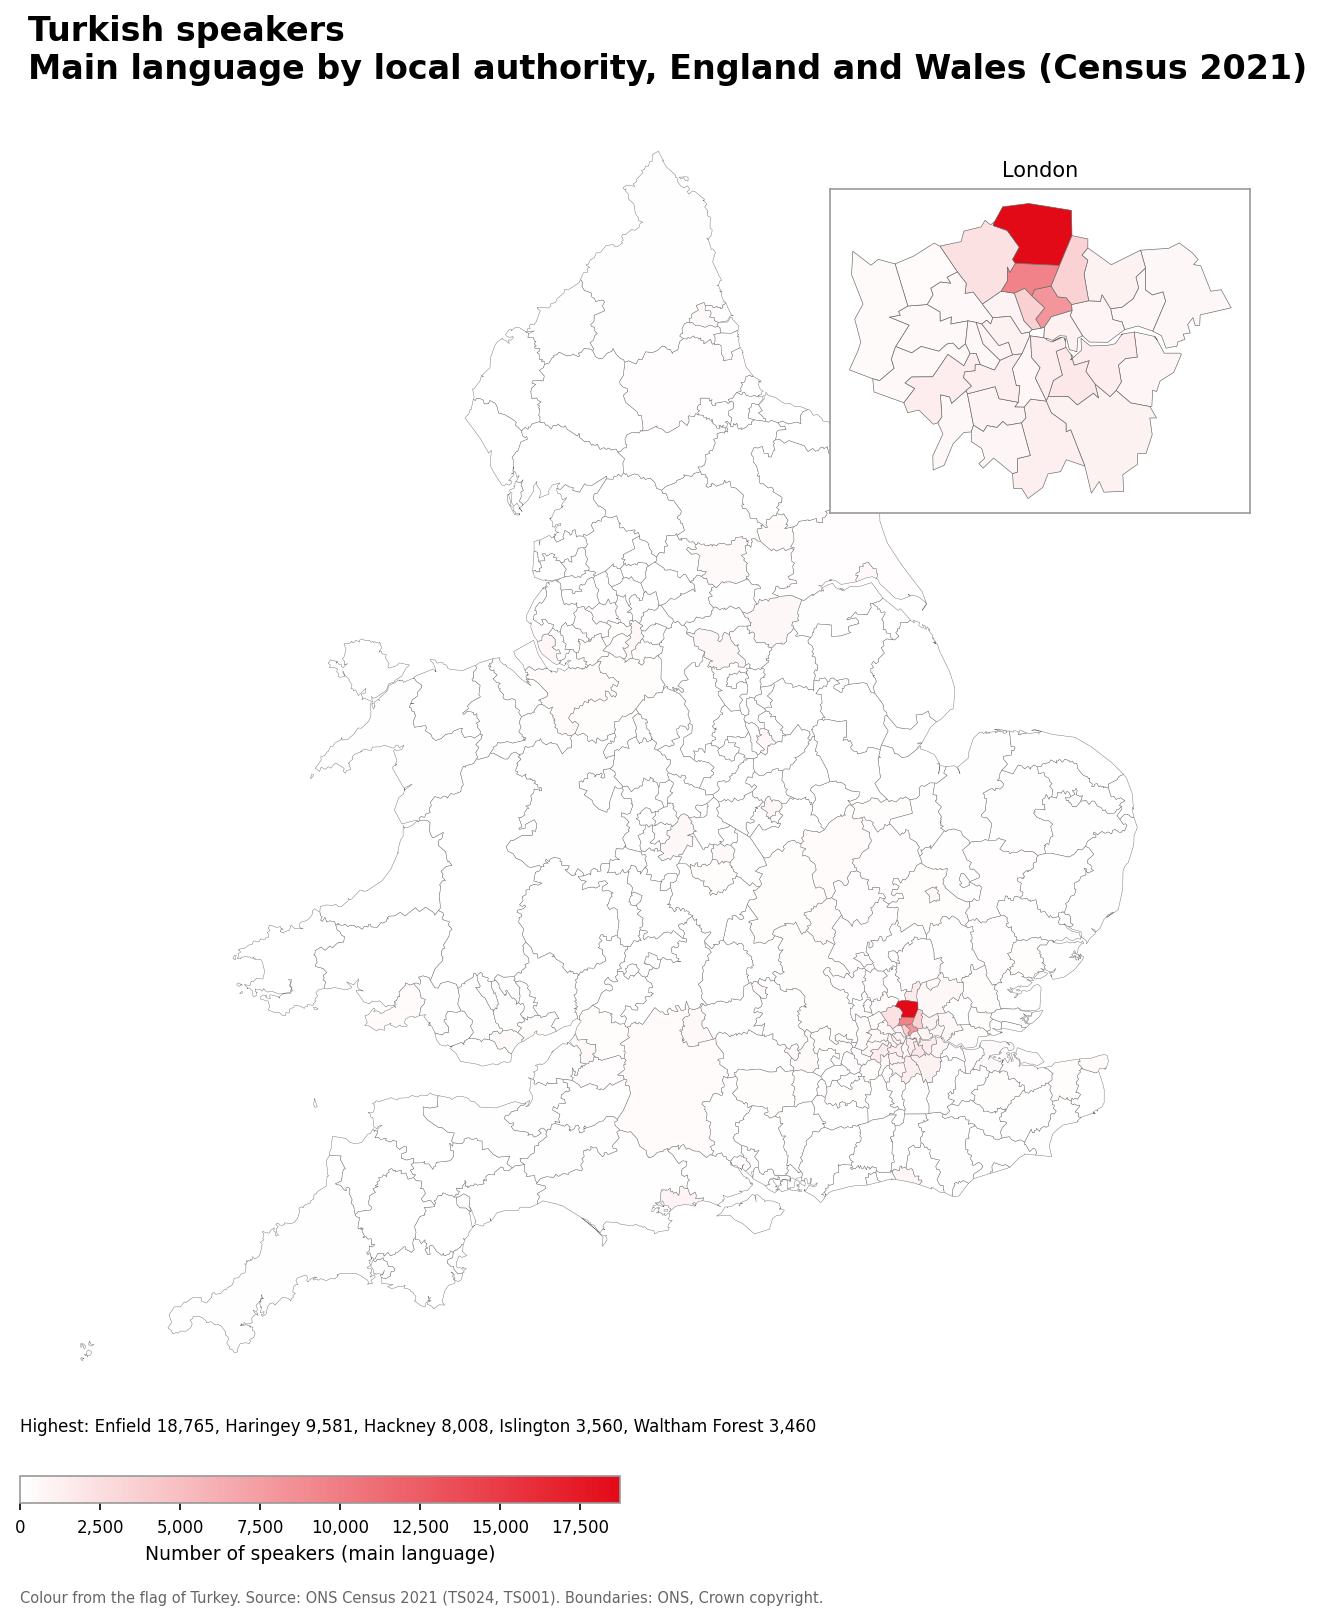
- Enfield: 18,765
- Haringey: 9,581
- Hackney: 8,008
- Islington: 3,560
- Waltham Forest: 3,460
Turkish speakers as a share of the population
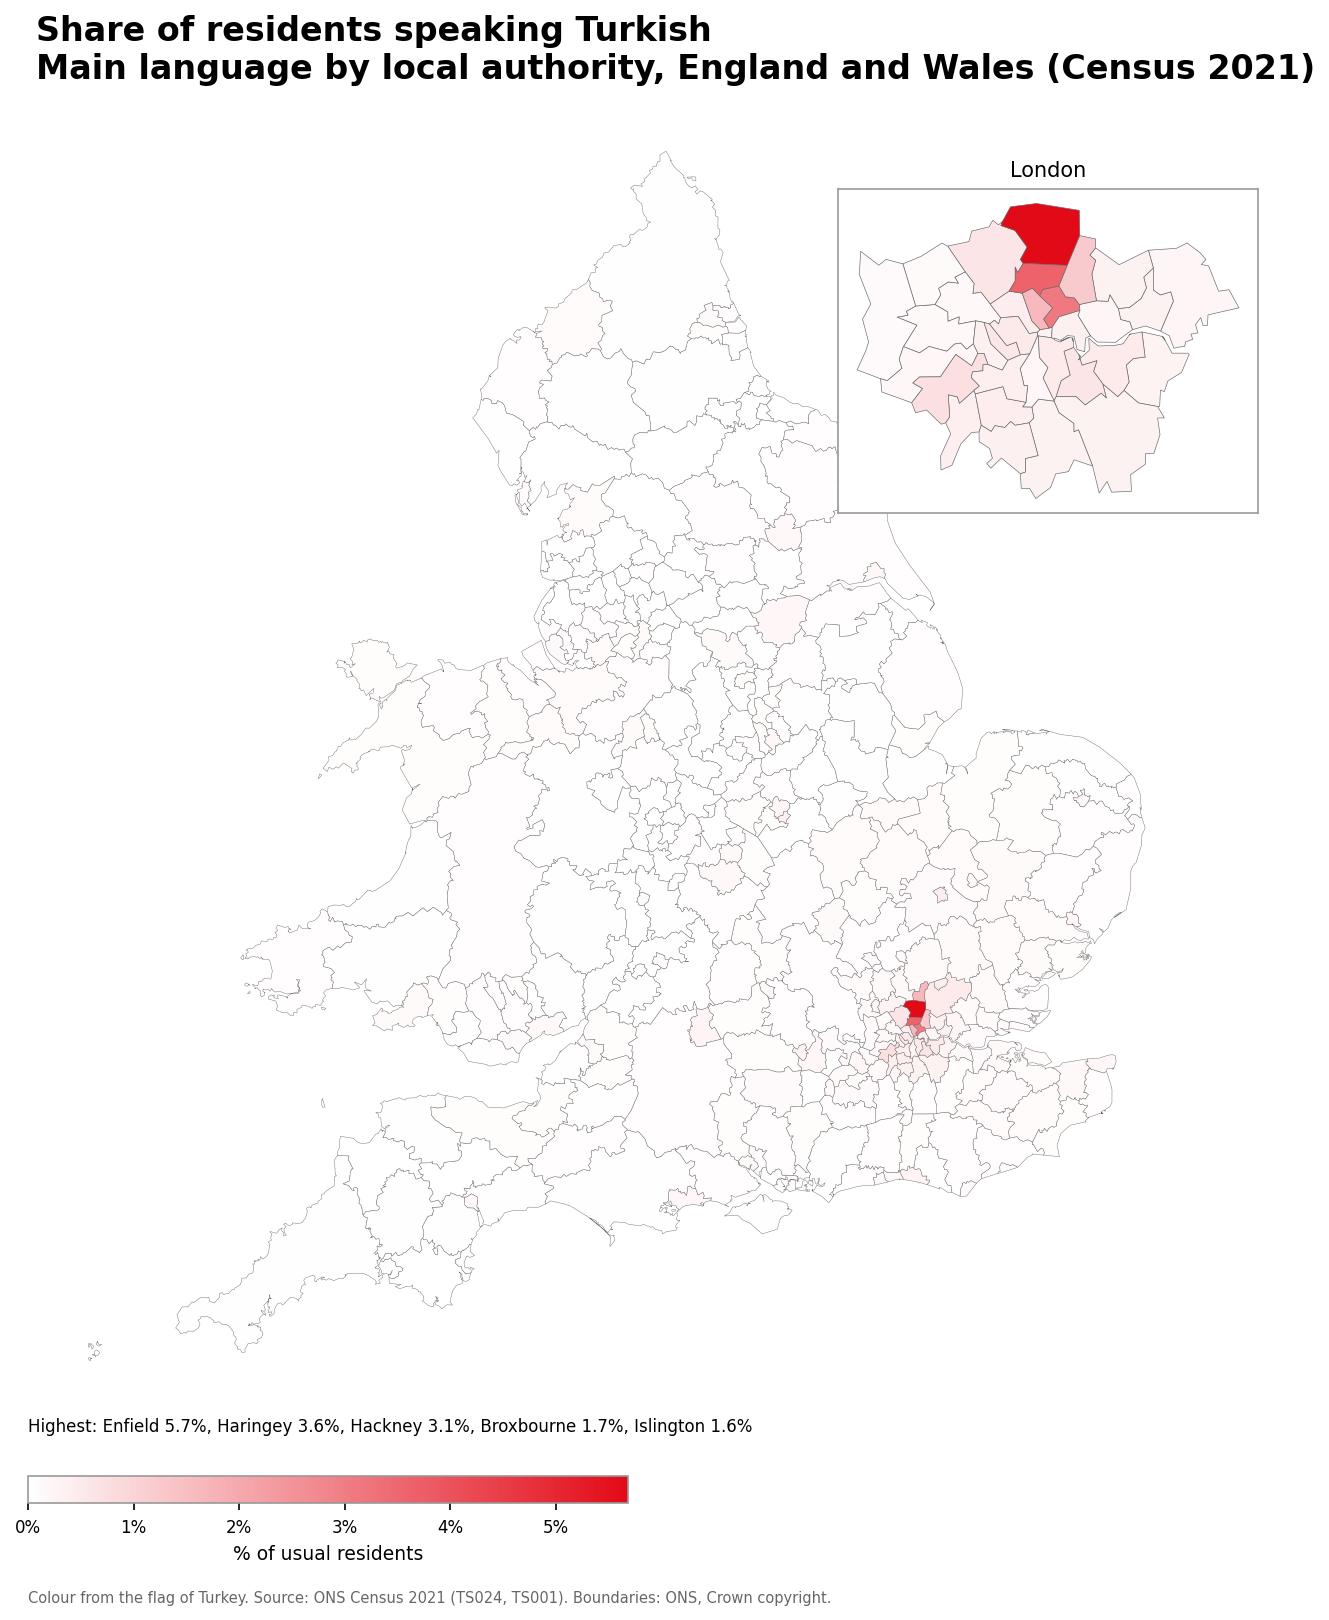
- Enfield: 5.7% (18,765 speakers)
- Haringey: 3.6% (9,581 speakers)
- Hackney: 3.1% (8,008 speakers)
- Broxbourne: 1.7% (1,649 speakers)
- Islington: 1.6% (3,560 speakers)
Number of Arabic speakers
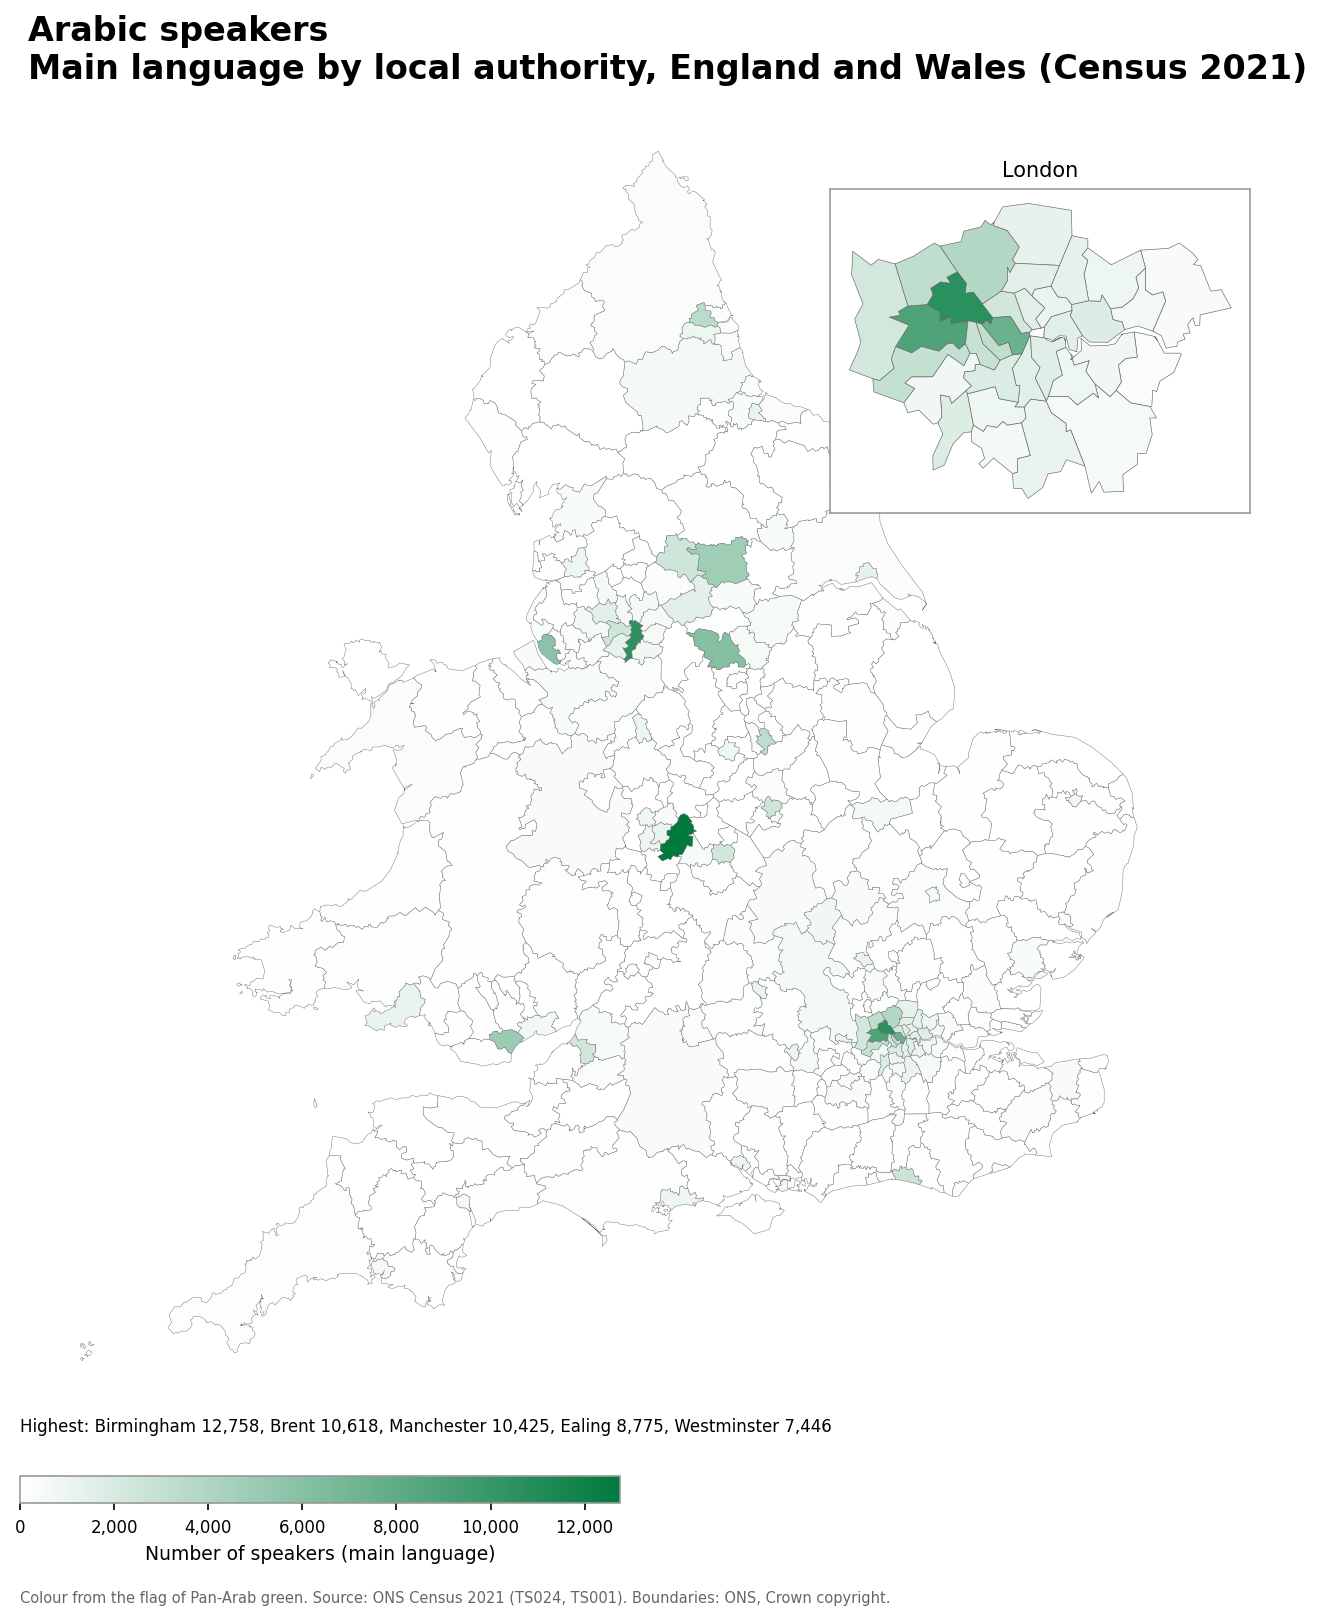
- Birmingham: 12,758
- Brent: 10,618
- Manchester: 10,425
- Ealing: 8,775
- Westminster: 7,446
Arabic speakers as a share of the population
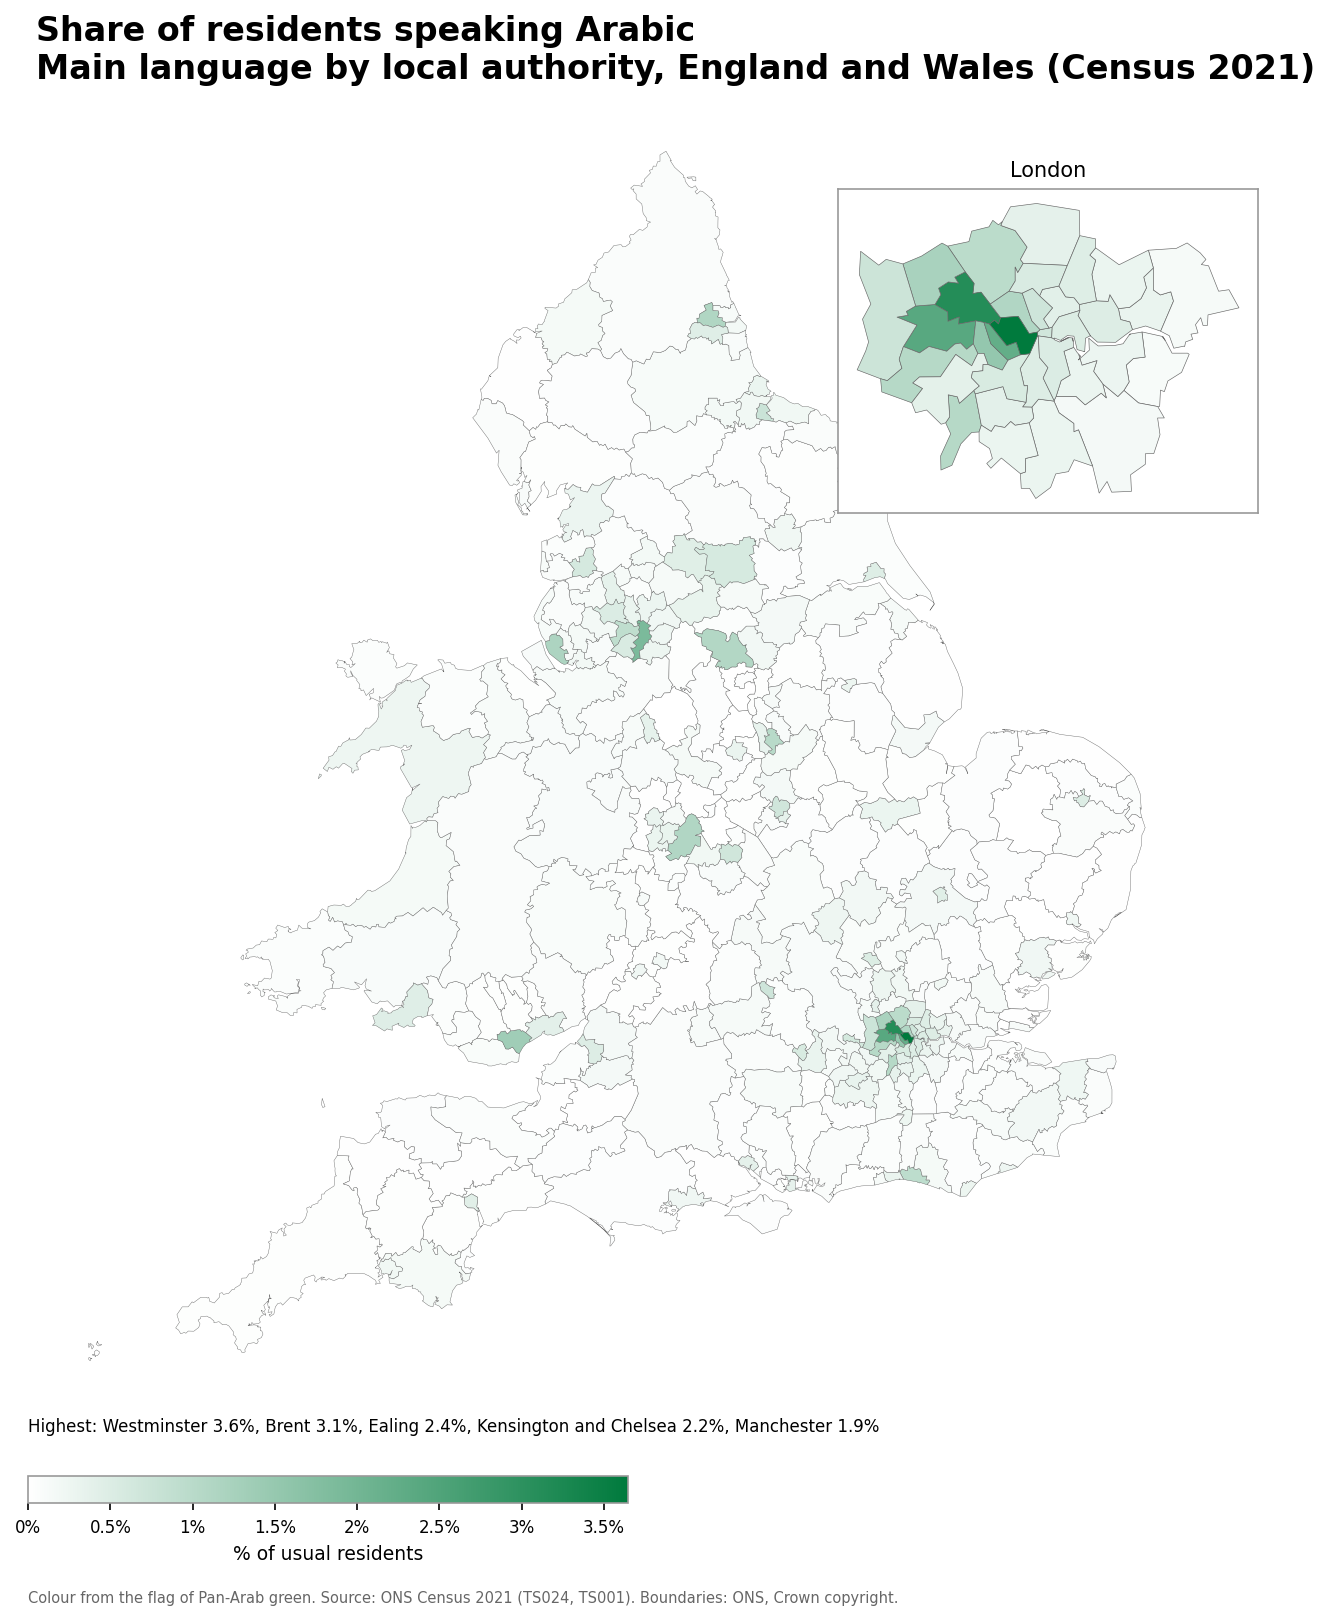
- Westminster: 3.6% (7,446 speakers)
- Brent: 3.1% (10,618 speakers)
- Ealing: 2.4% (8,775 speakers)
- Kensington and Chelsea: 2.2% (3,196 speakers)
- Manchester: 1.9% (10,425 speakers)
Number of Hebrew speakers
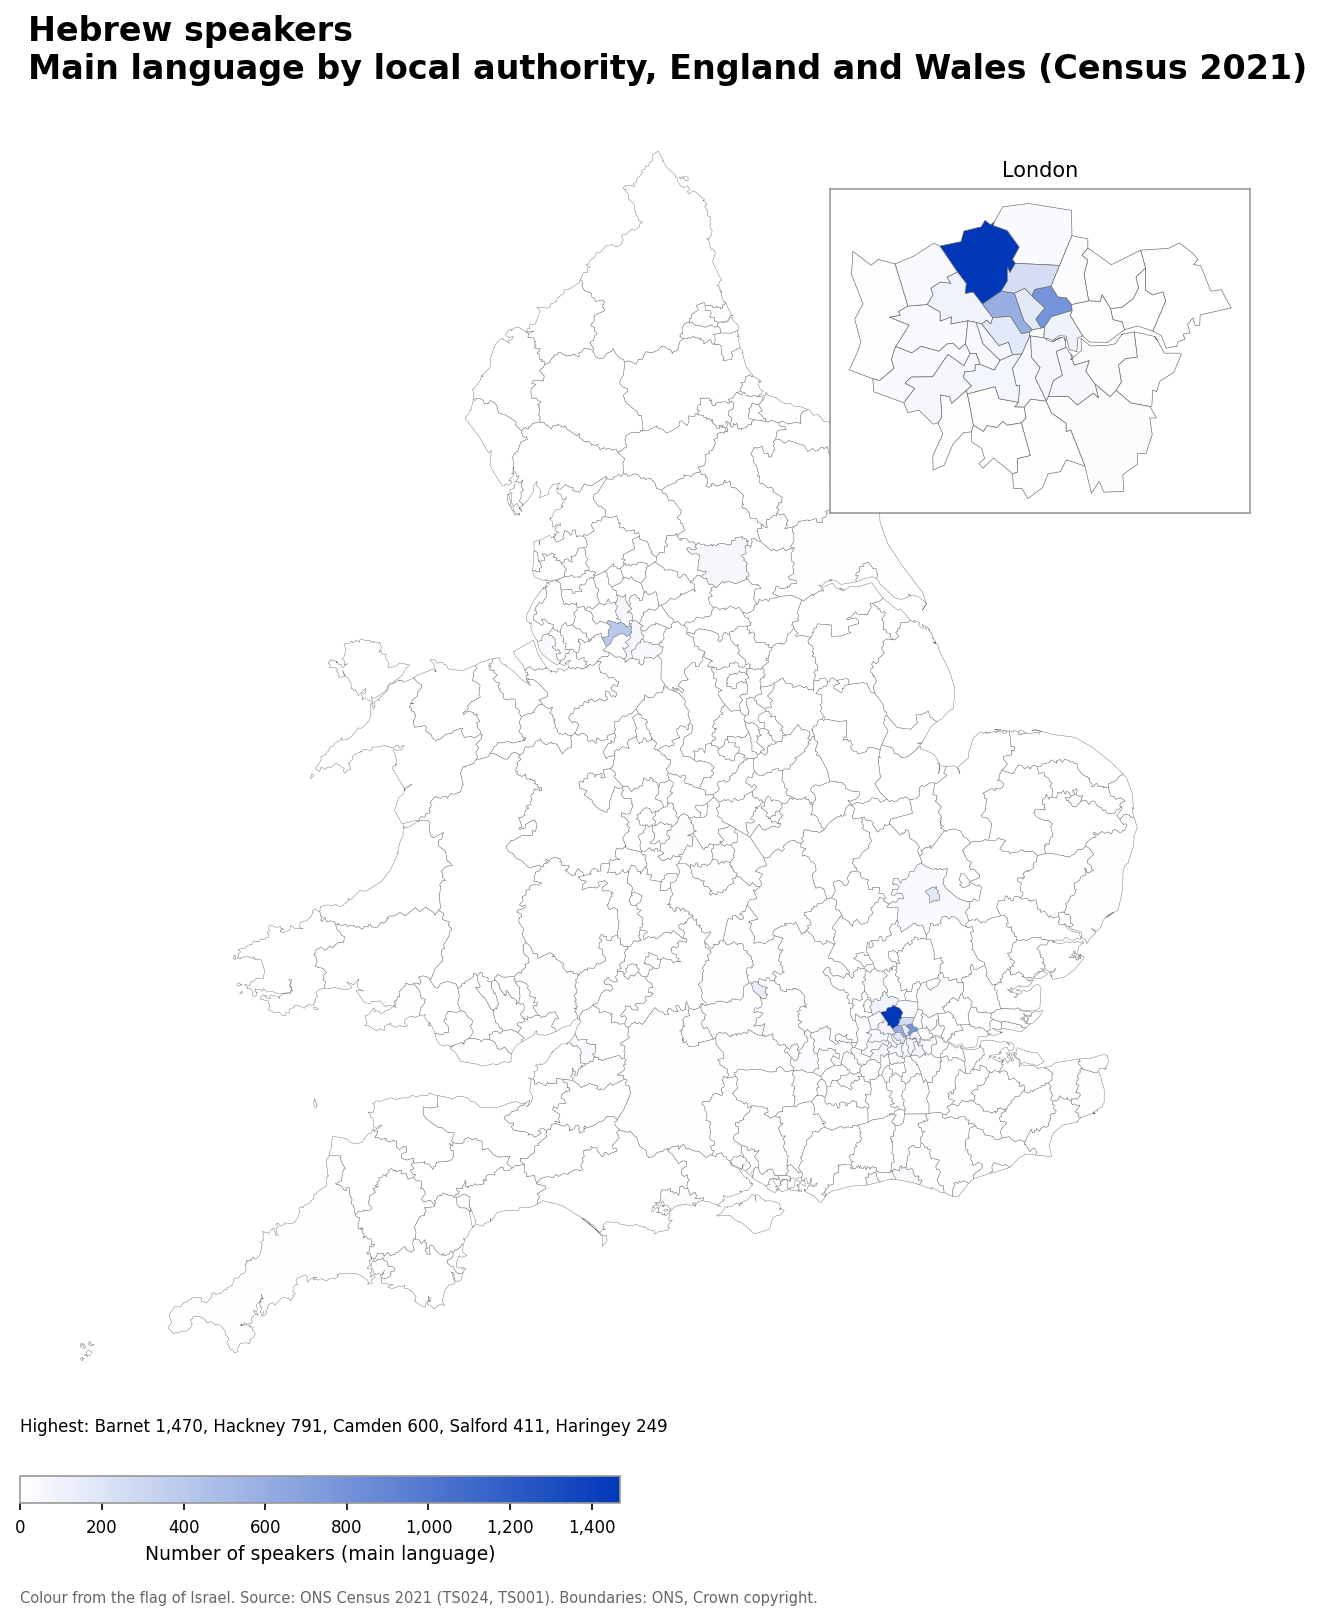
- Barnet: 1,470
- Hackney: 791
- Camden: 600
- Salford: 411
- Haringey: 249
Hebrew speakers as a share of the population
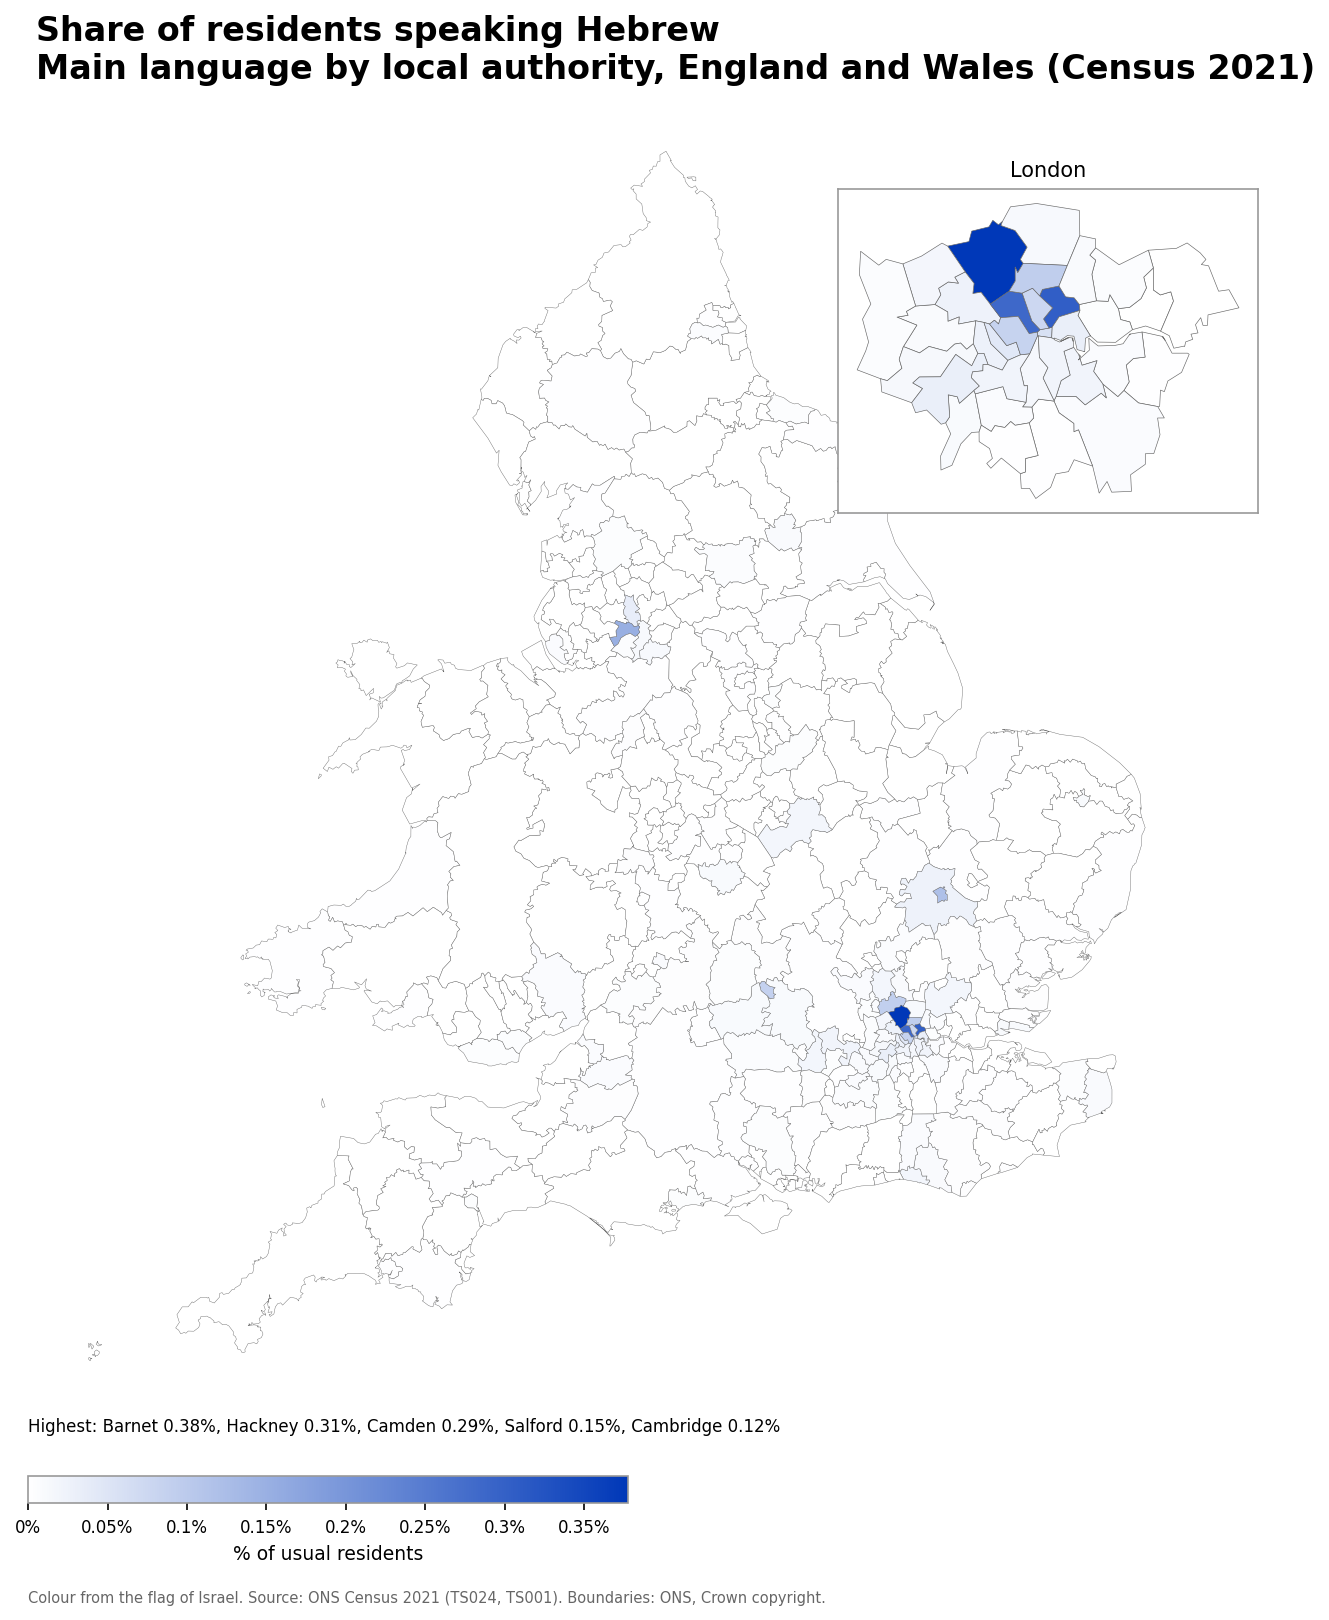
- Barnet: 0.38% (1,470 speakers)
- Hackney: 0.31% (791 speakers)
- Camden: 0.29% (600 speakers)
- Salford: 0.15% (411 speakers)
- Cambridge: 0.12% (175 speakers)
Number of Kurdish speakers
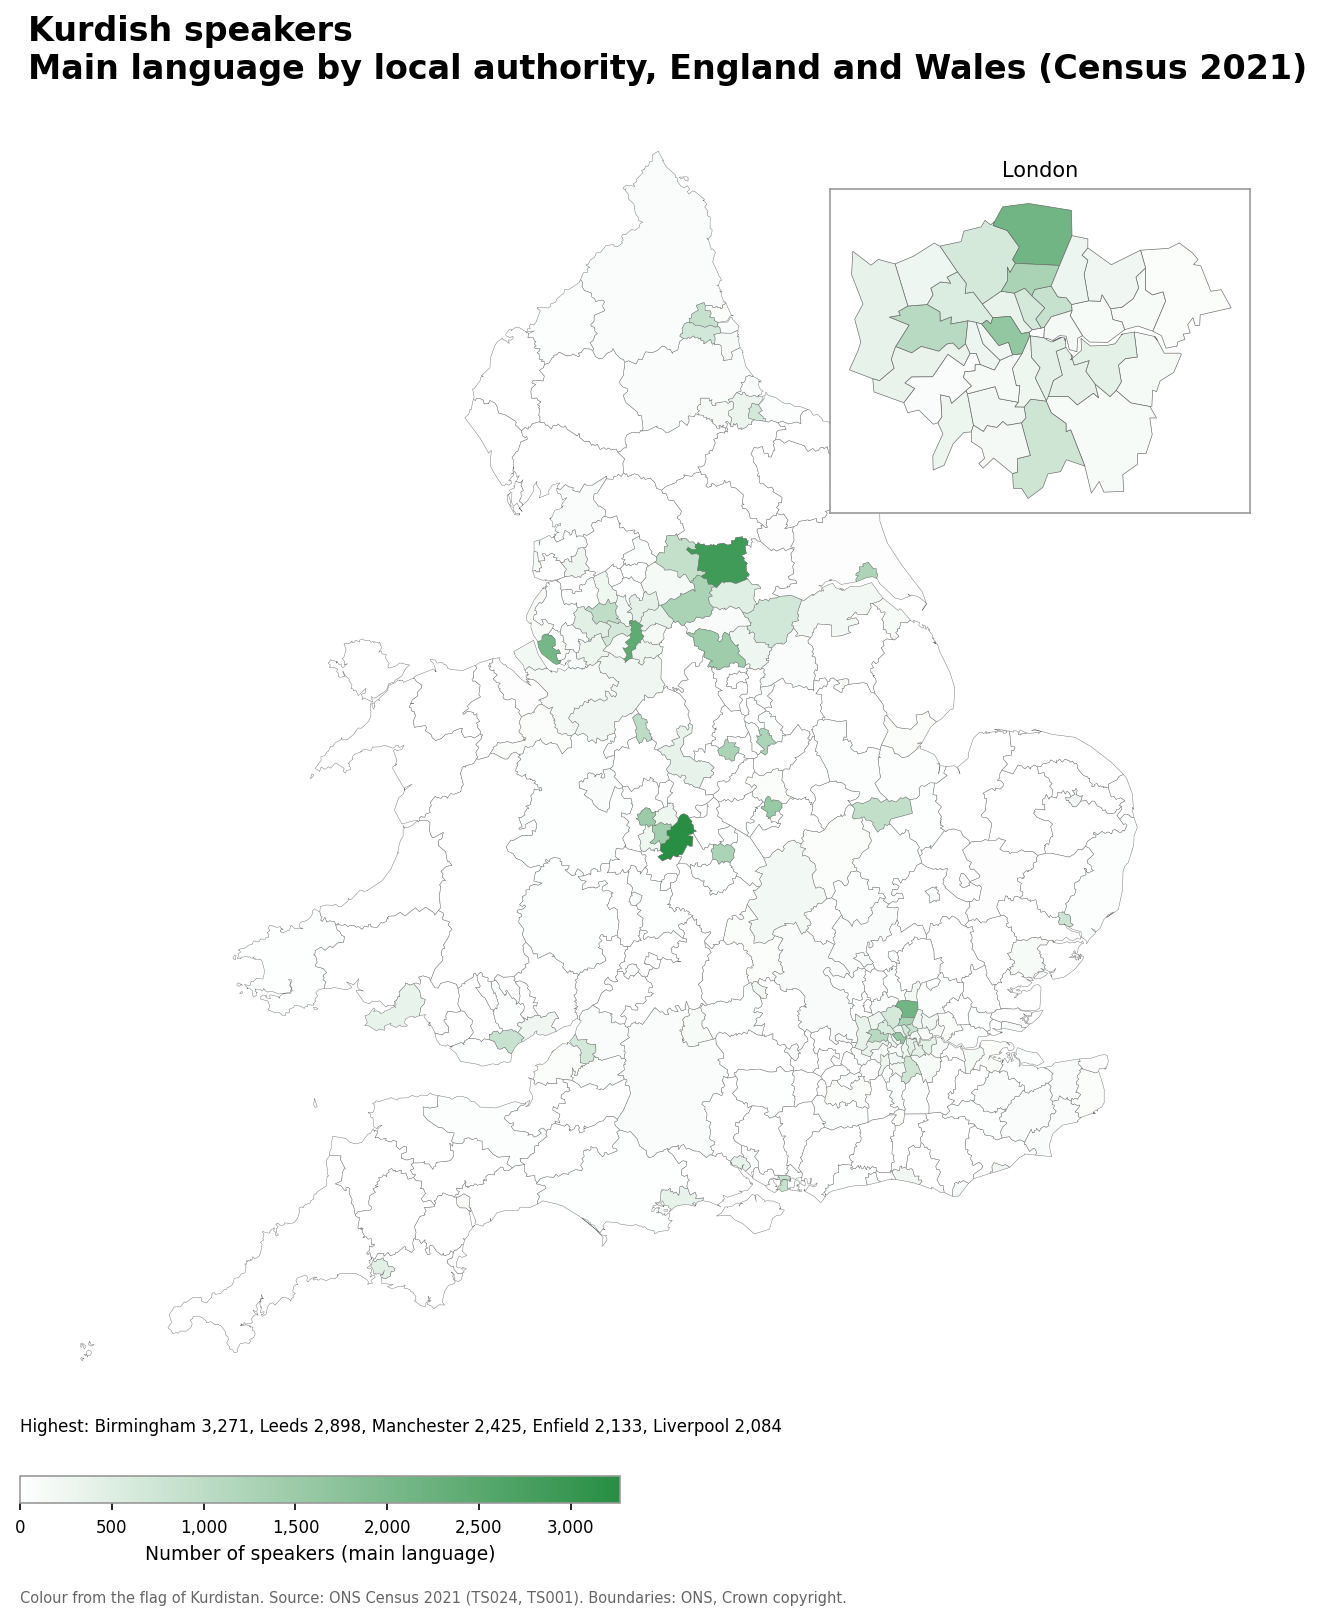
- Birmingham: 3,271
- Leeds: 2,898
- Manchester: 2,425
- Enfield: 2,133
- Liverpool: 2,084
Kurdish speakers as a share of the population
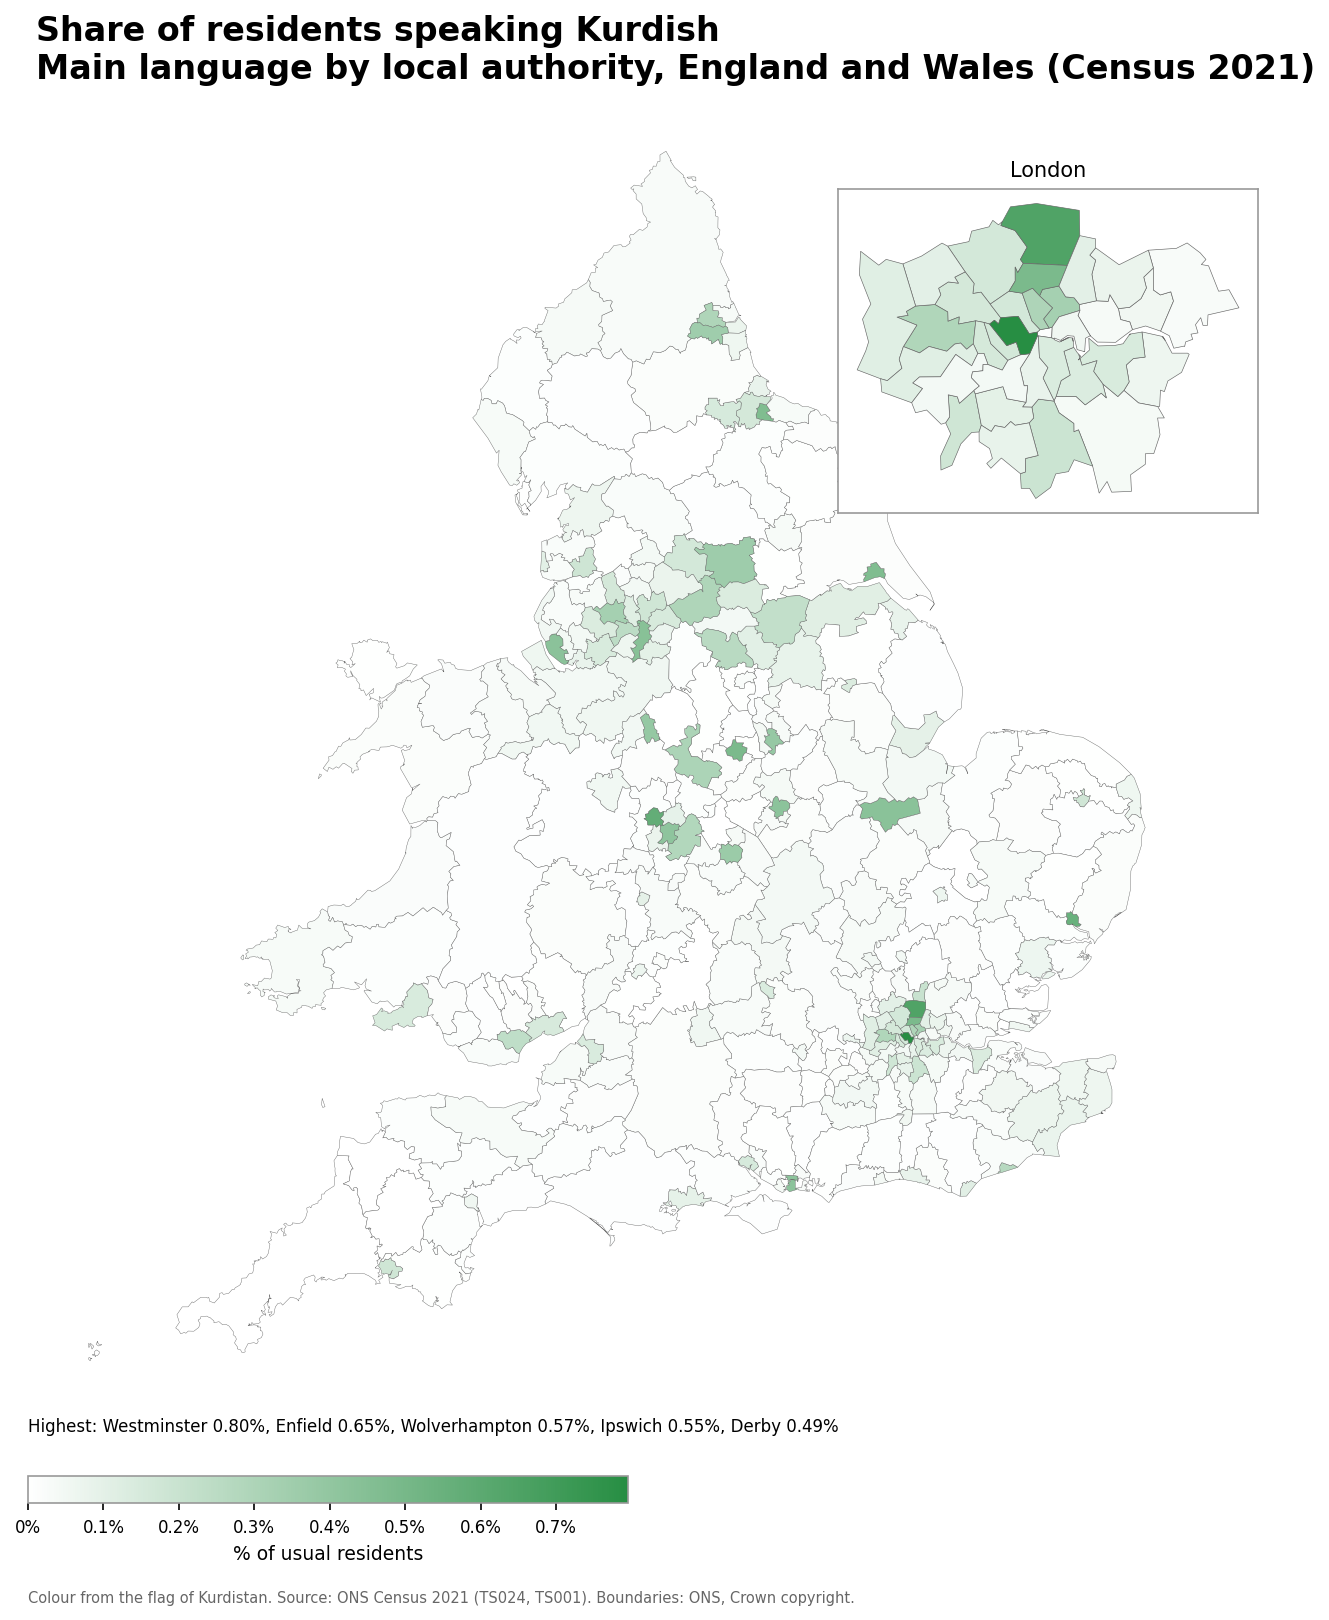
- Westminster: 0.80% (1,625 speakers)
- Enfield: 0.65% (2,133 speakers)
- Wolverhampton: 0.57% (1,510 speakers)
- Ipswich: 0.55% (771 speakers)
- Derby: 0.49% (1,275 speakers)
Number of Persian speakers
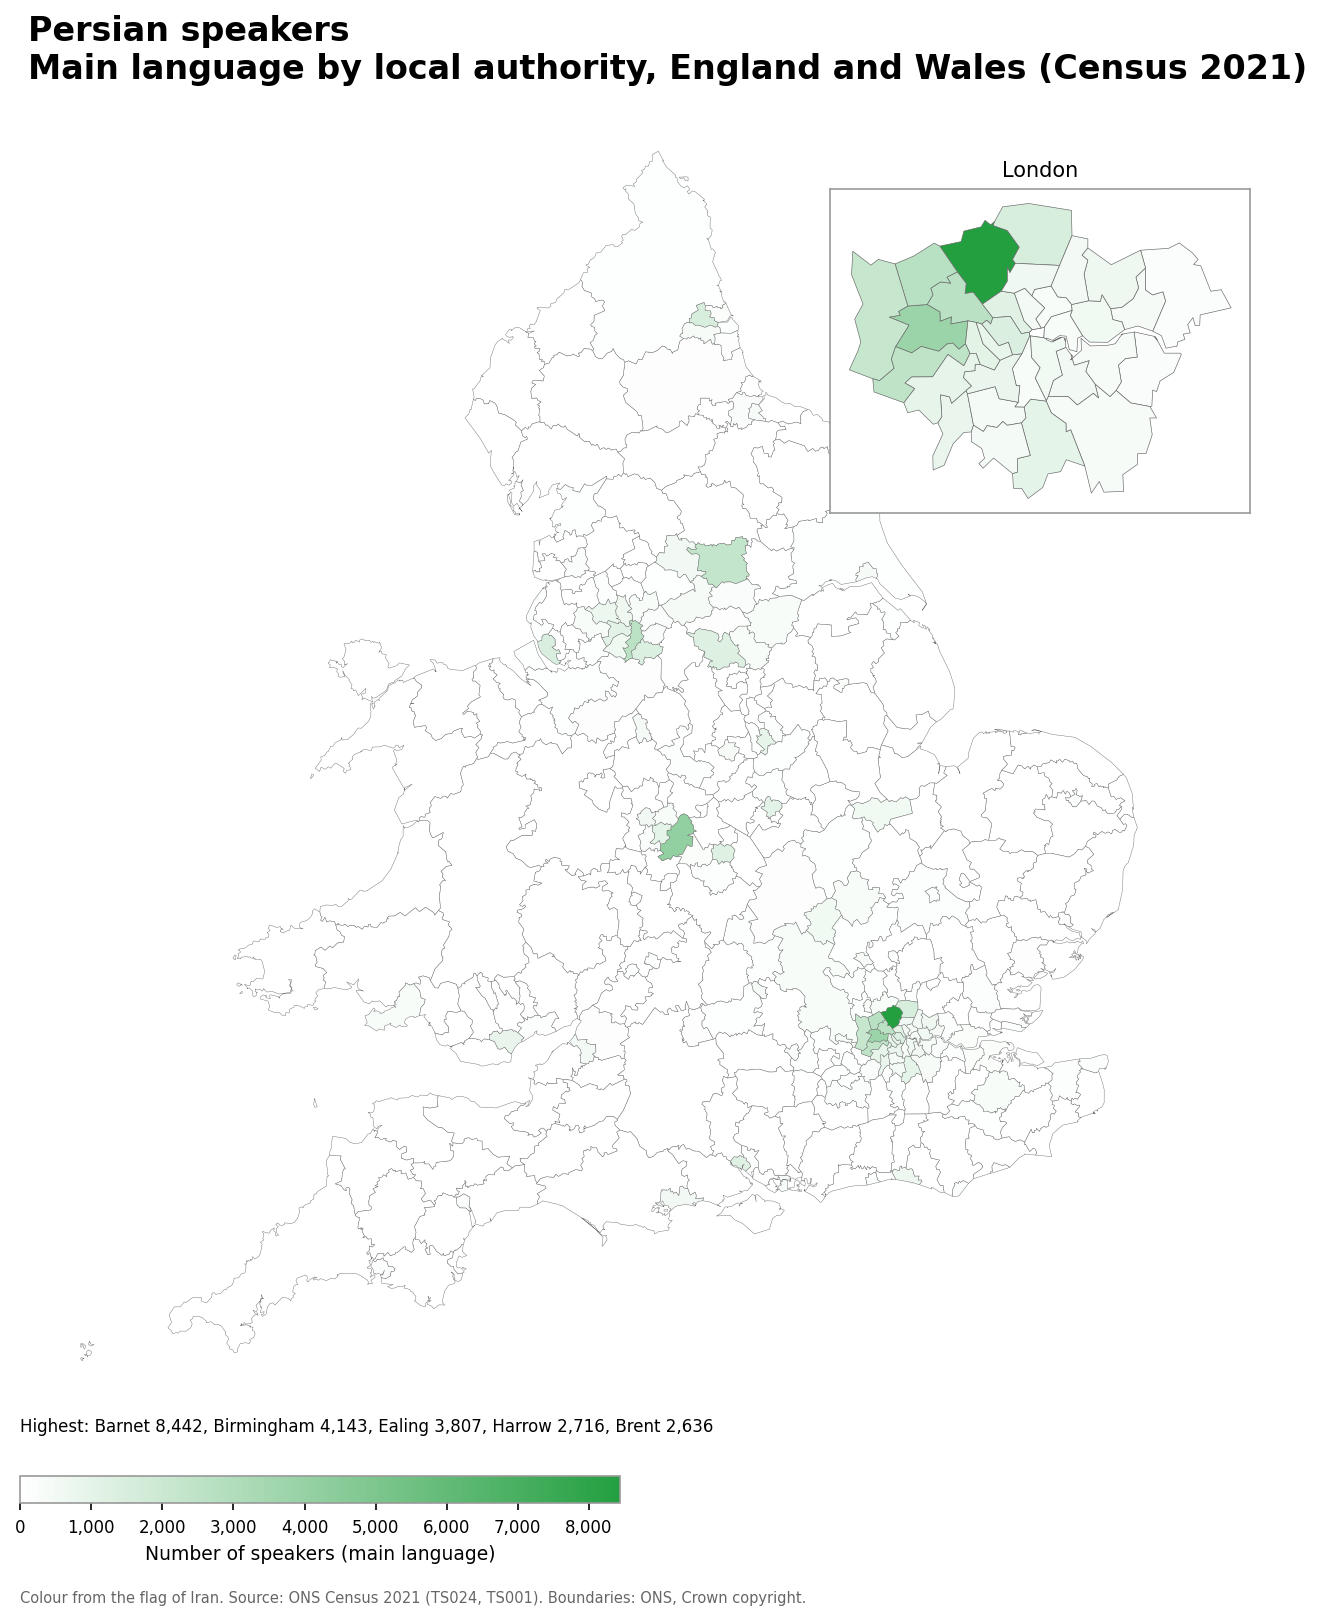
- Barnet: 8,442
- Birmingham: 4,143
- Ealing: 3,807
- Harrow: 2,716
- Brent: 2,636
Persian speakers as a share of the population
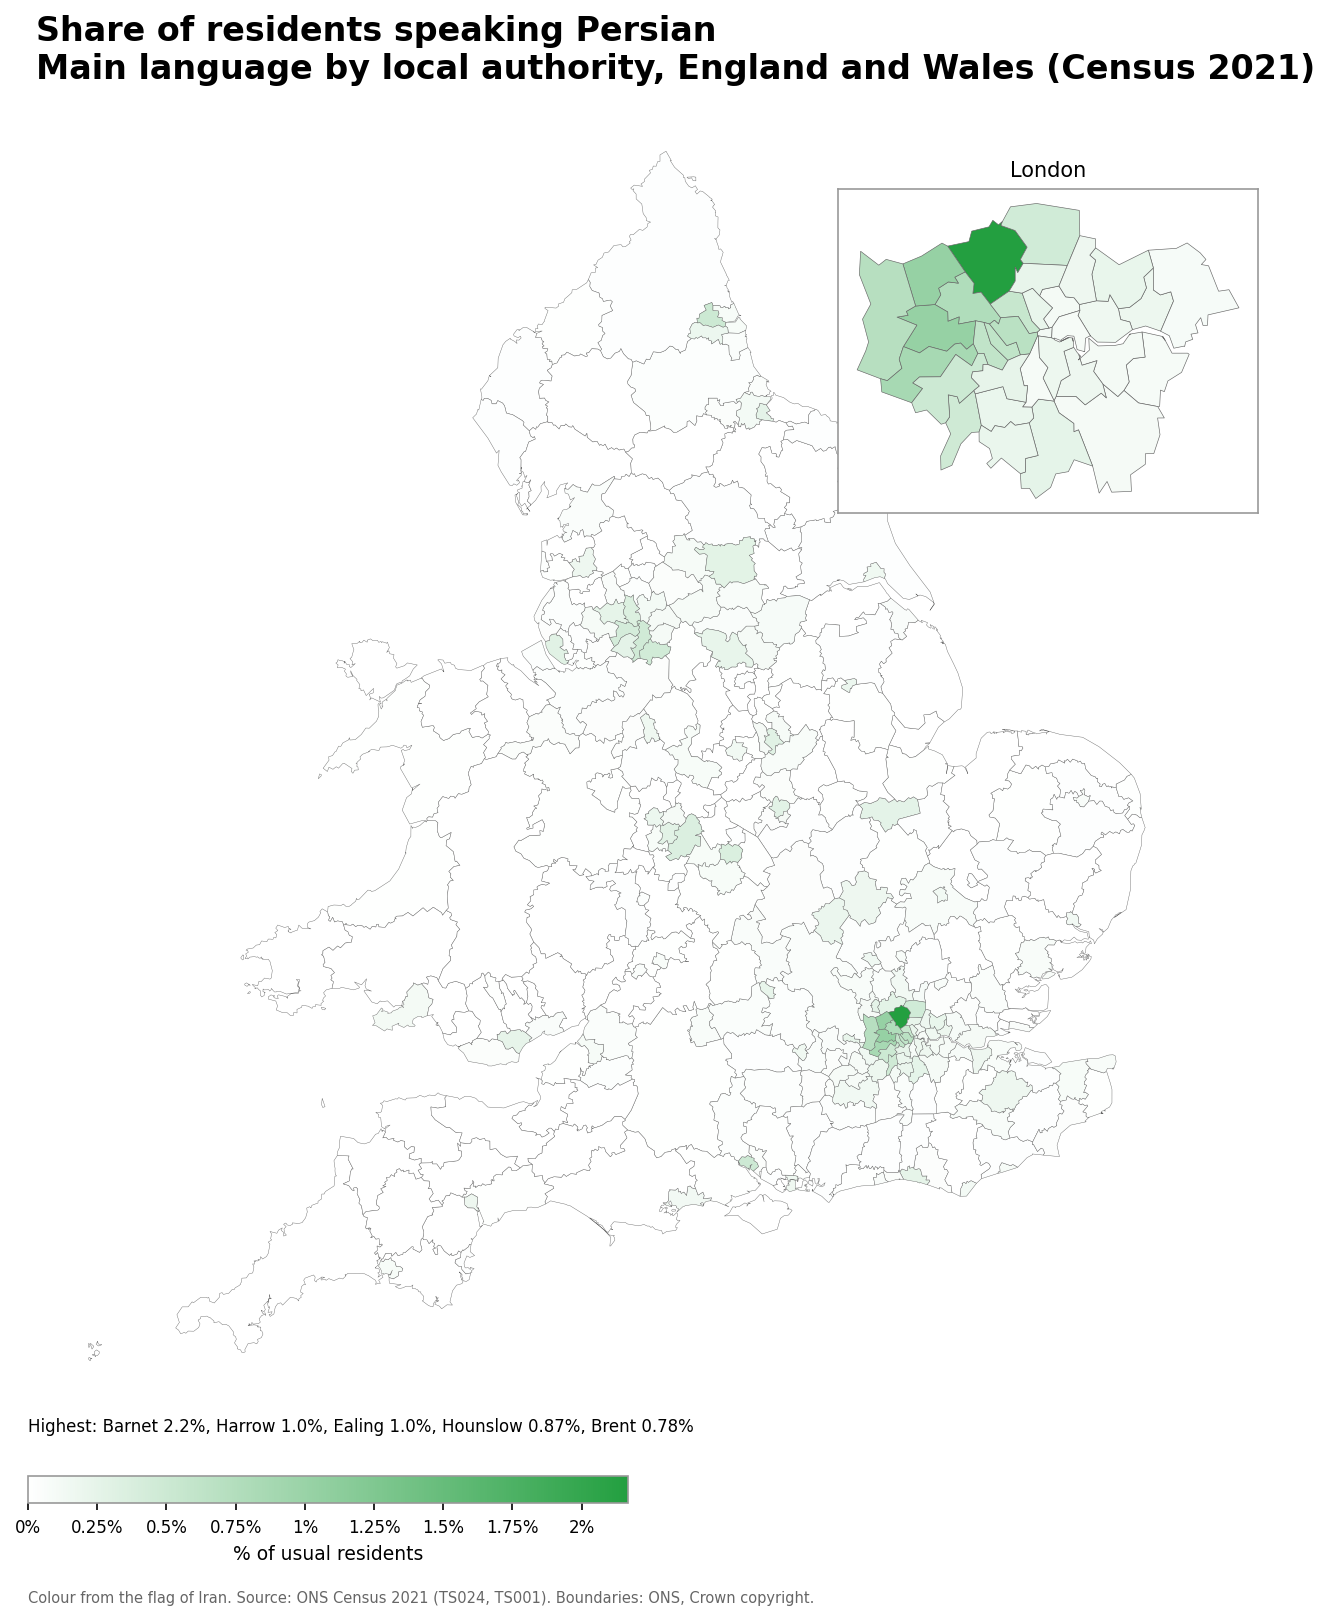
- Barnet: 2.2% (8,442 speakers)
- Harrow: 1.0% (2,716 speakers)
- Ealing: 1.0% (3,807 speakers)
- Hounslow: 0.87% (2,496 speakers)
- Brent: 0.78% (2,636 speakers)
Number of Pashto speakers
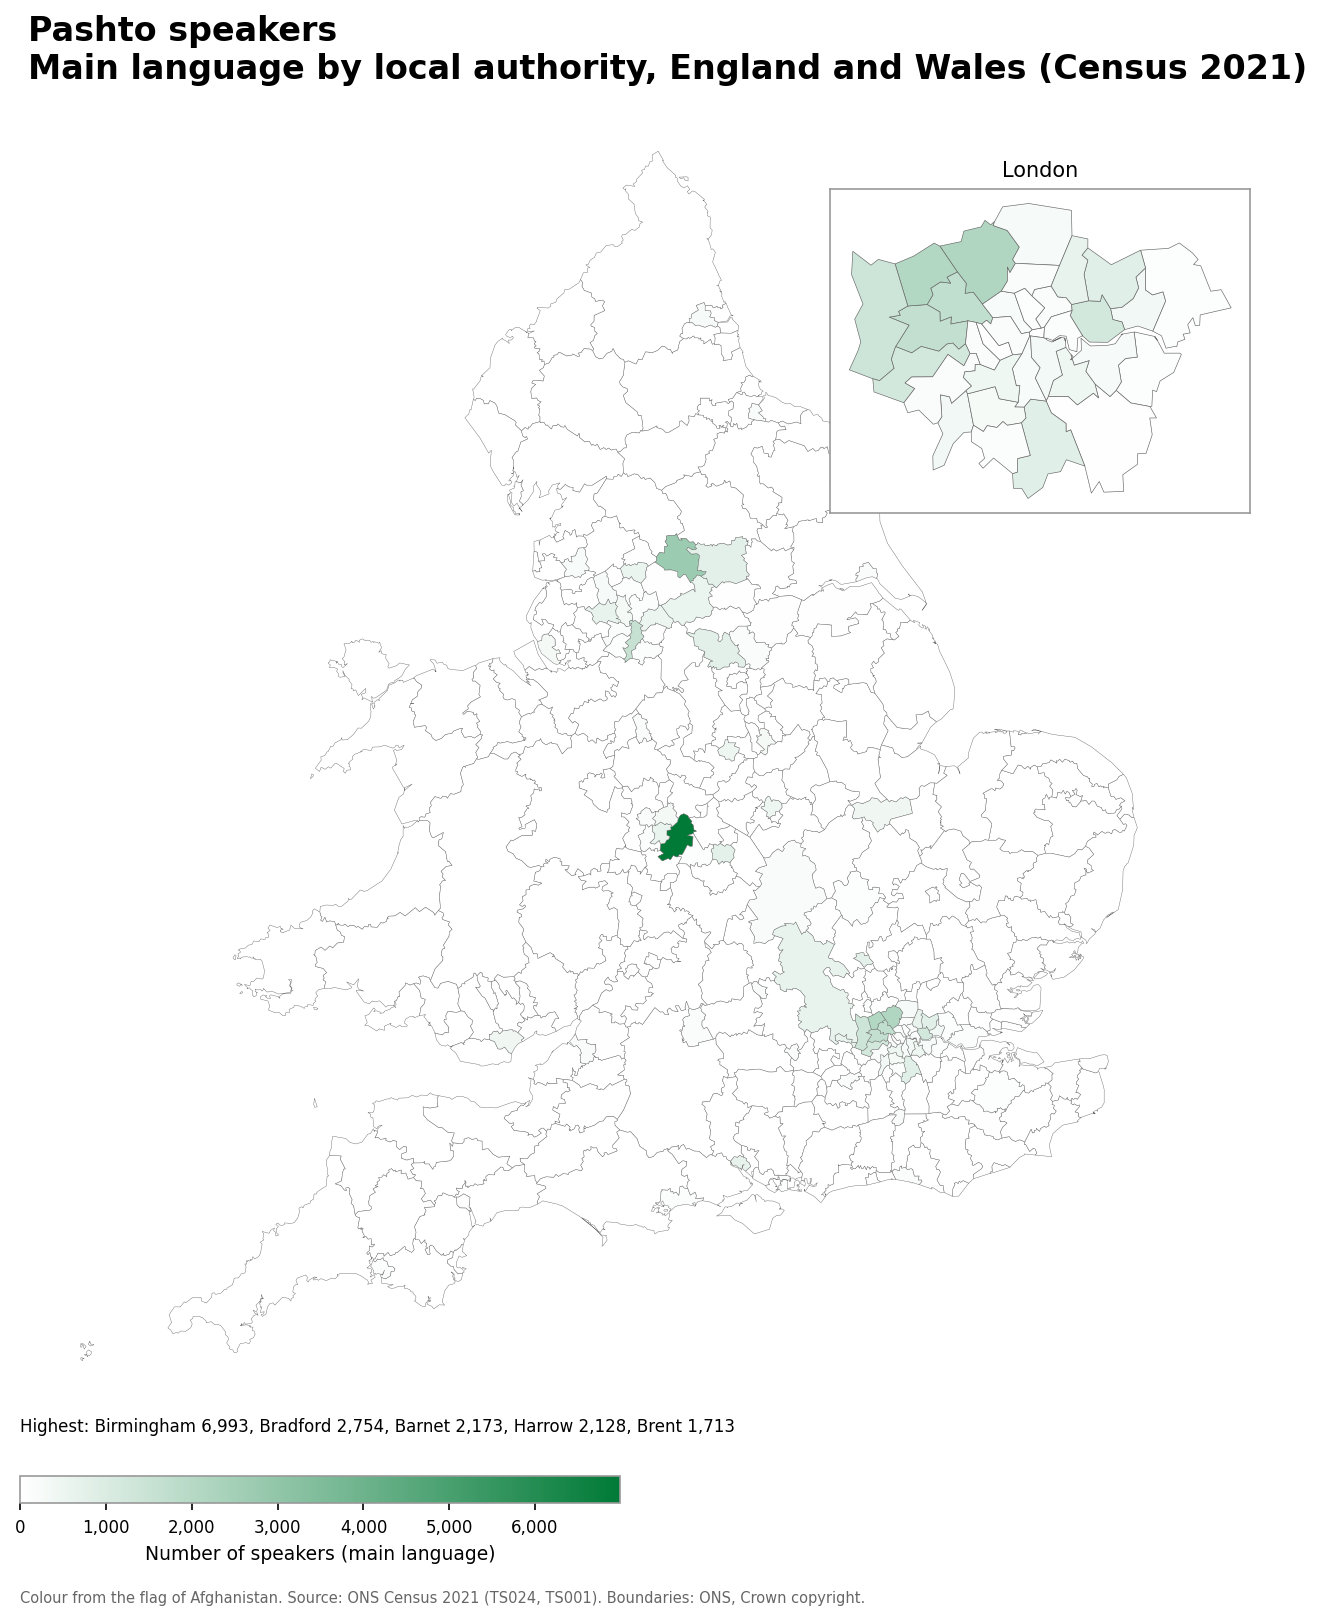
- Birmingham: 6,993
- Bradford: 2,754
- Barnet: 2,173
- Harrow: 2,128
- Brent: 1,713
Pashto speakers as a share of the population
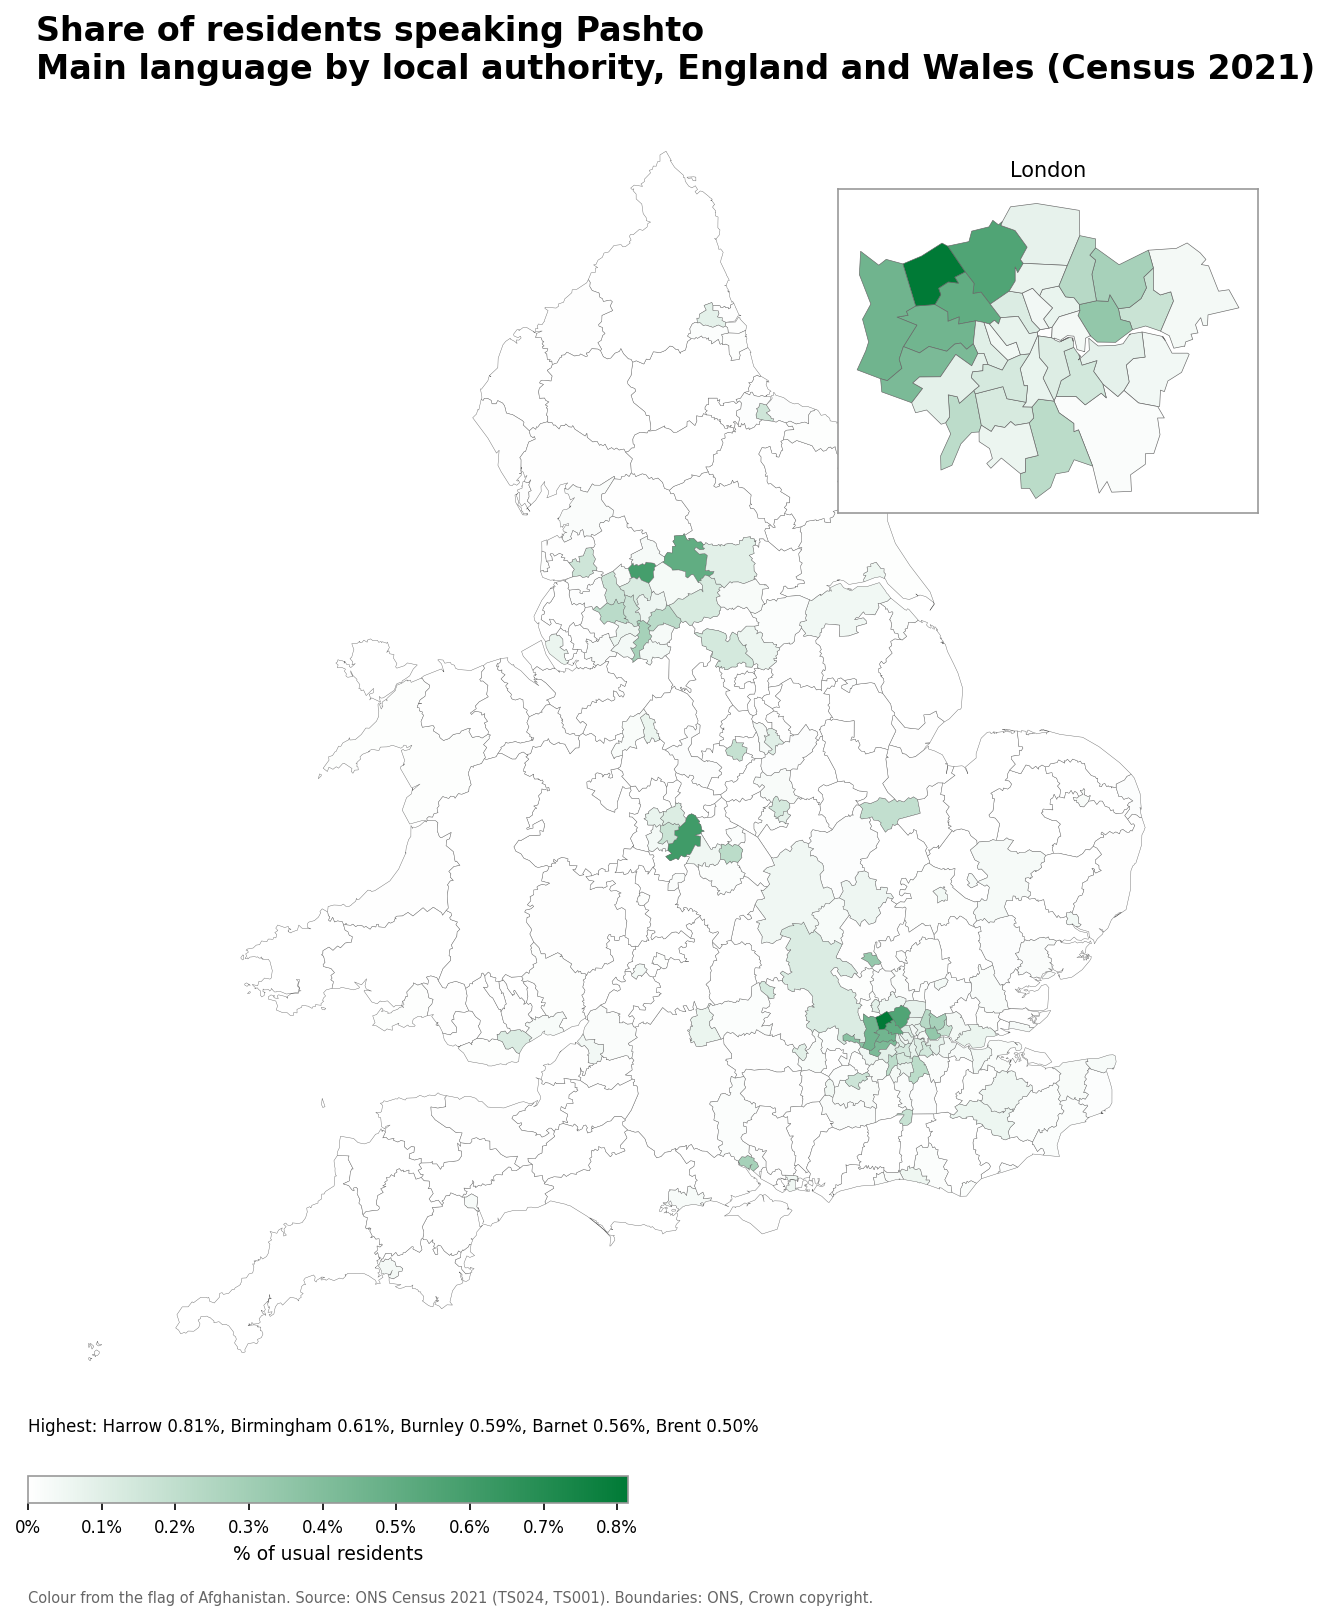
- Harrow: 0.81% (2,128 speakers)
- Birmingham: 0.61% (6,993 speakers)
- Burnley: 0.59% (561 speakers)
- Barnet: 0.56% (2,173 speakers)
- Brent: 0.50% (1,713 speakers)
Number of Urdu speakers
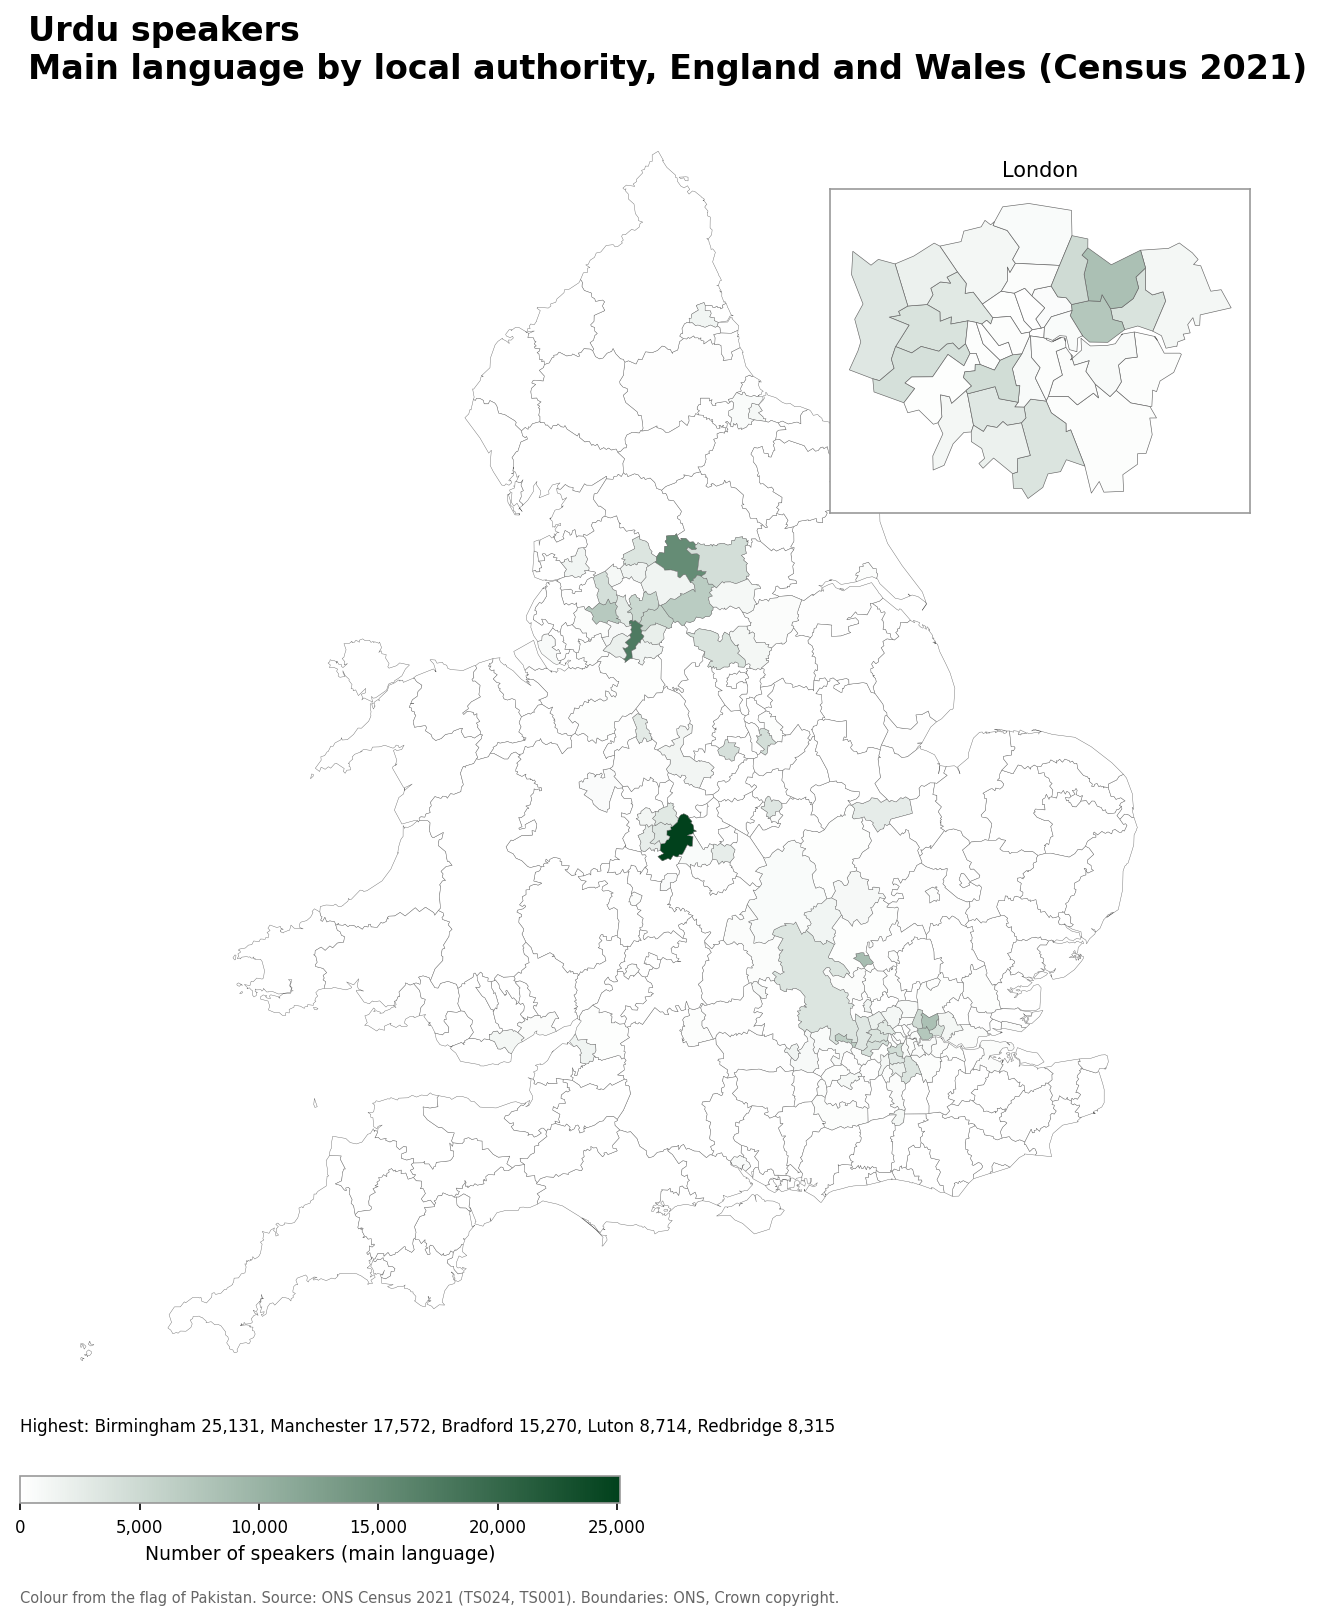
- Birmingham: 25,131
- Manchester: 17,572
- Bradford: 15,270
- Luton: 8,714
- Redbridge: 8,315
Urdu speakers as a share of the population
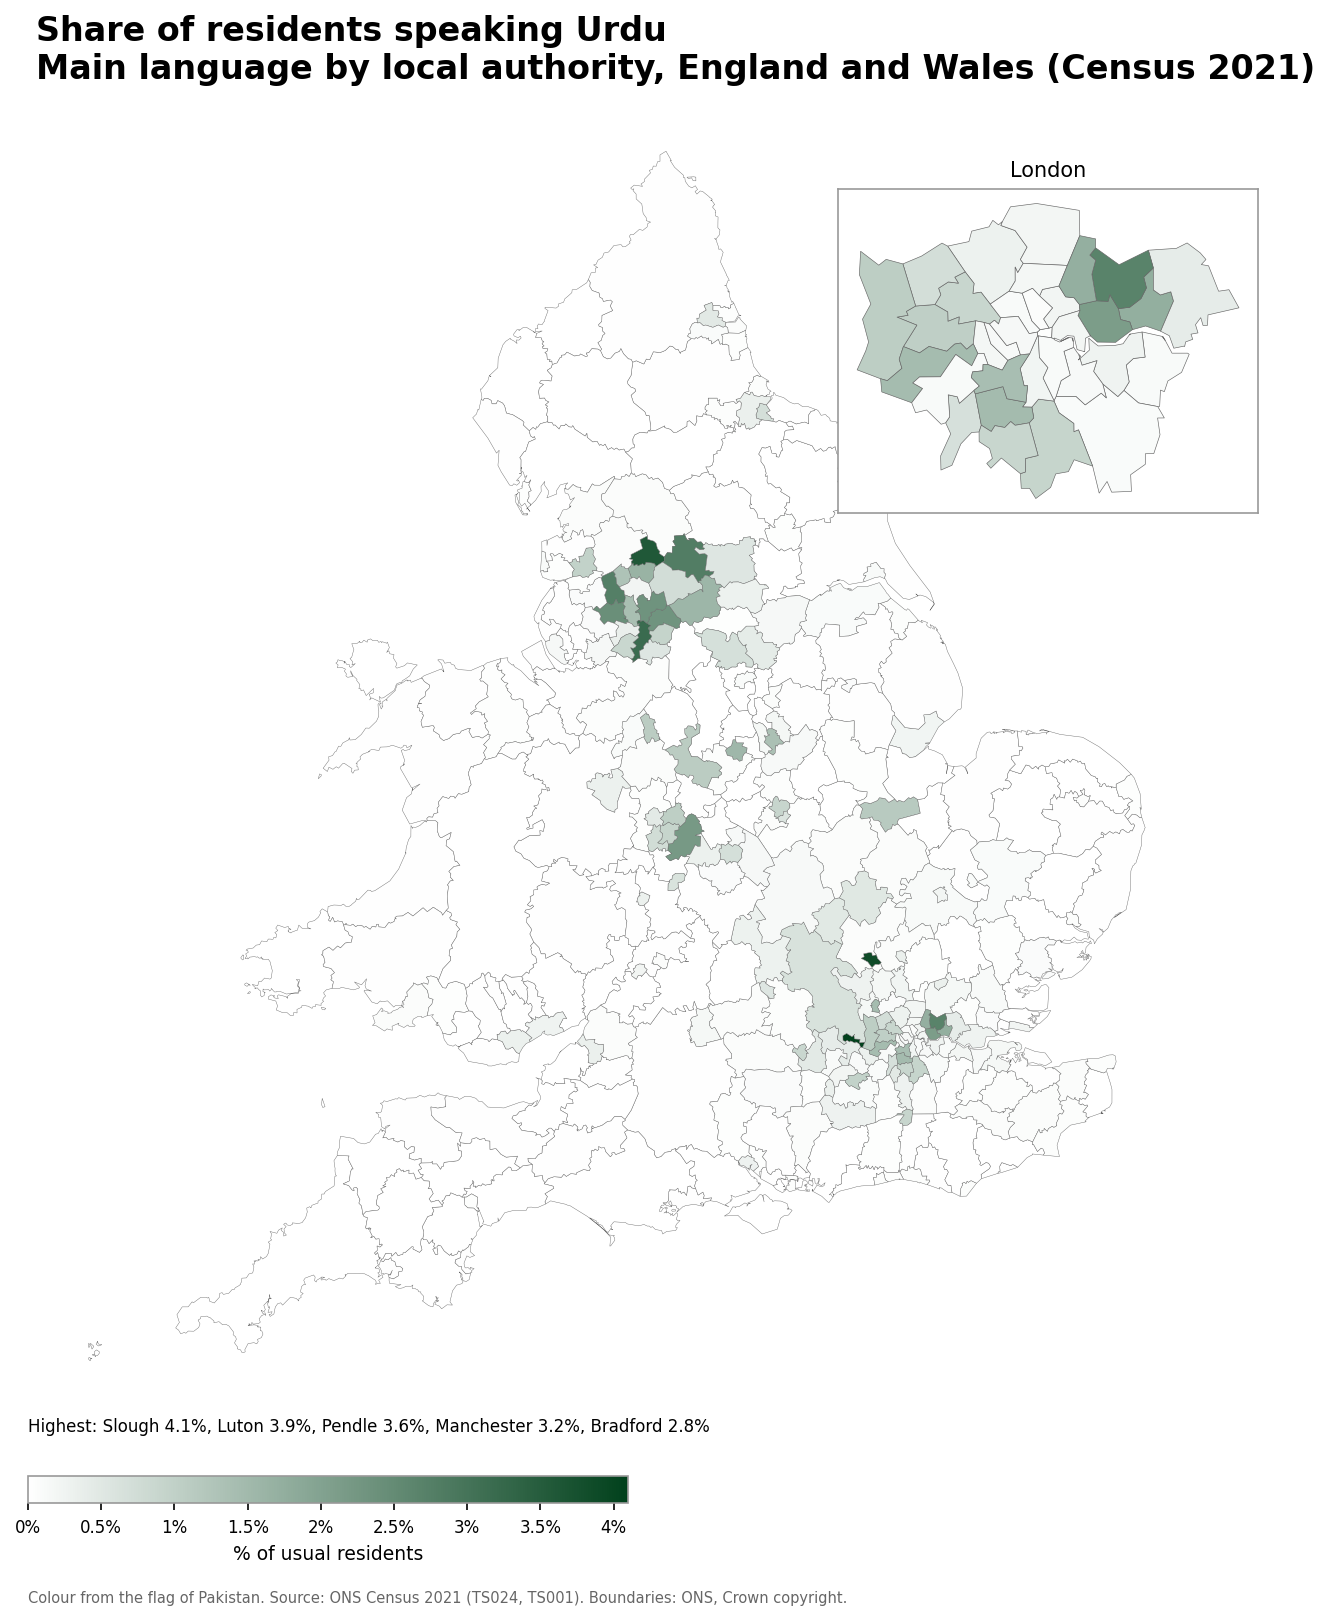
- Slough: 4.1% (6,497 speakers)
- Luton: 3.9% (8,714 speakers)
- Pendle: 3.6% (3,441 speakers)
- Manchester: 3.2% (17,572 speakers)
- Bradford: 2.8% (15,270 speakers)
Number of Hindi speakers
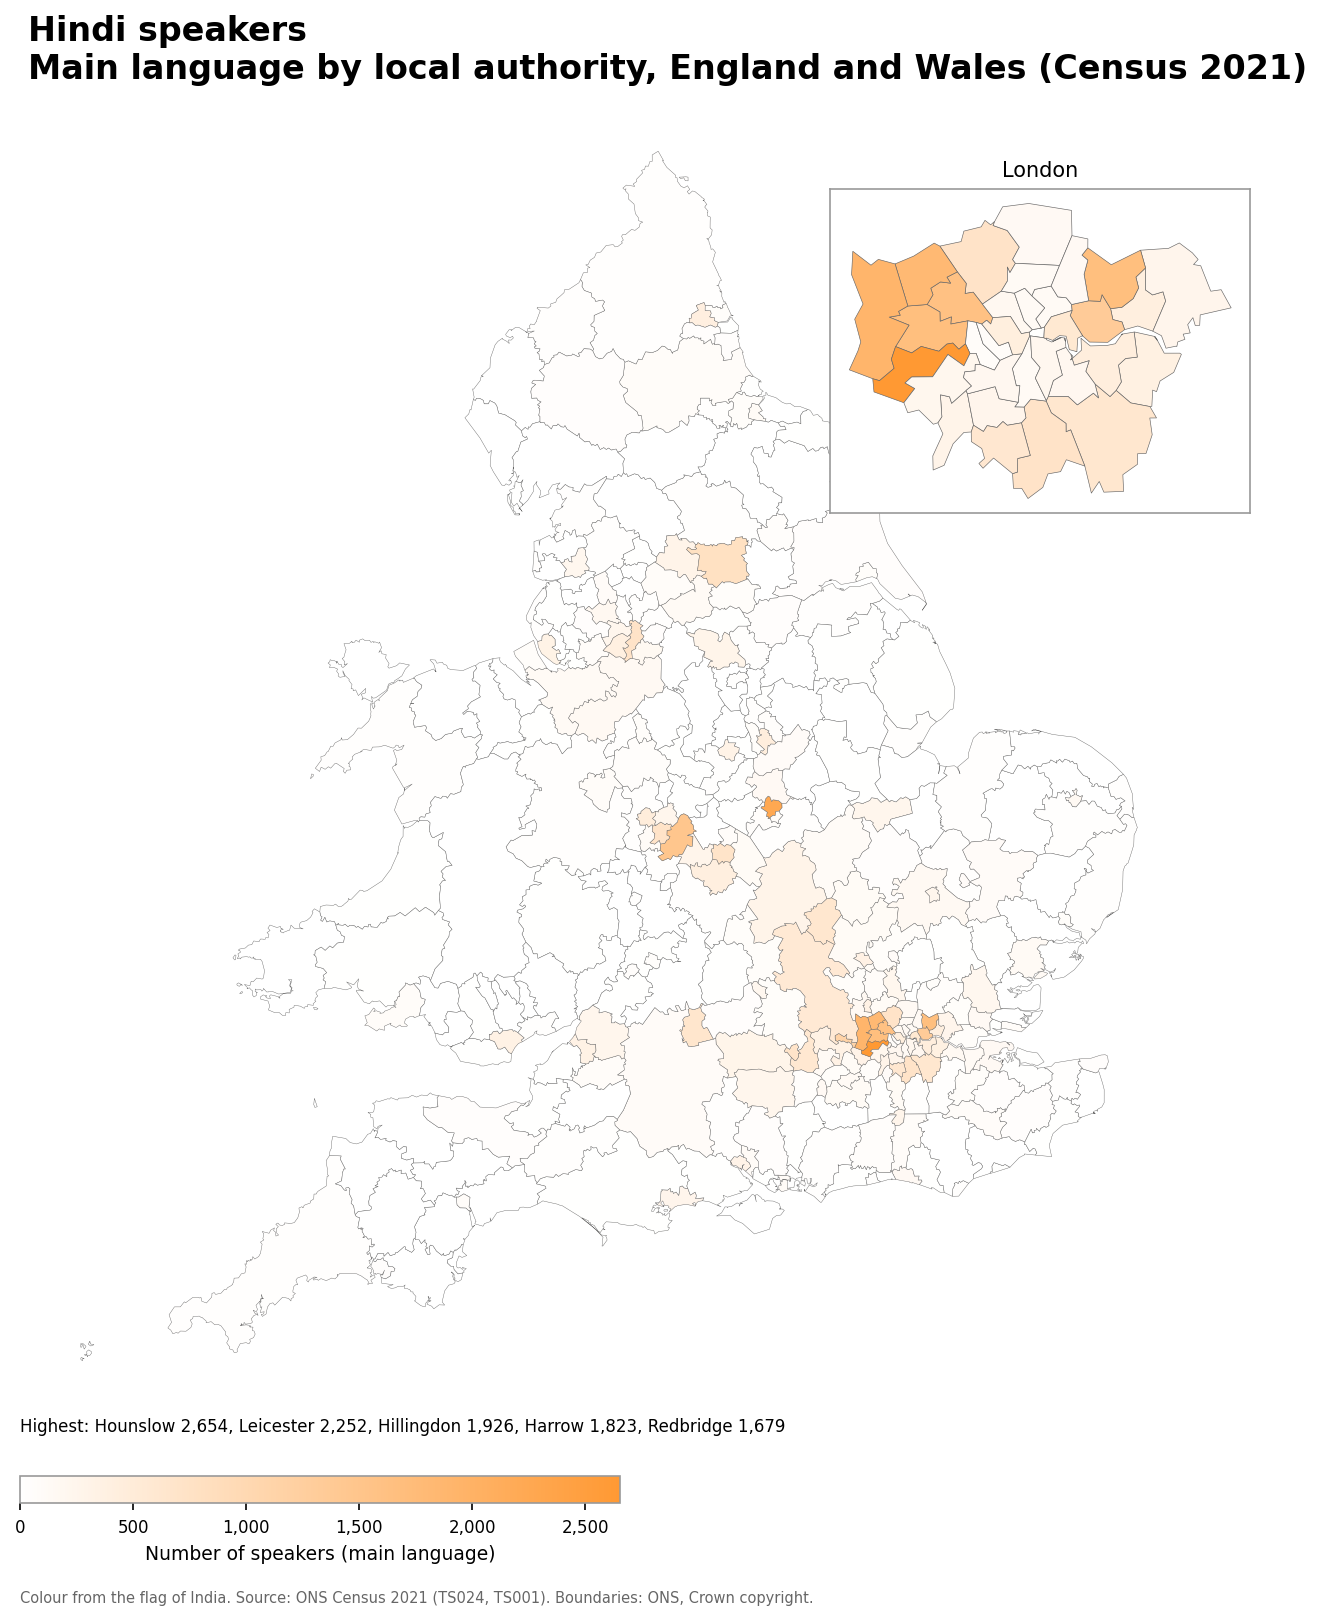
- Hounslow: 2,654
- Leicester: 2,252
- Hillingdon: 1,926
- Harrow: 1,823
- Redbridge: 1,679
Hindi speakers as a share of the population
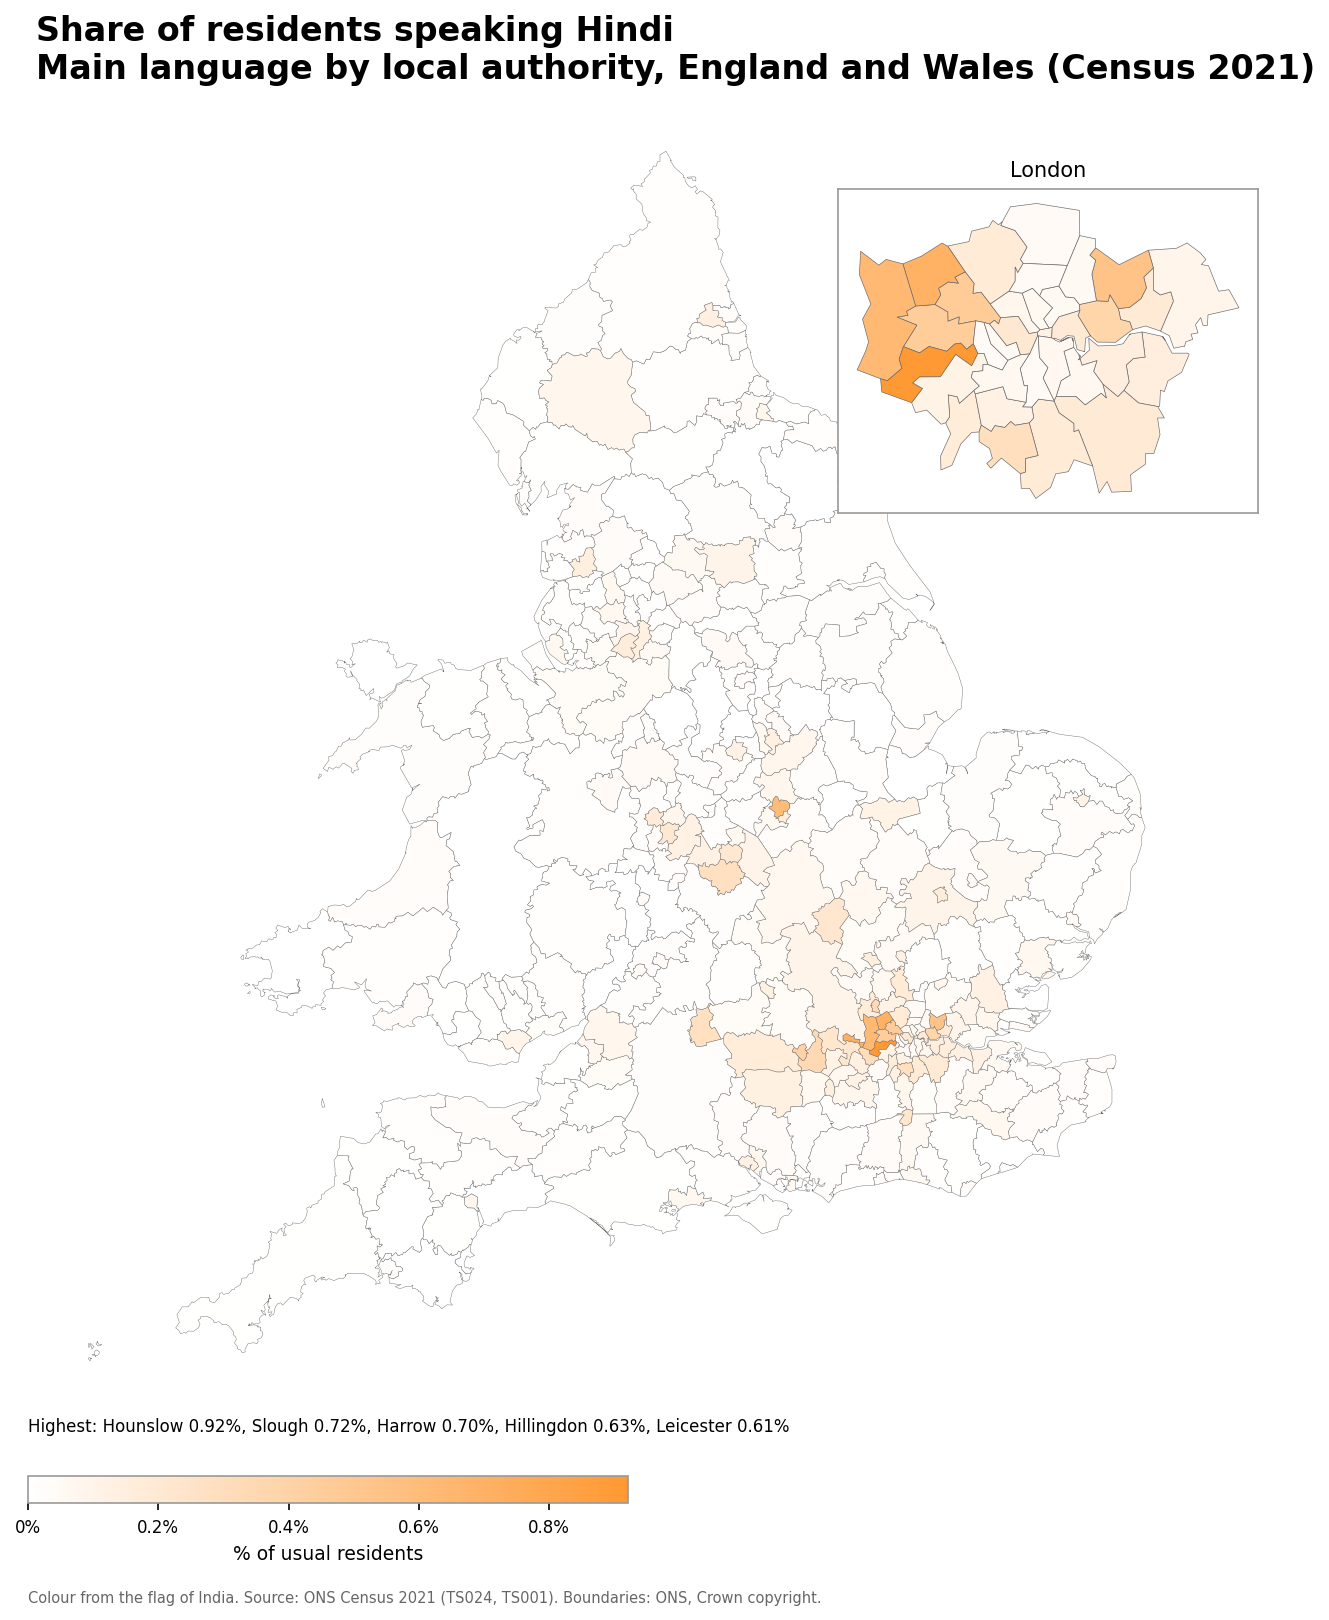
- Hounslow: 0.92% (2,654 speakers)
- Slough: 0.72% (1,148 speakers)
- Harrow: 0.70% (1,823 speakers)
- Hillingdon: 0.63% (1,926 speakers)
- Leicester: 0.61% (2,252 speakers)
Number of Panjabi speakers
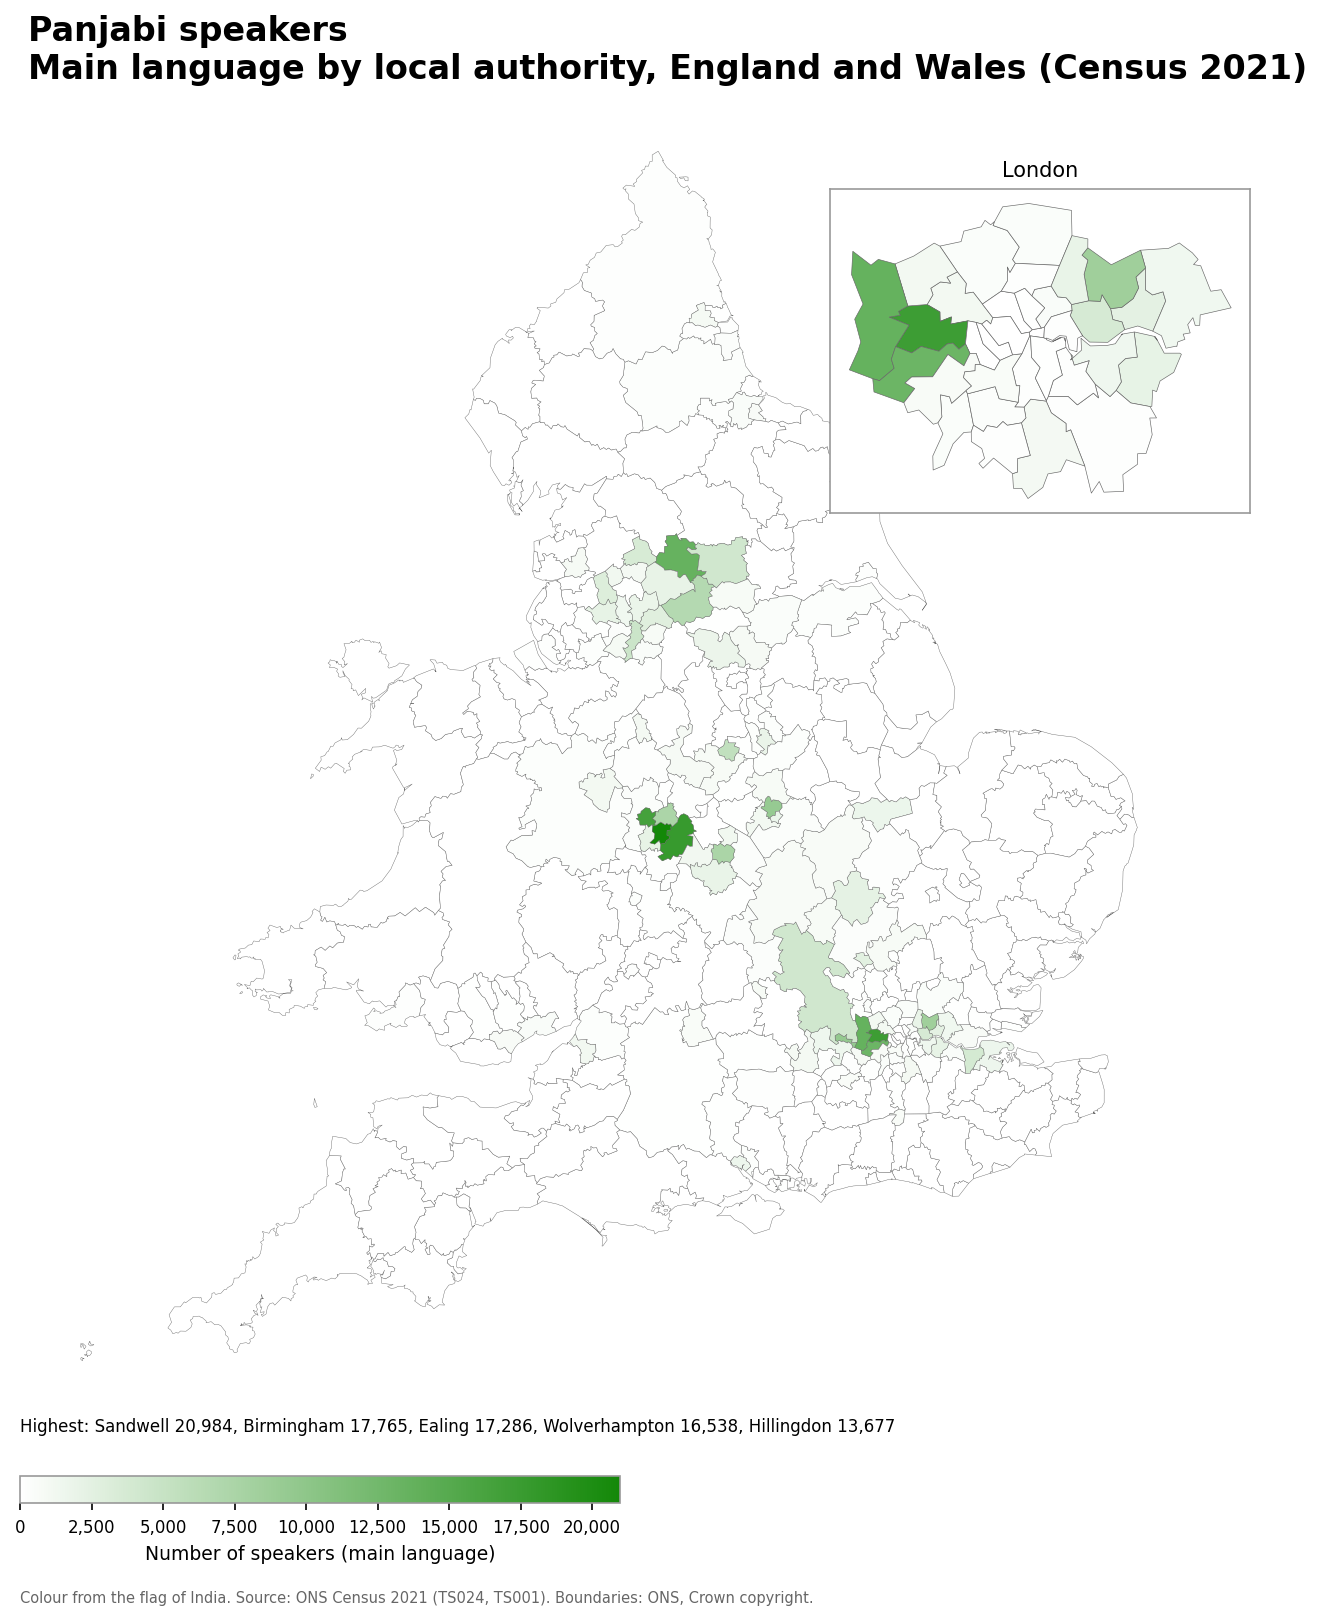
- Sandwell: 20,984
- Birmingham: 17,765
- Ealing: 17,286
- Wolverhampton: 16,538
- Hillingdon: 13,677
Panjabi speakers as a share of the population
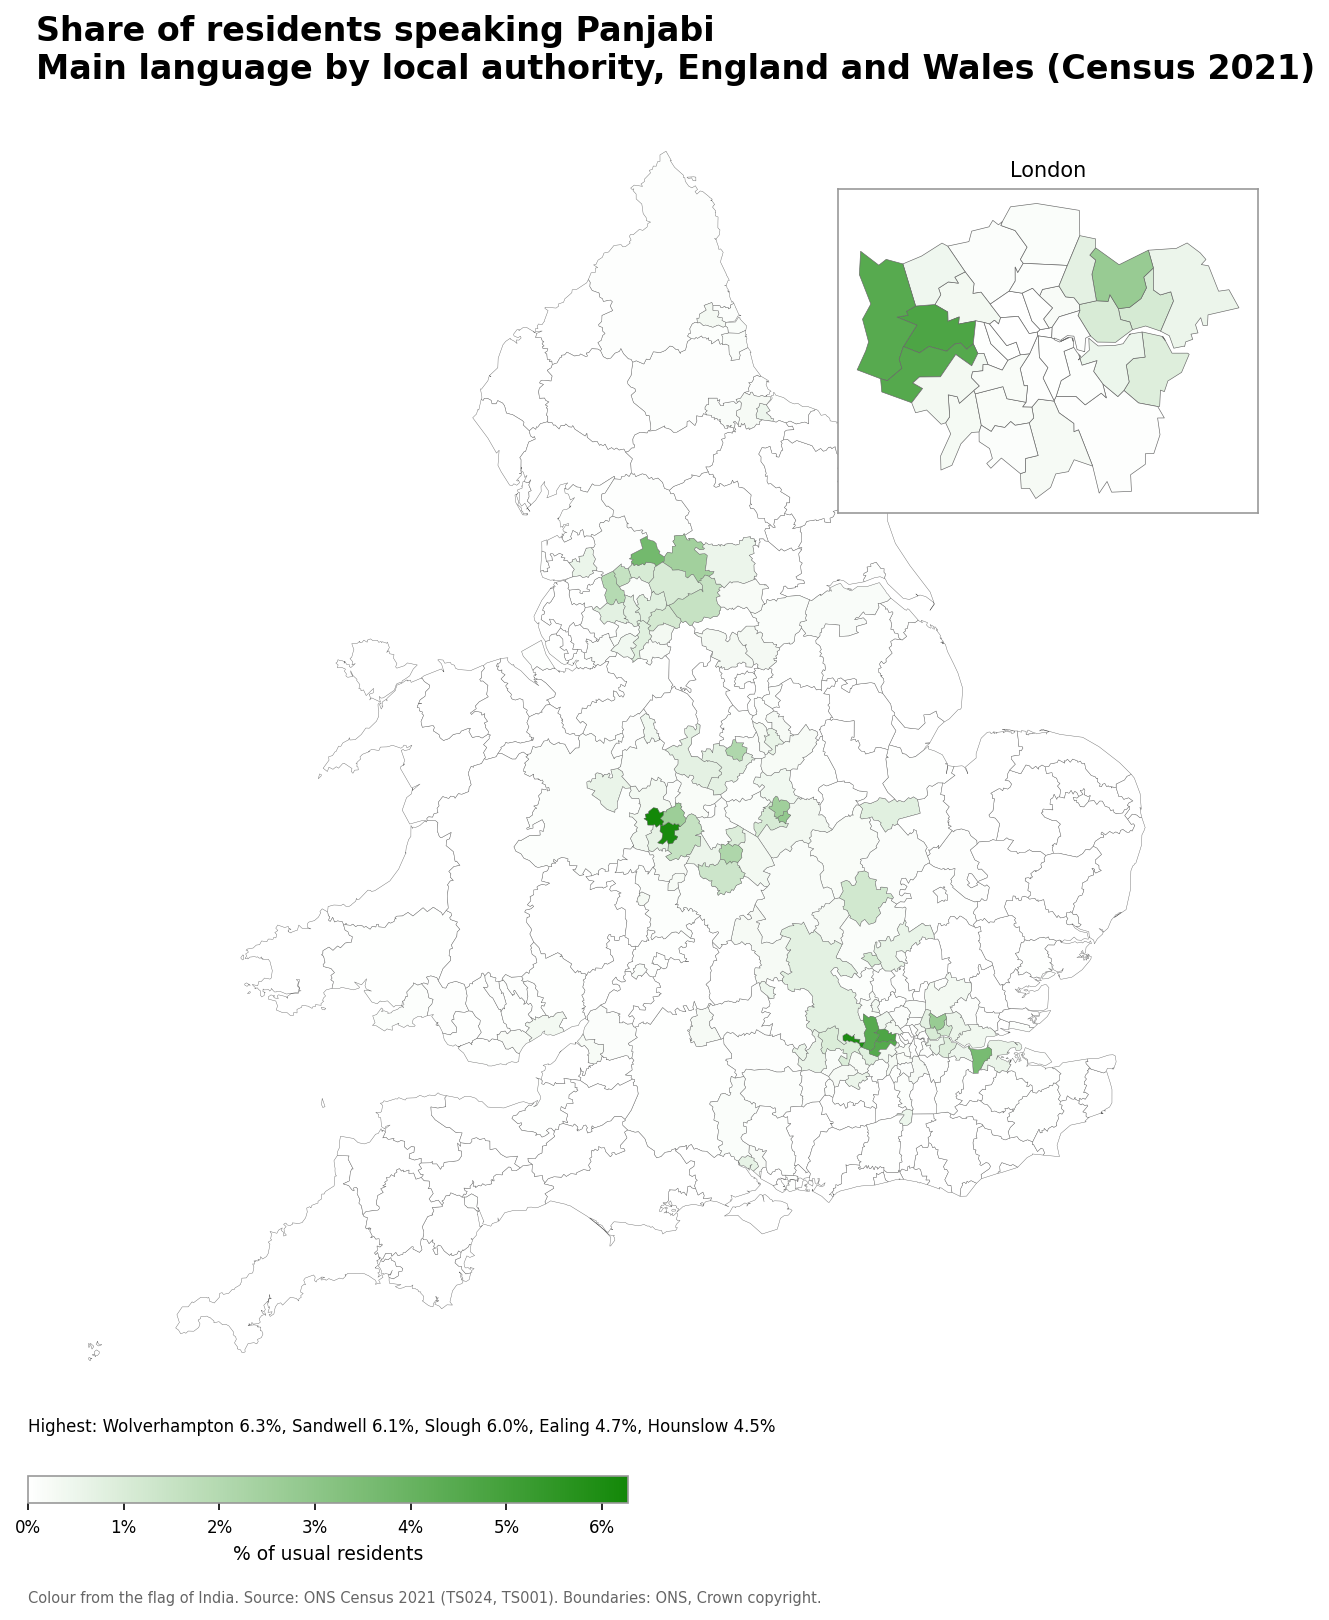
- Wolverhampton: 6.3% (16,538 speakers)
- Sandwell: 6.1% (20,984 speakers)
- Slough: 6.0% (9,527 speakers)
- Ealing: 4.7% (17,286 speakers)
- Hounslow: 4.5% (13,059 speakers)
Number of Pakistani Pahari speakers
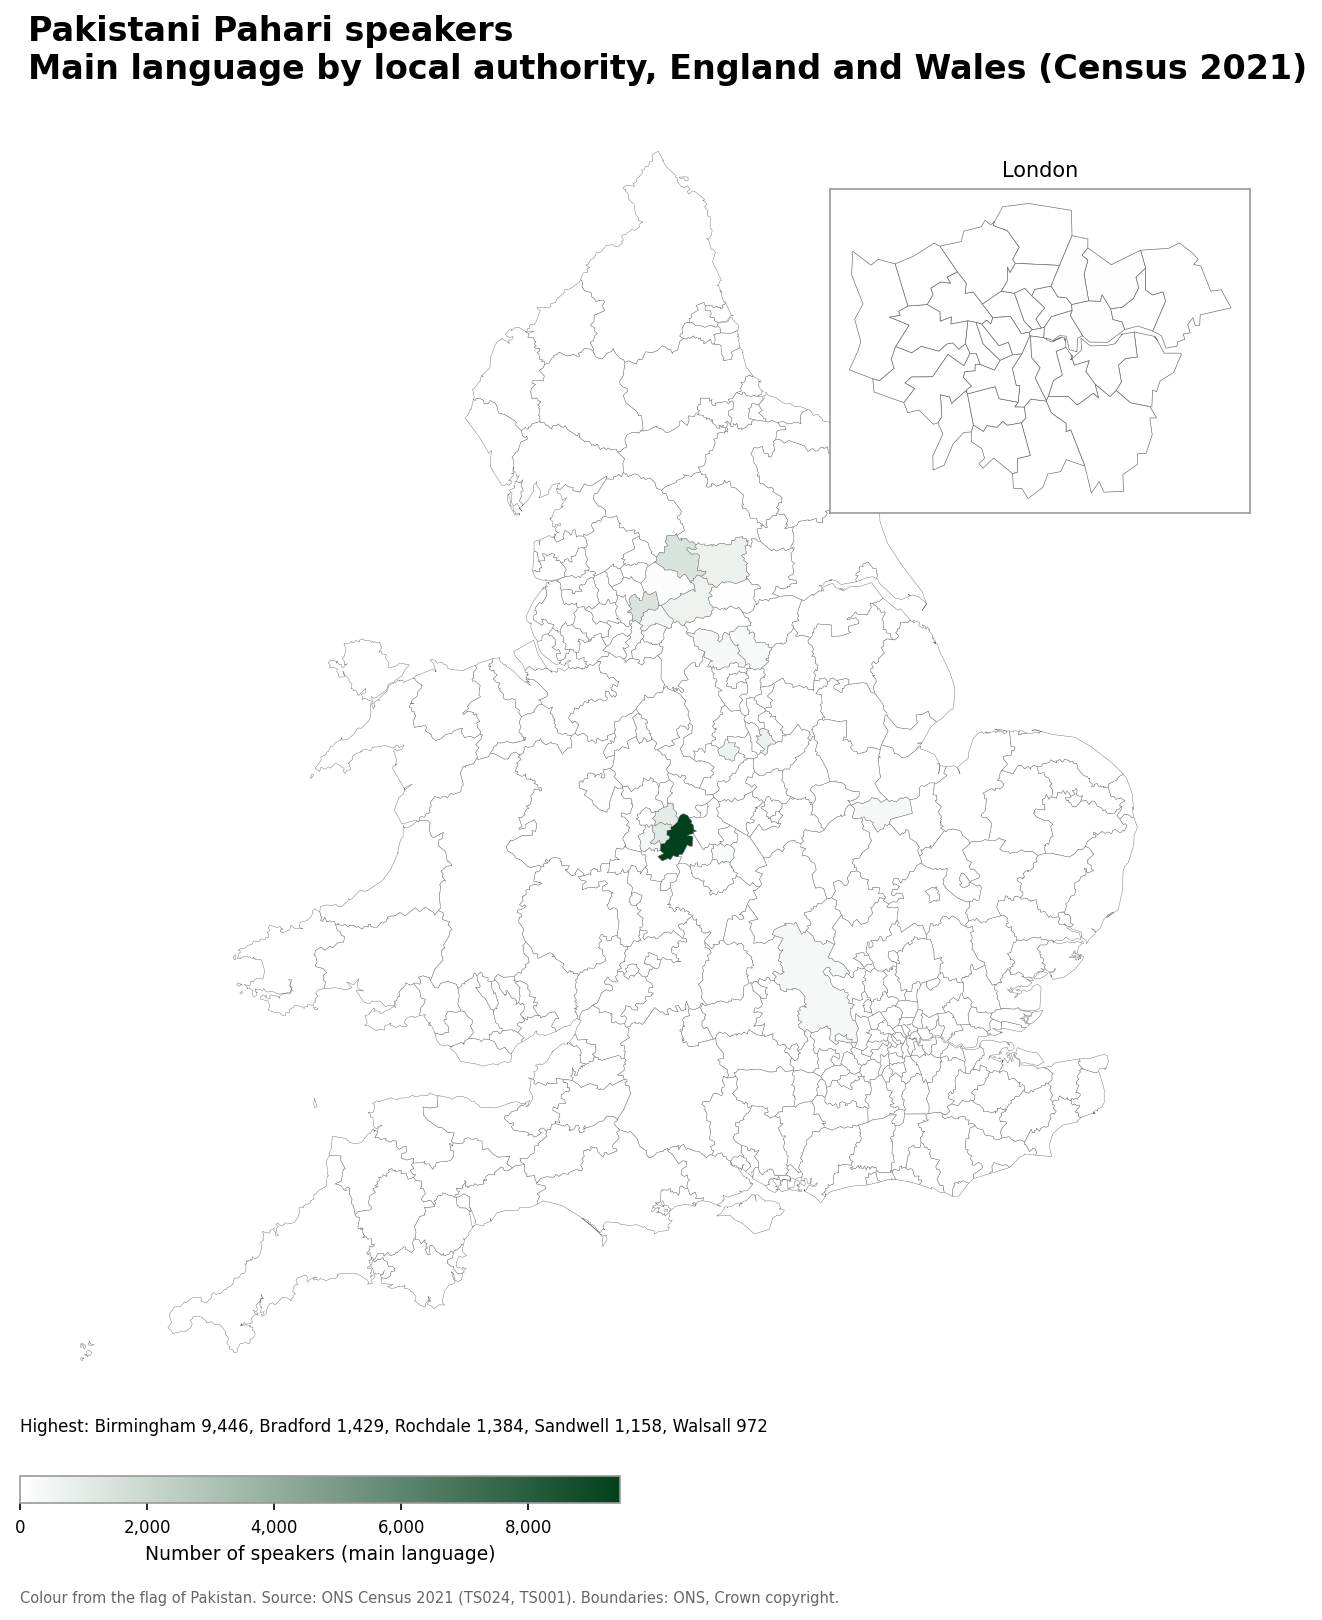
- Birmingham: 9,446
- Bradford: 1,429
- Rochdale: 1,384
- Sandwell: 1,158
- Walsall: 972
Pakistani Pahari speakers as a share of the population
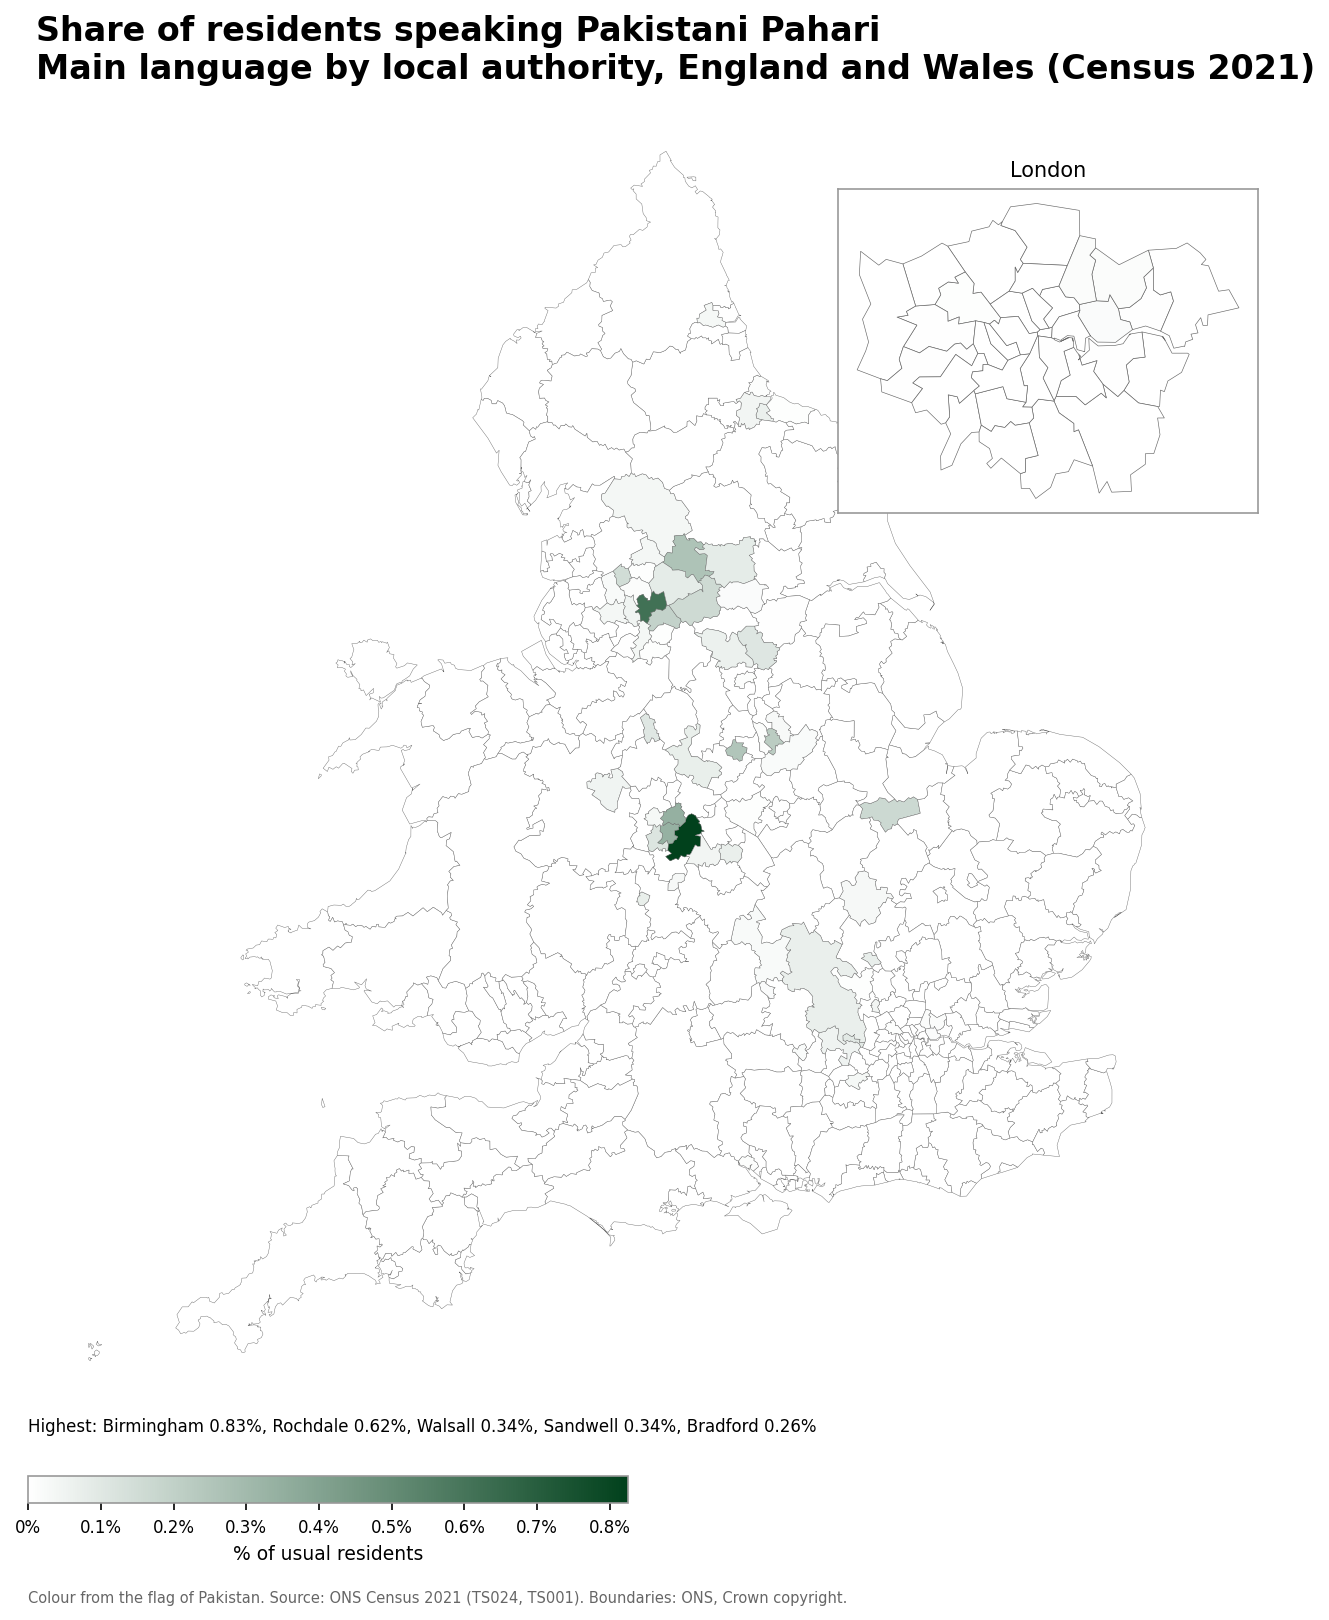
- Birmingham: 0.83% (9,446 speakers)
- Rochdale: 0.62% (1,384 speakers)
- Walsall: 0.34% (972 speakers)
- Sandwell: 0.34% (1,158 speakers)
- Bradford: 0.26% (1,429 speakers)
Number of Bengali speakers
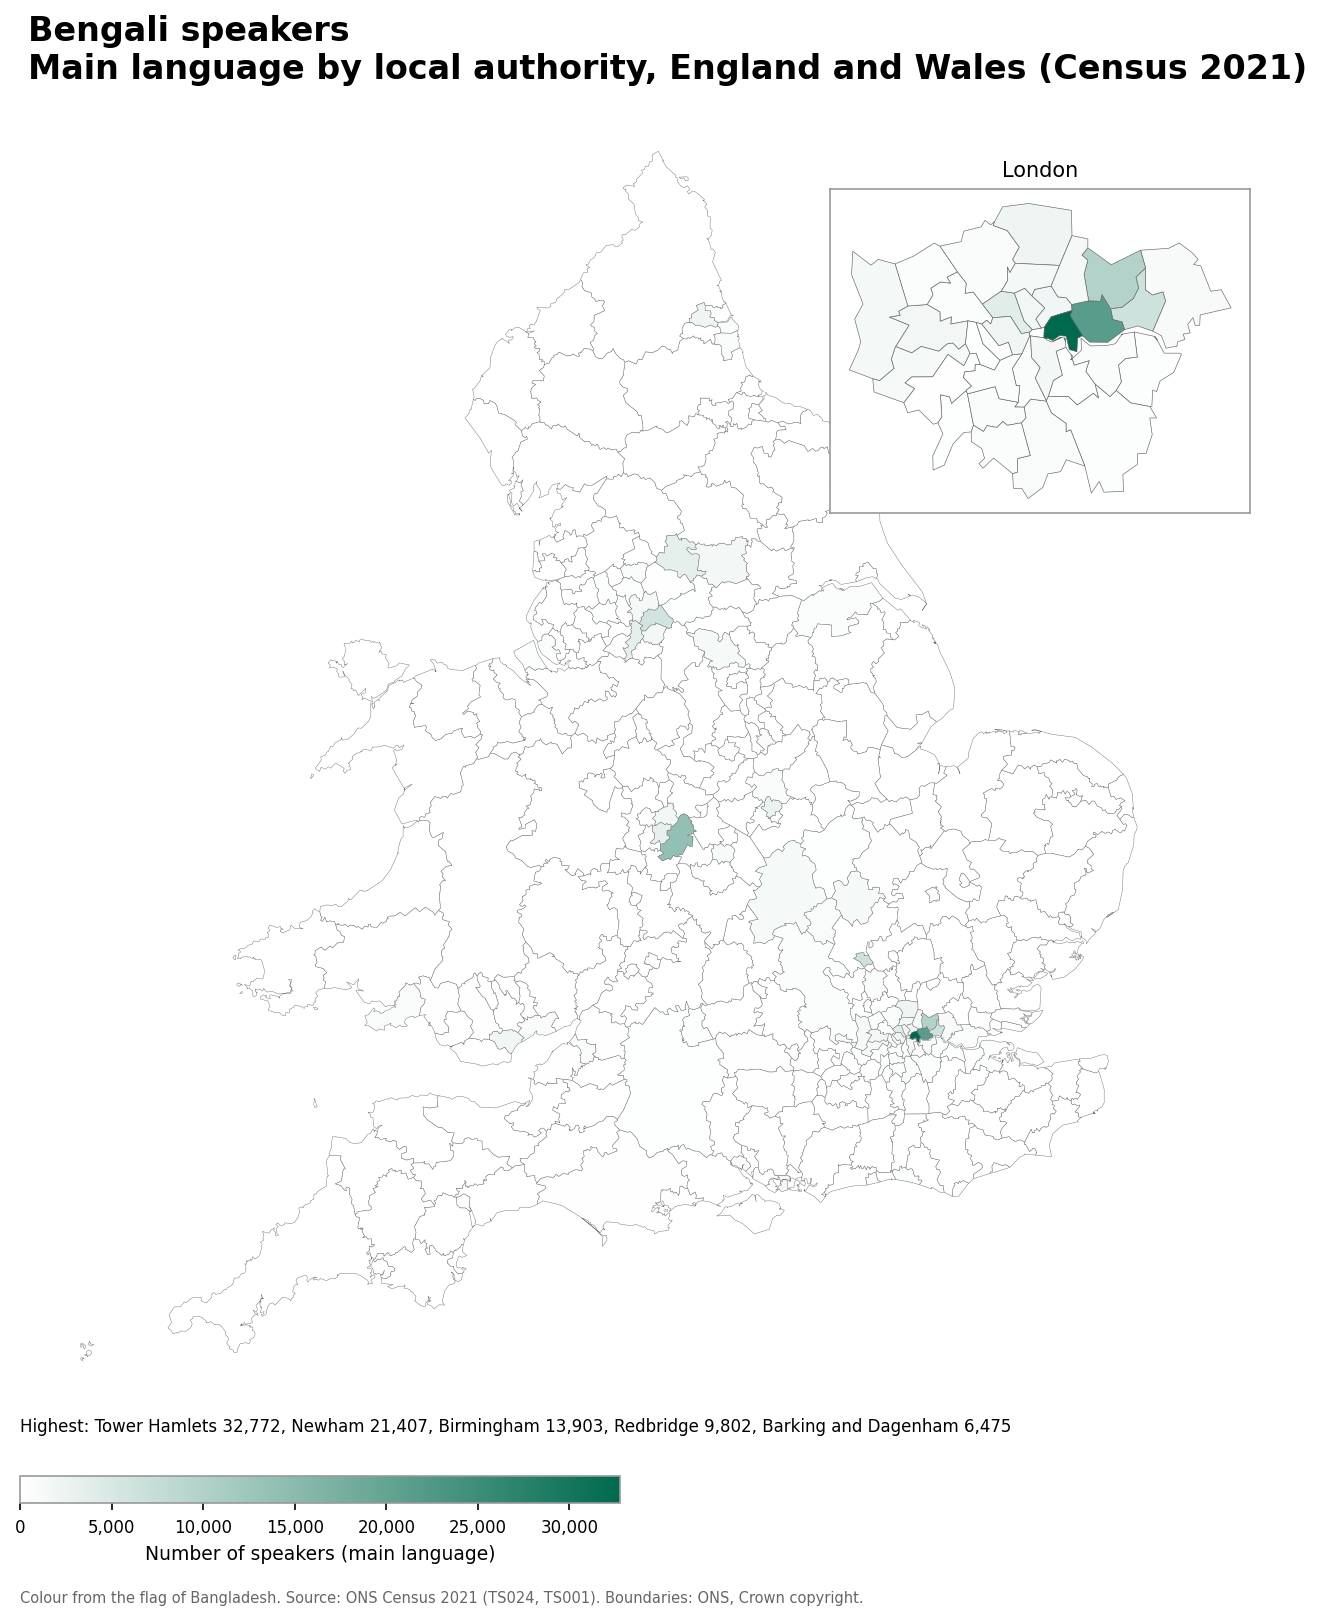
- Tower Hamlets: 32,772
- Newham: 21,407
- Birmingham: 13,903
- Redbridge: 9,802
- Barking and Dagenham: 6,475
Bengali speakers as a share of the population
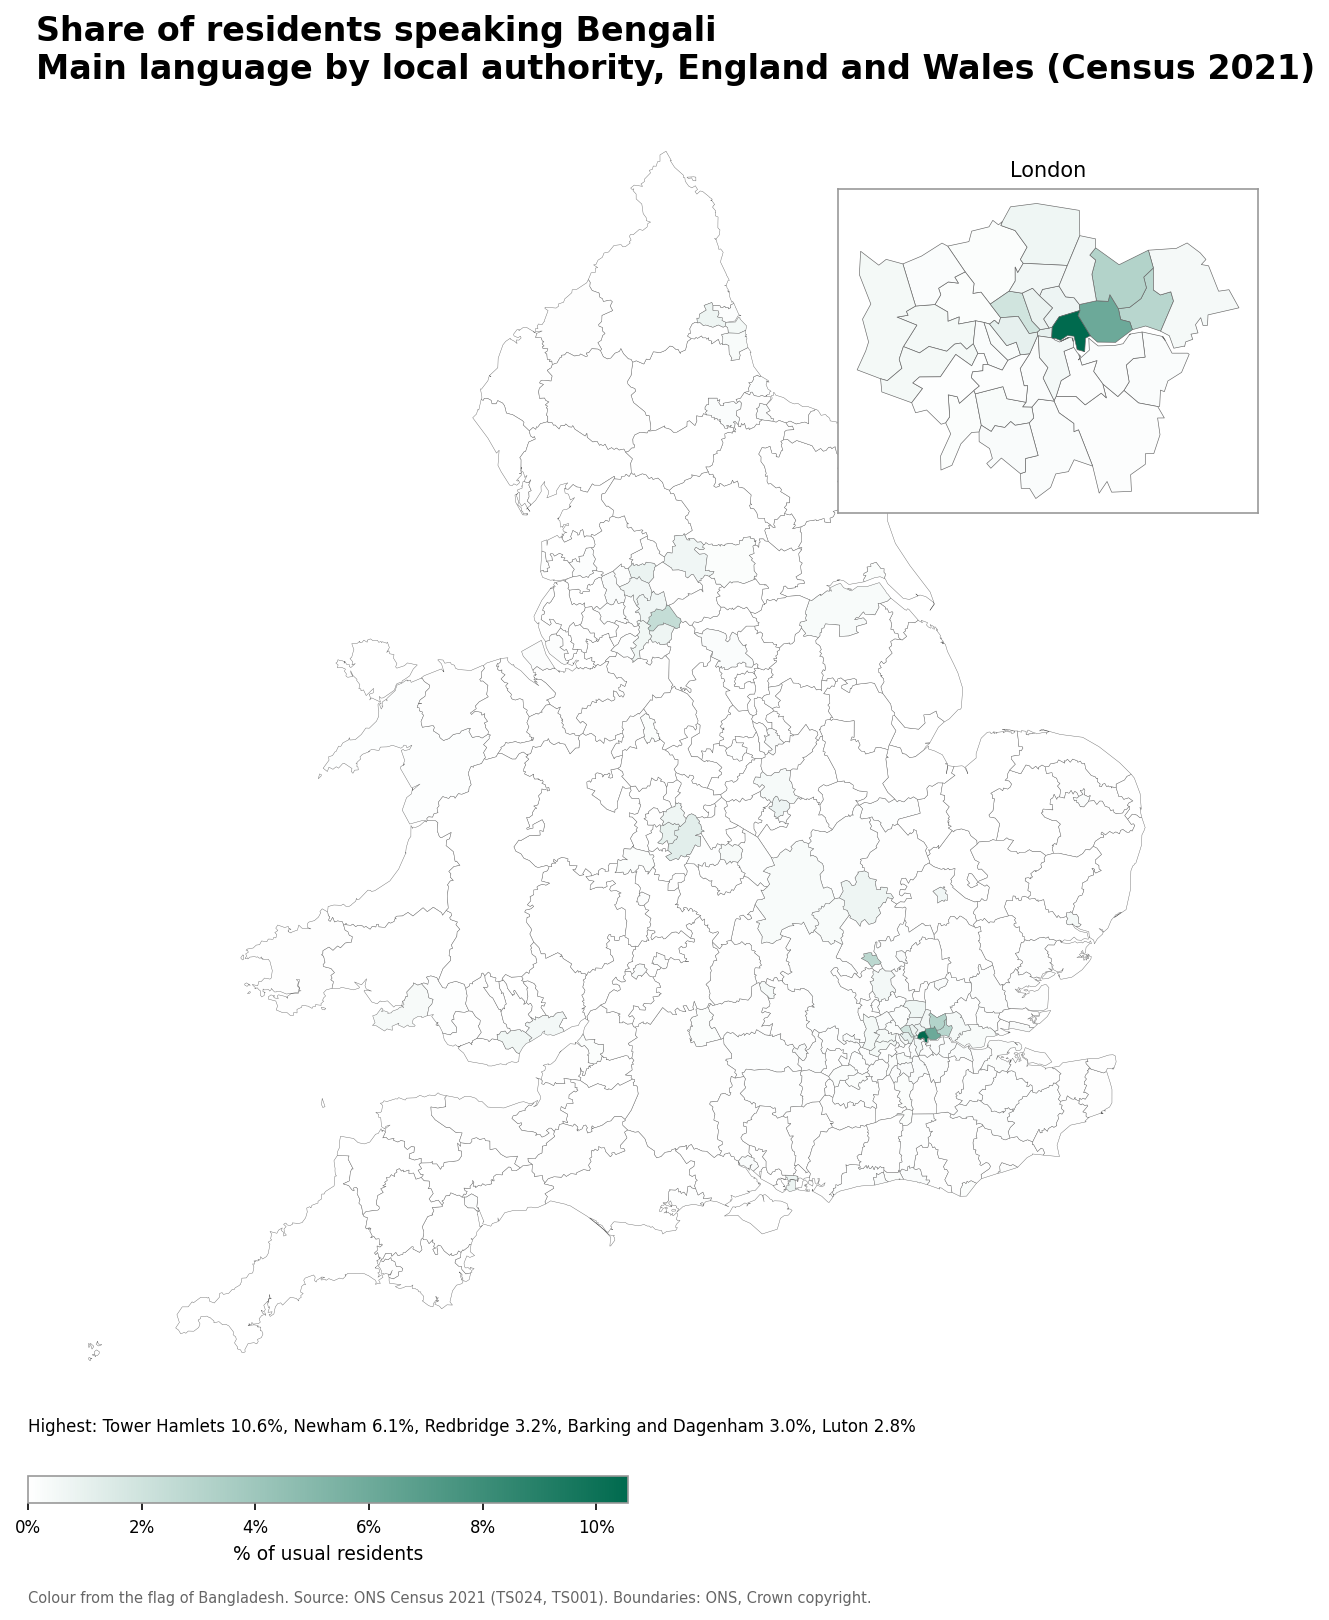
- Tower Hamlets: 10.6% (32,772 speakers)
- Newham: 6.1% (21,407 speakers)
- Redbridge: 3.2% (9,802 speakers)
- Barking and Dagenham: 3.0% (6,475 speakers)
- Luton: 2.8% (6,311 speakers)
Number of Gujarati speakers
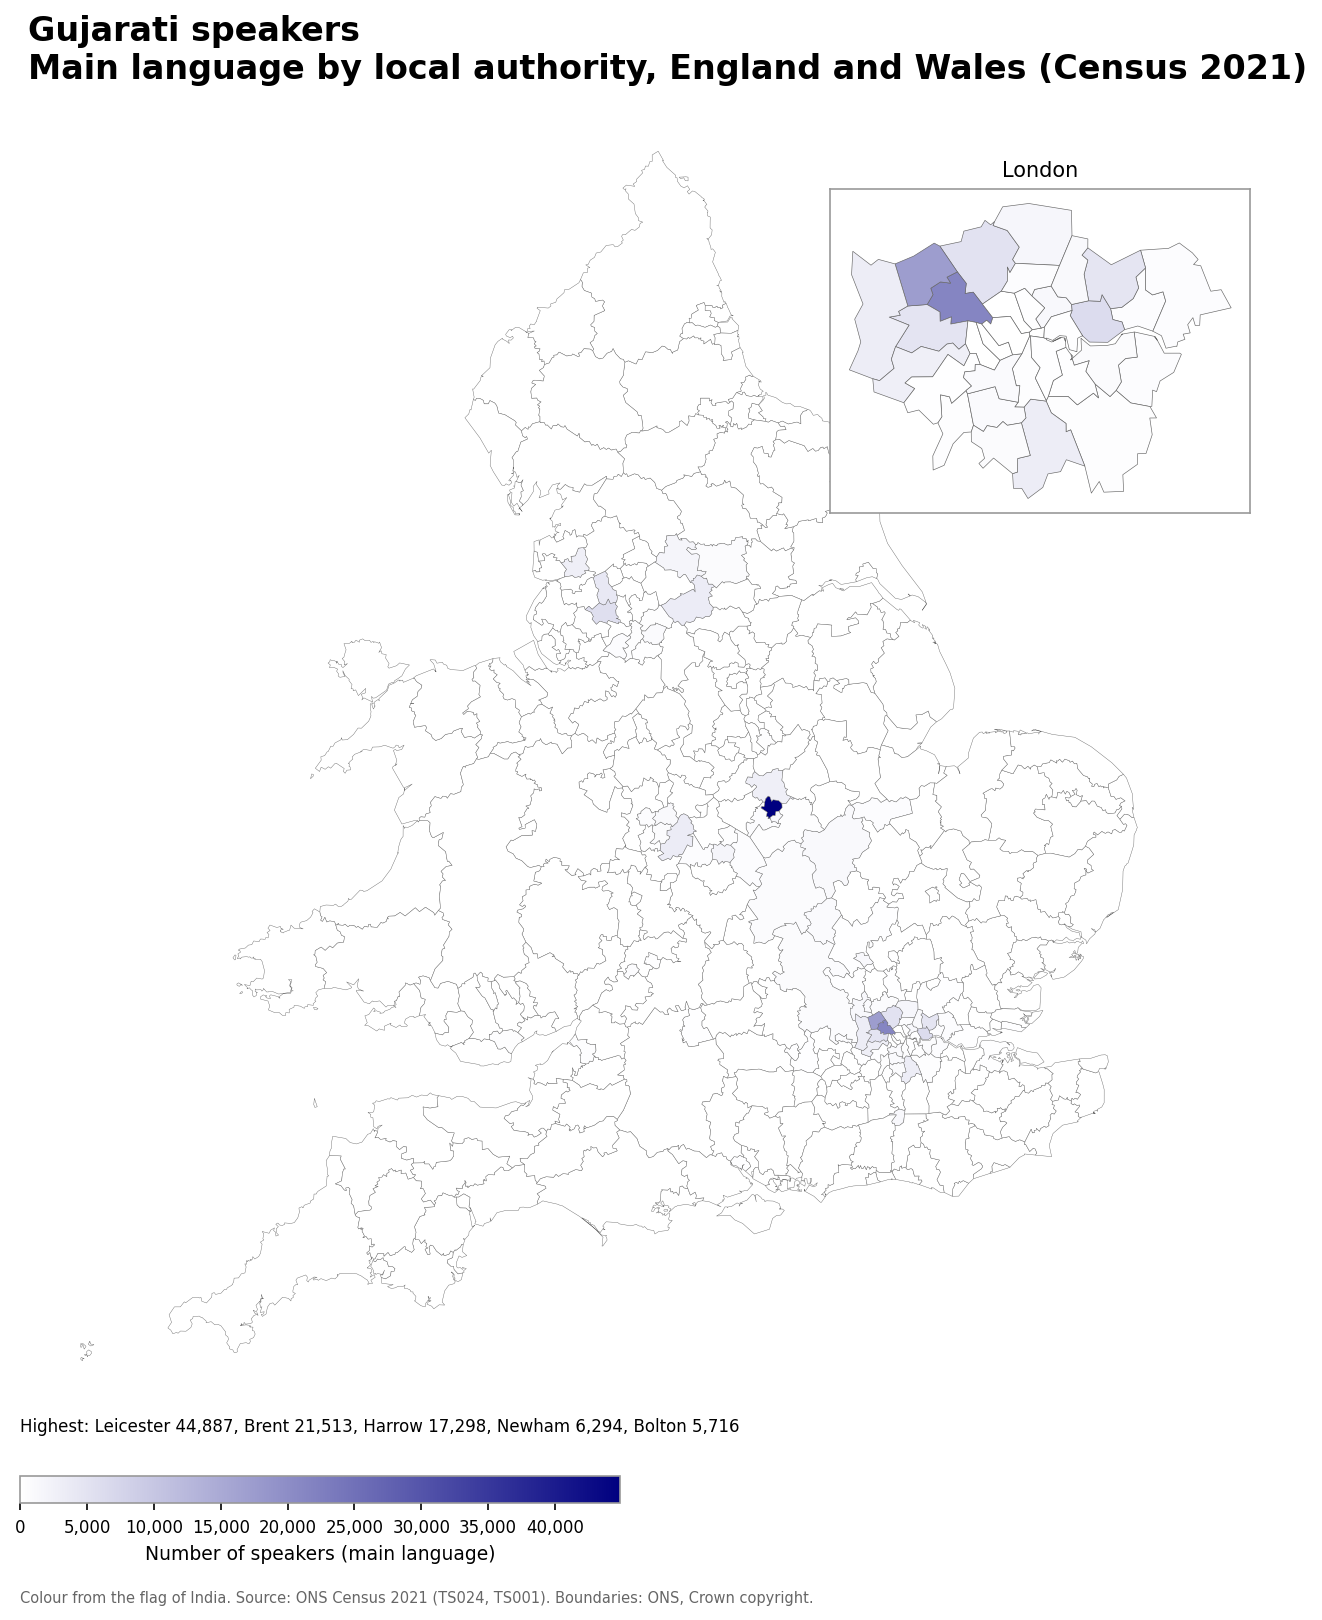
- Leicester: 44,887
- Brent: 21,513
- Harrow: 17,298
- Newham: 6,294
- Bolton: 5,716
Gujarati speakers as a share of the population
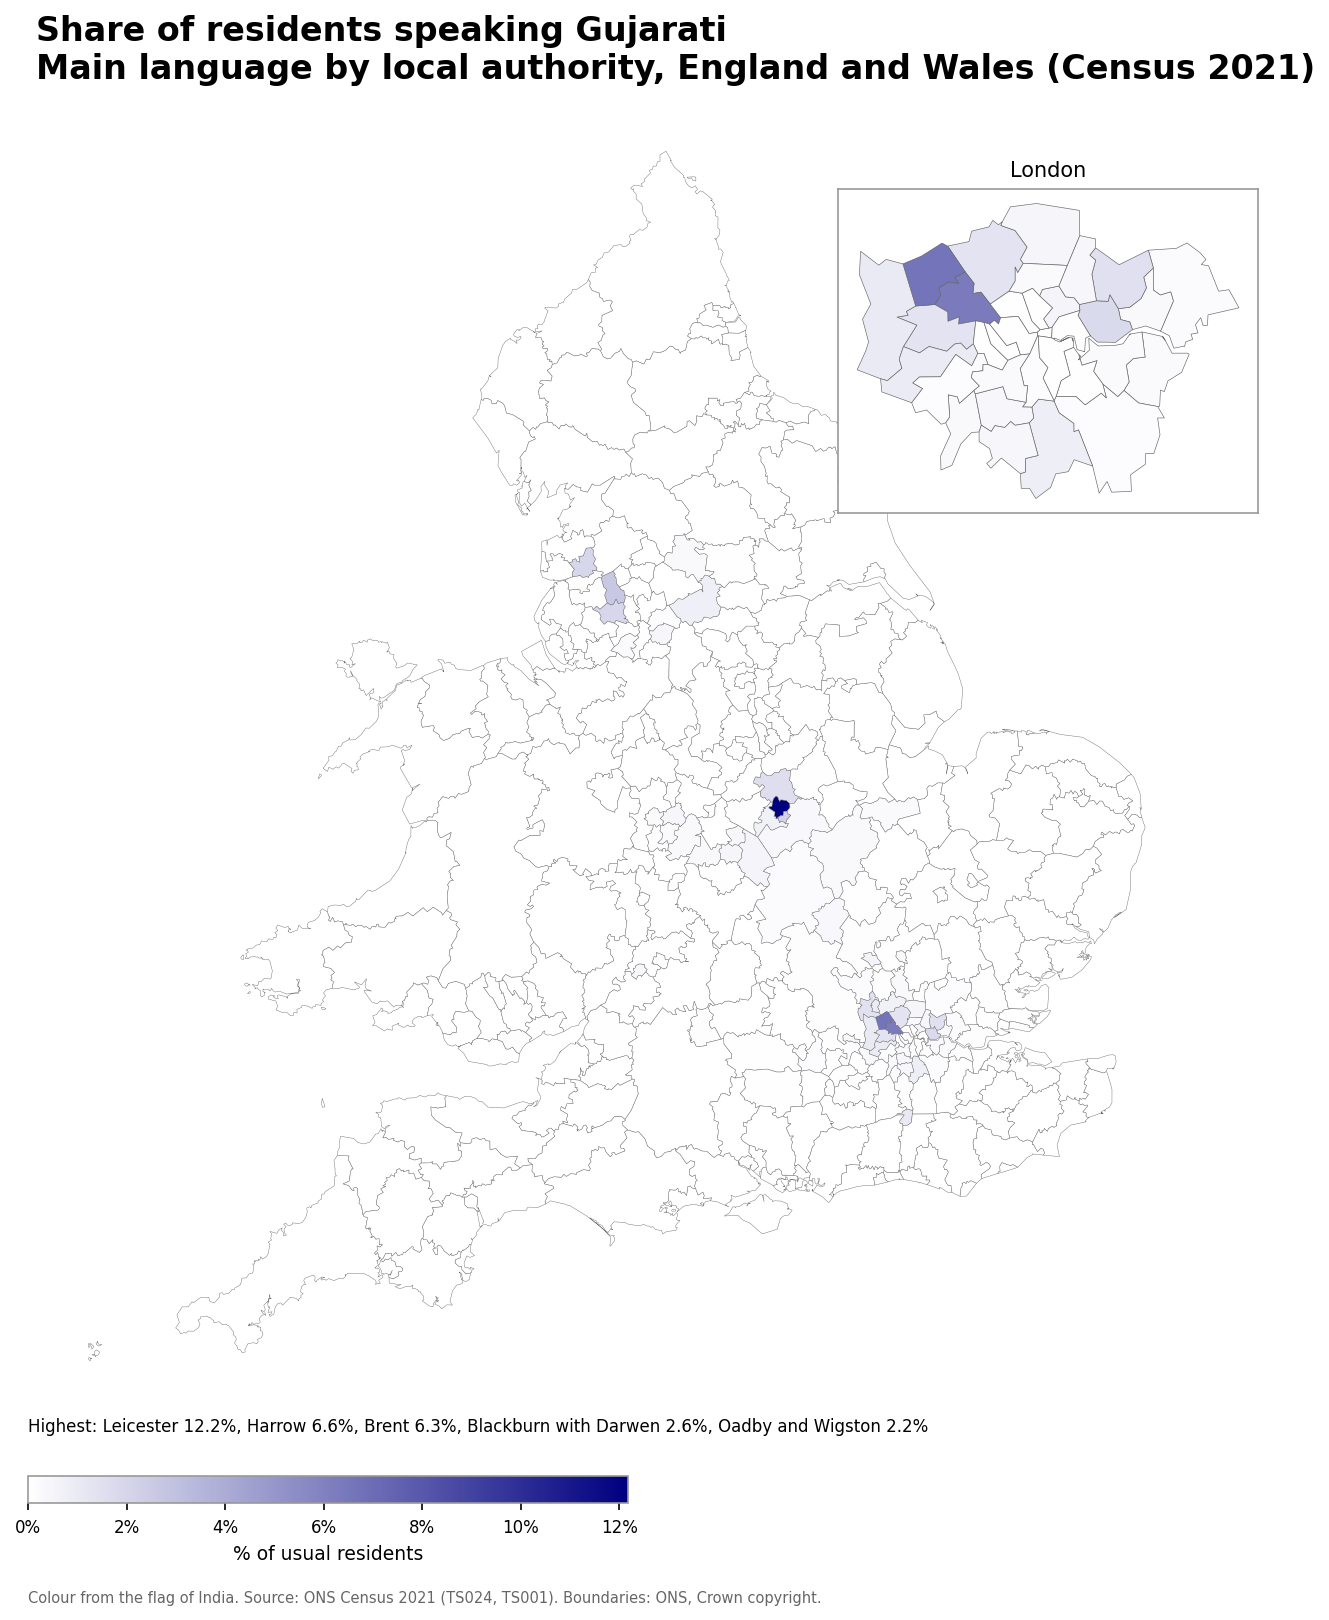
- Leicester: 12.2% (44,887 speakers)
- Harrow: 6.6% (17,298 speakers)
- Brent: 6.3% (21,513 speakers)
- Blackburn with Darwen: 2.6% (4,088 speakers)
- Oadby and Wigston: 2.2% (1,276 speakers)
Number of Marathi speakers
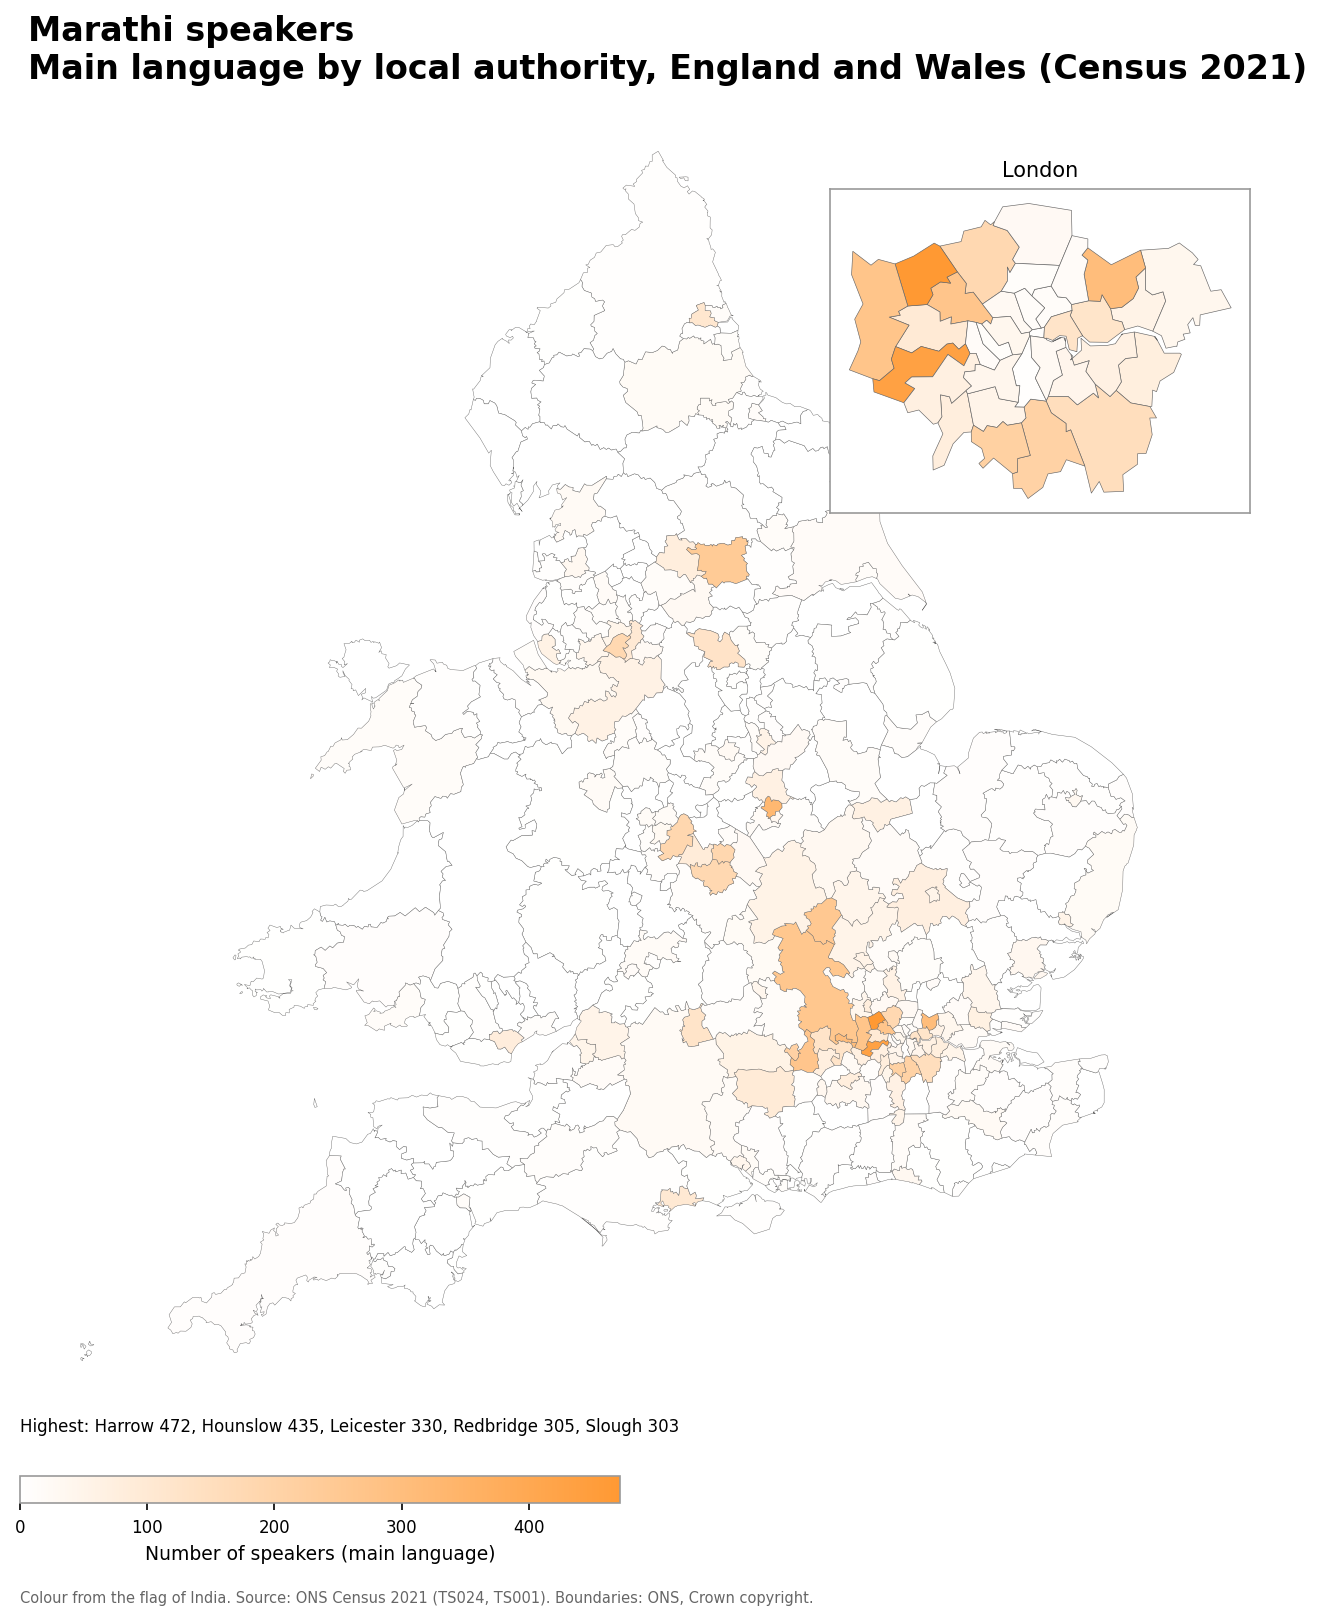
- Harrow: 472
- Hounslow: 435
- Leicester: 330
- Redbridge: 305
- Slough: 303
Marathi speakers as a share of the population
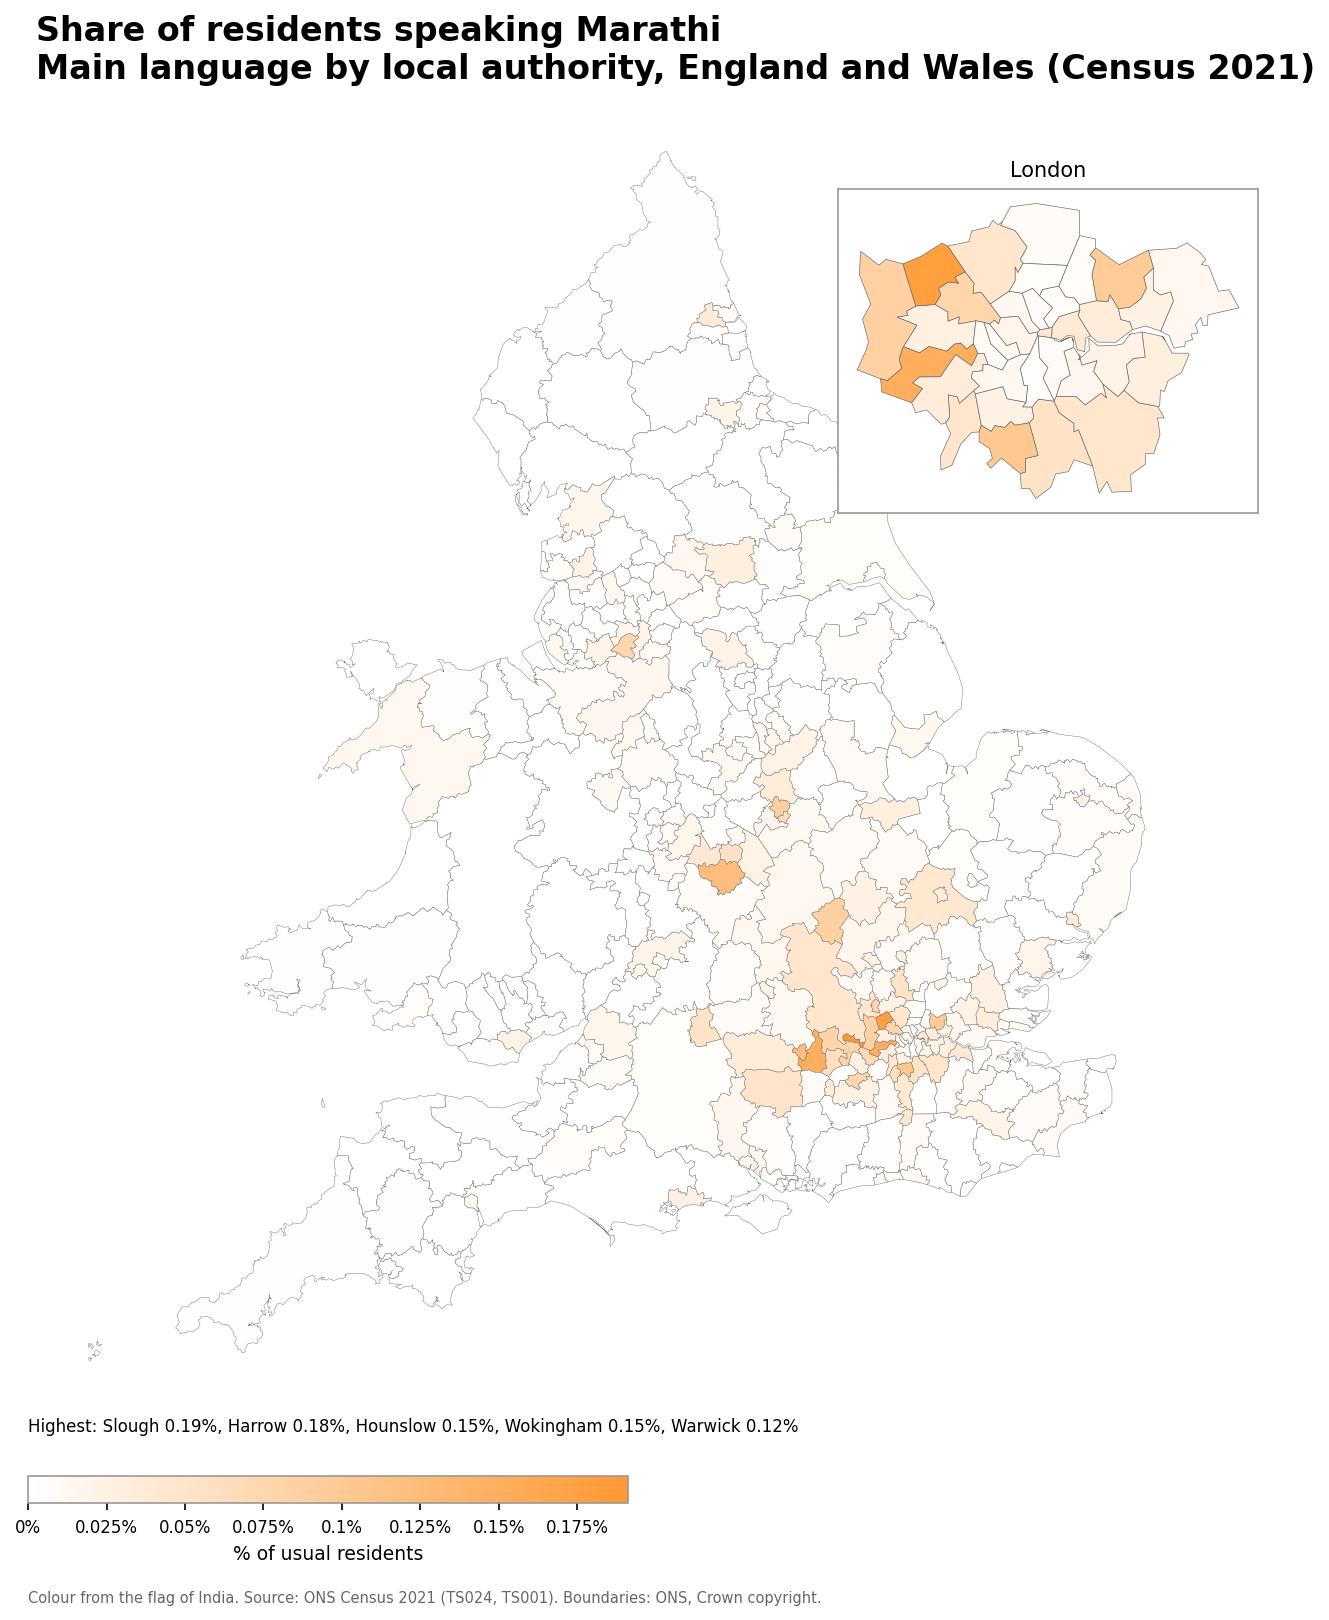
- Slough: 0.19% (303 speakers)
- Harrow: 0.18% (472 speakers)
- Hounslow: 0.15% (435 speakers)
- Wokingham: 0.15% (267 speakers)
- Warwick: 0.12% (181 speakers)
Number of Telugu speakers
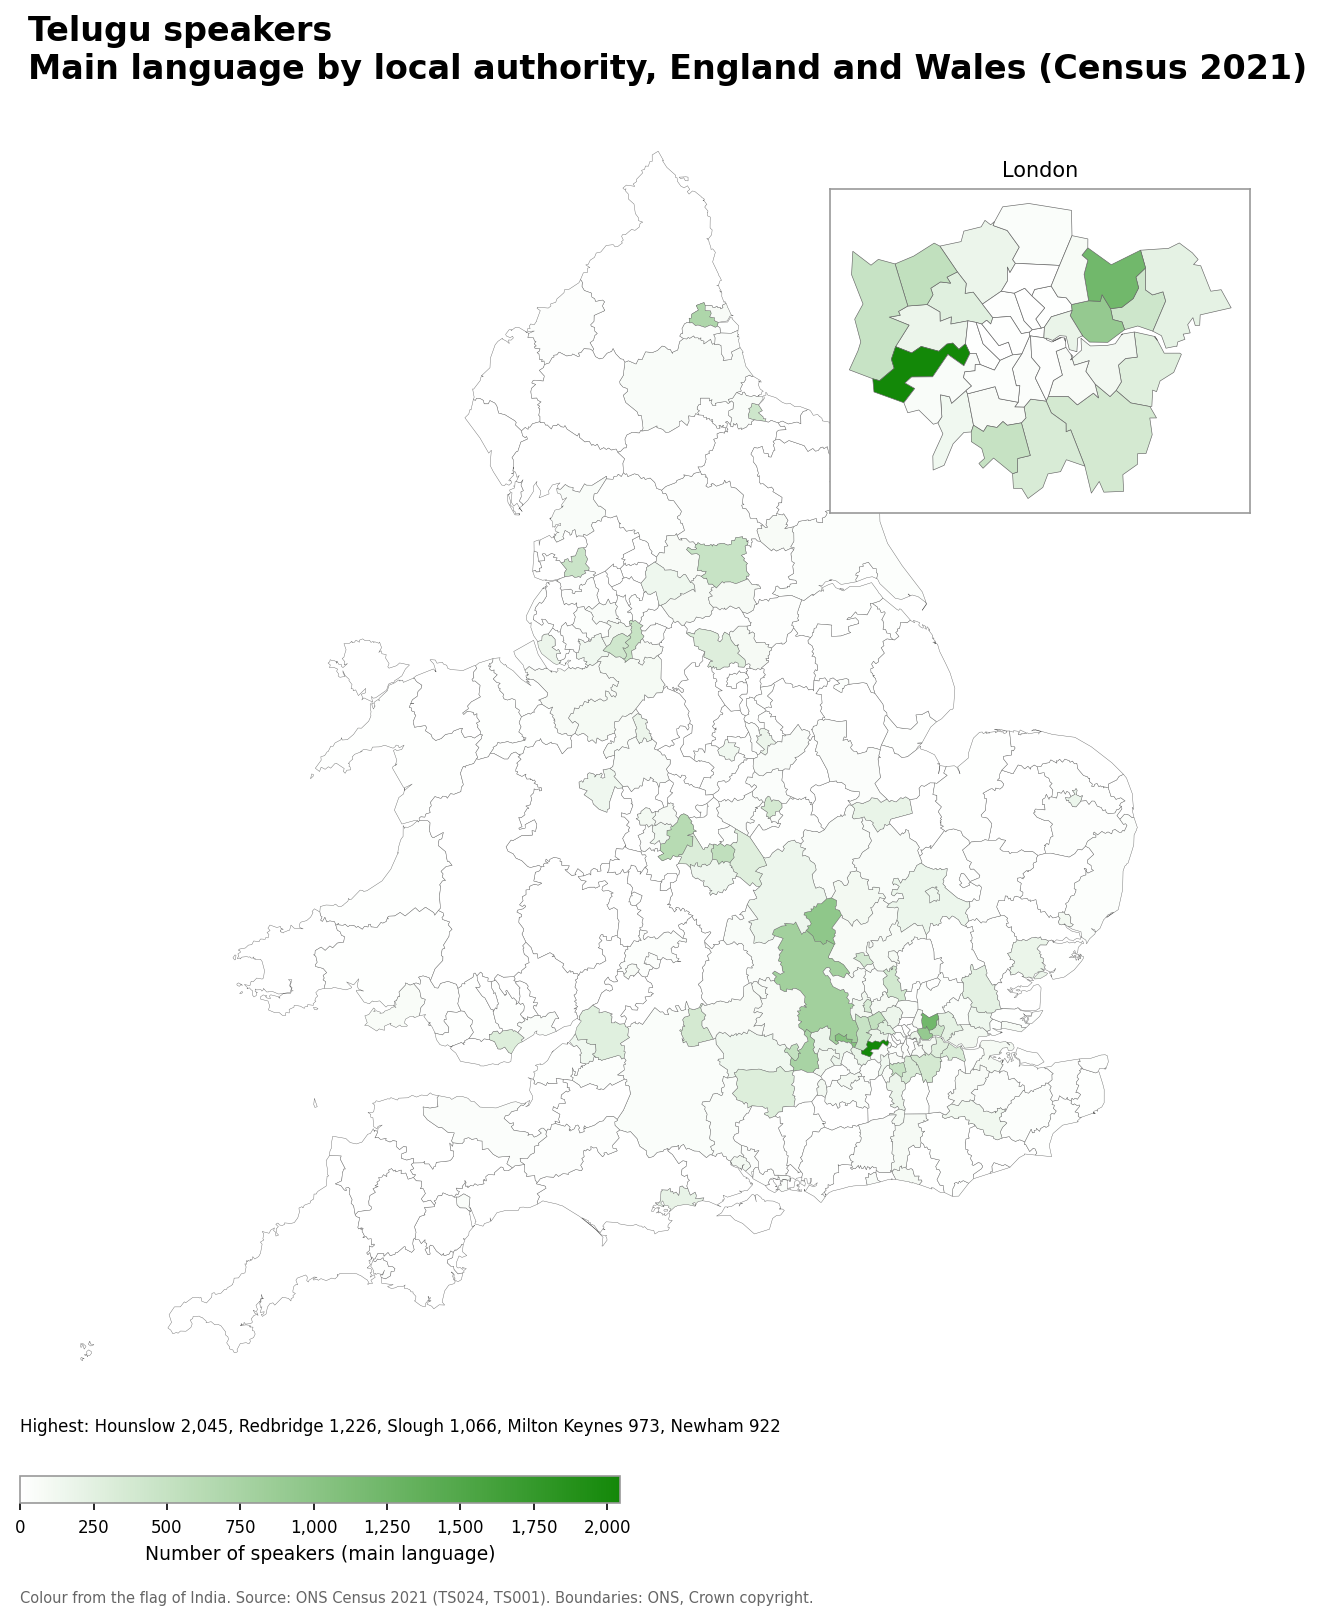
- Hounslow: 2,045
- Redbridge: 1,226
- Slough: 1,066
- Milton Keynes: 973
- Newham: 922
Telugu speakers as a share of the population
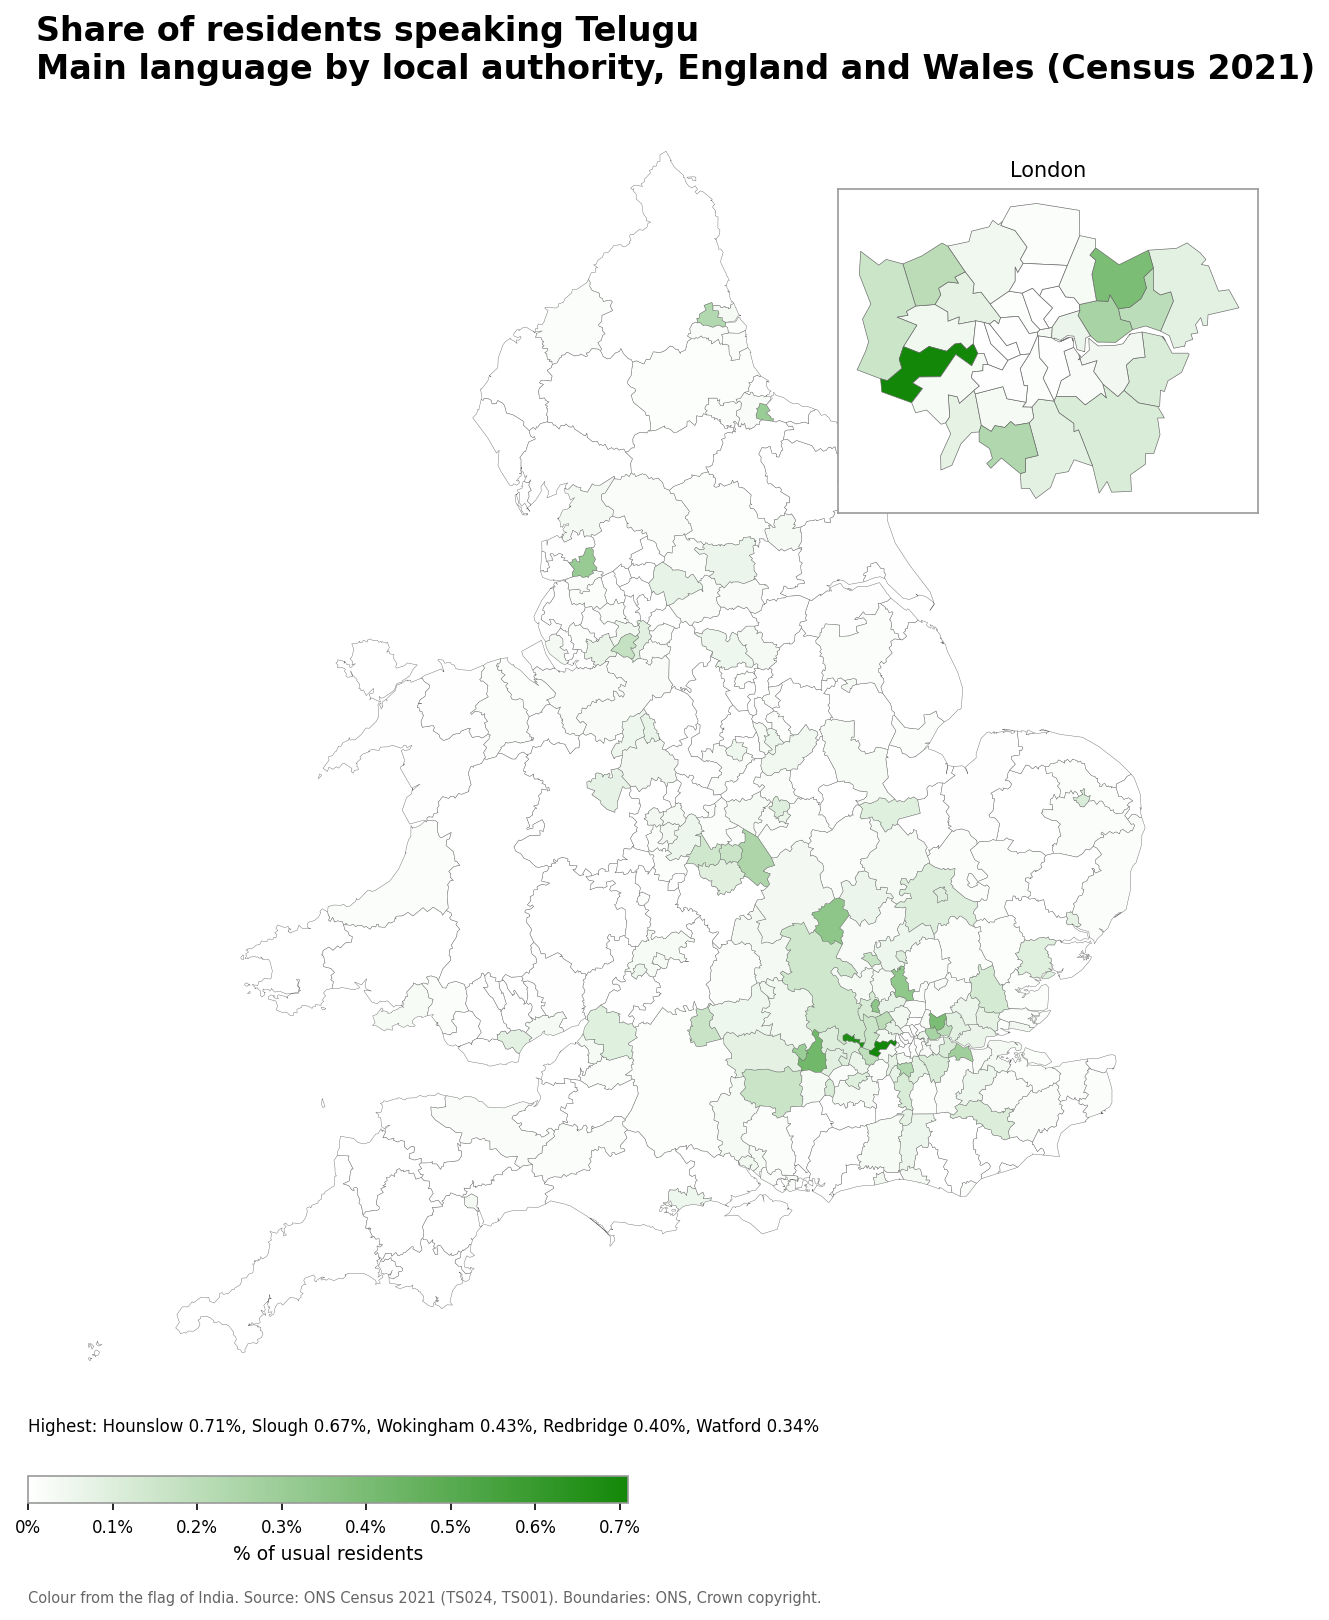
- Hounslow: 0.71% (2,045 speakers)
- Slough: 0.67% (1,066 speakers)
- Wokingham: 0.43% (757 speakers)
- Redbridge: 0.40% (1,226 speakers)
- Watford: 0.34% (350 speakers)
Number of Tamil speakers
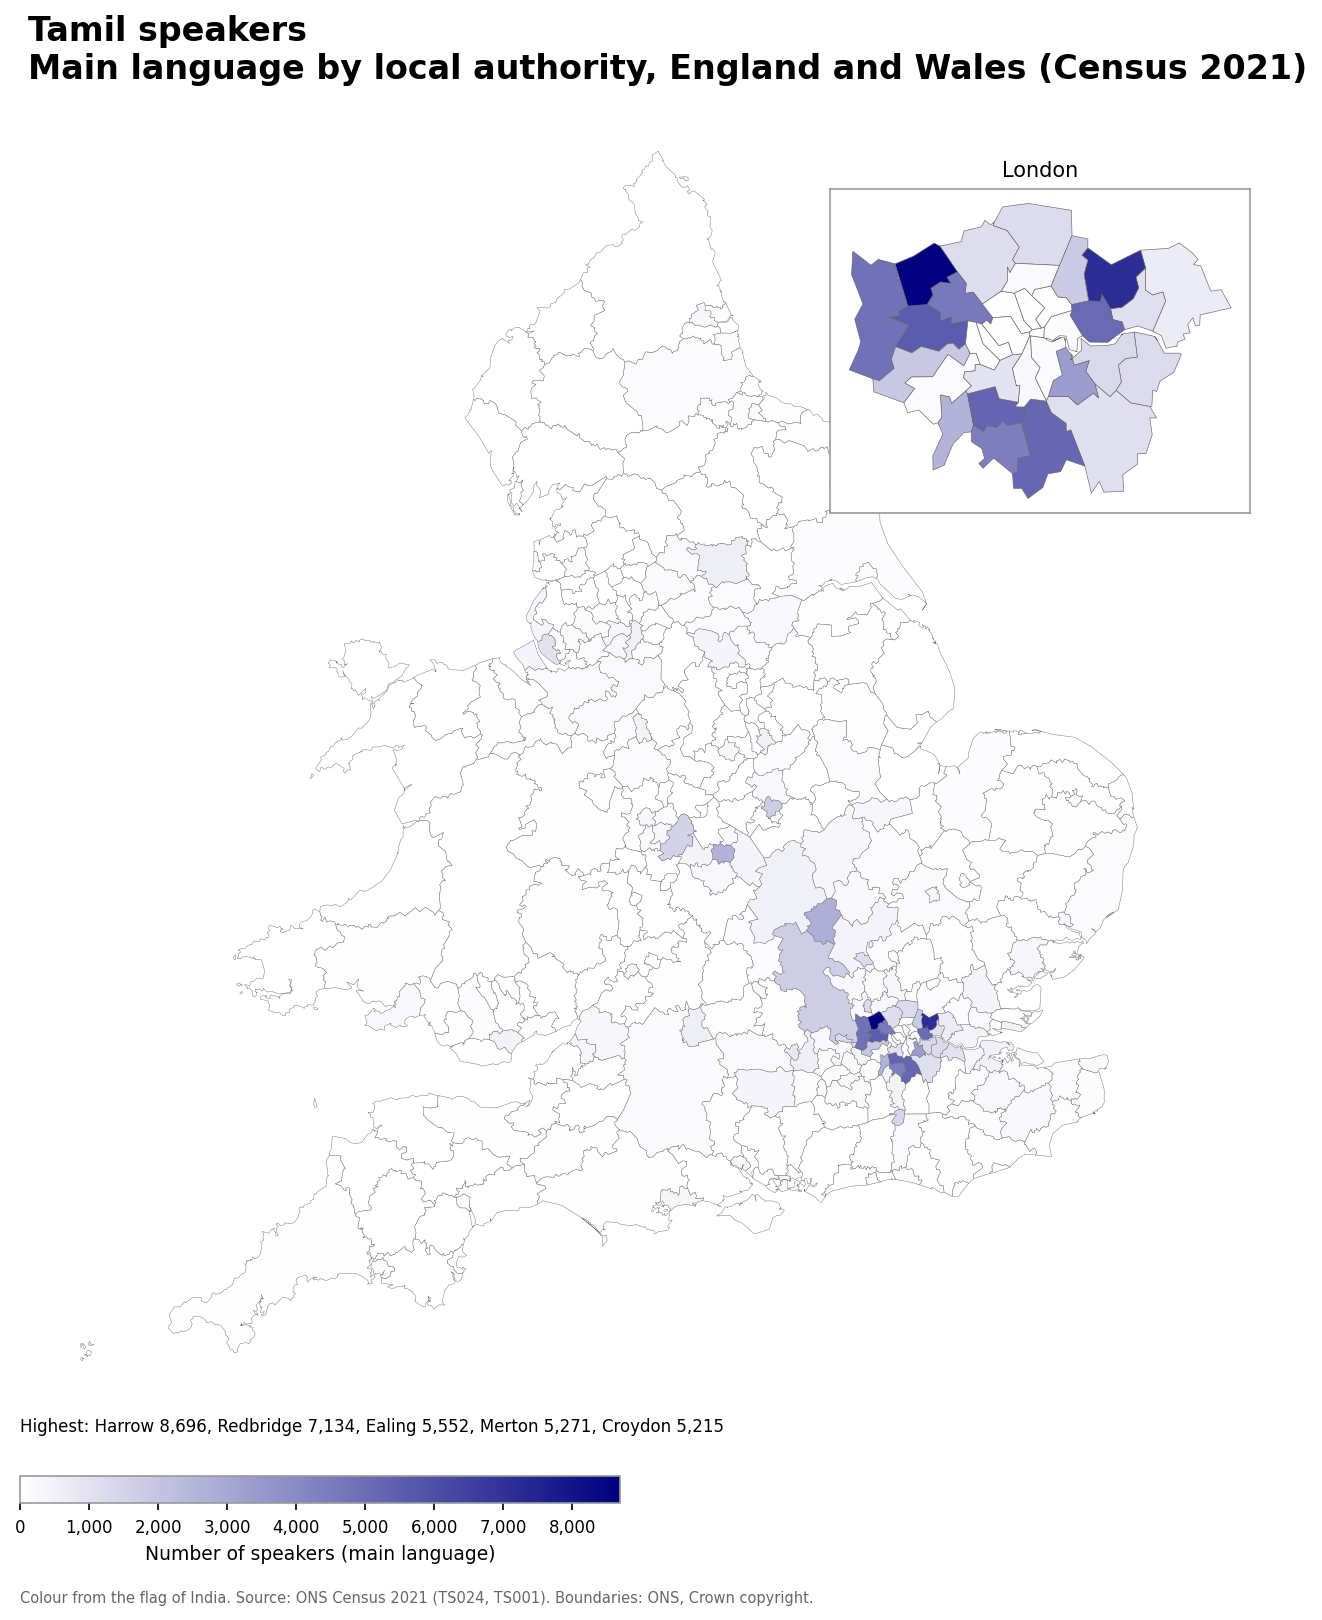
- Harrow: 8,696
- Redbridge: 7,134
- Ealing: 5,552
- Merton: 5,271
- Croydon: 5,215
Tamil speakers as a share of the population
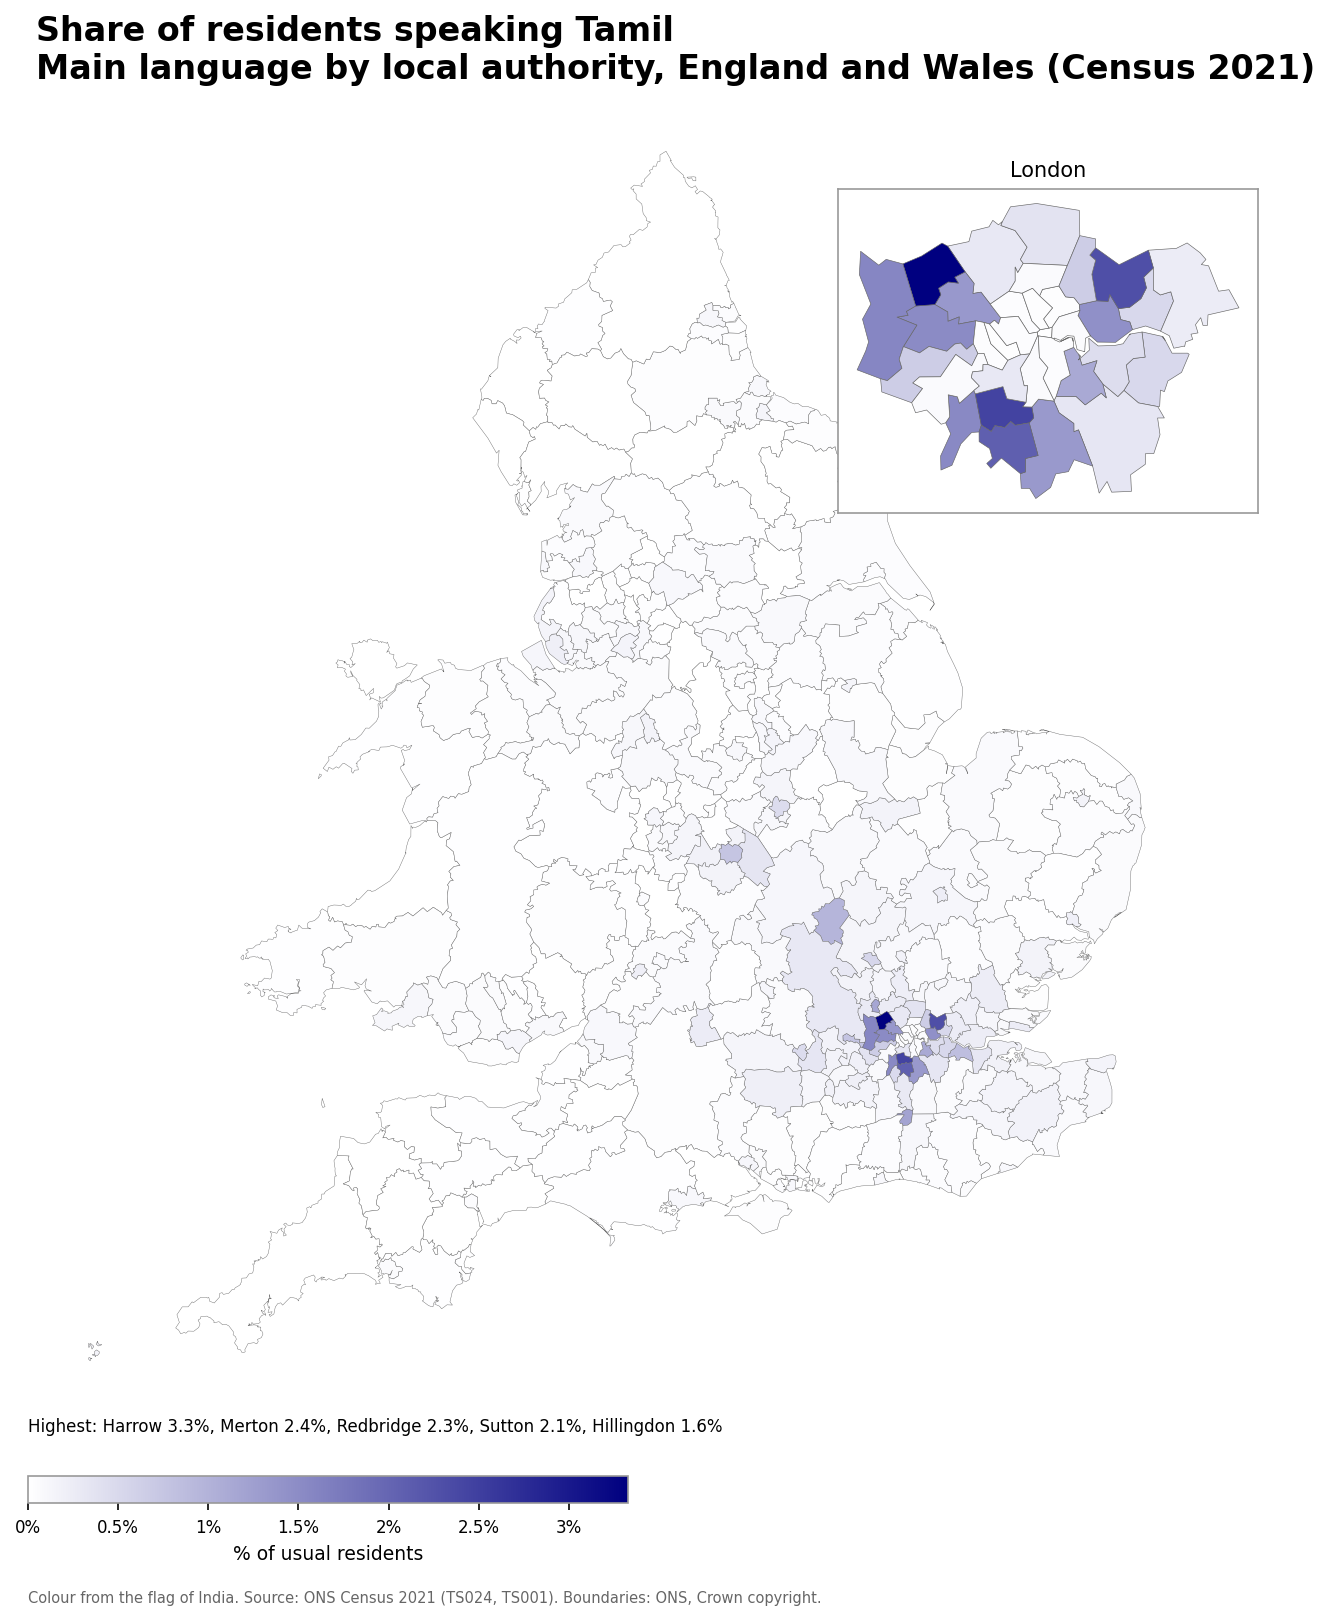
- Harrow: 3.3% (8,696 speakers)
- Merton: 2.4% (5,271 speakers)
- Redbridge: 2.3% (7,134 speakers)
- Sutton: 2.1% (4,383 speakers)
- Hillingdon: 1.6% (4,834 speakers)
Number of Malayalam speakers
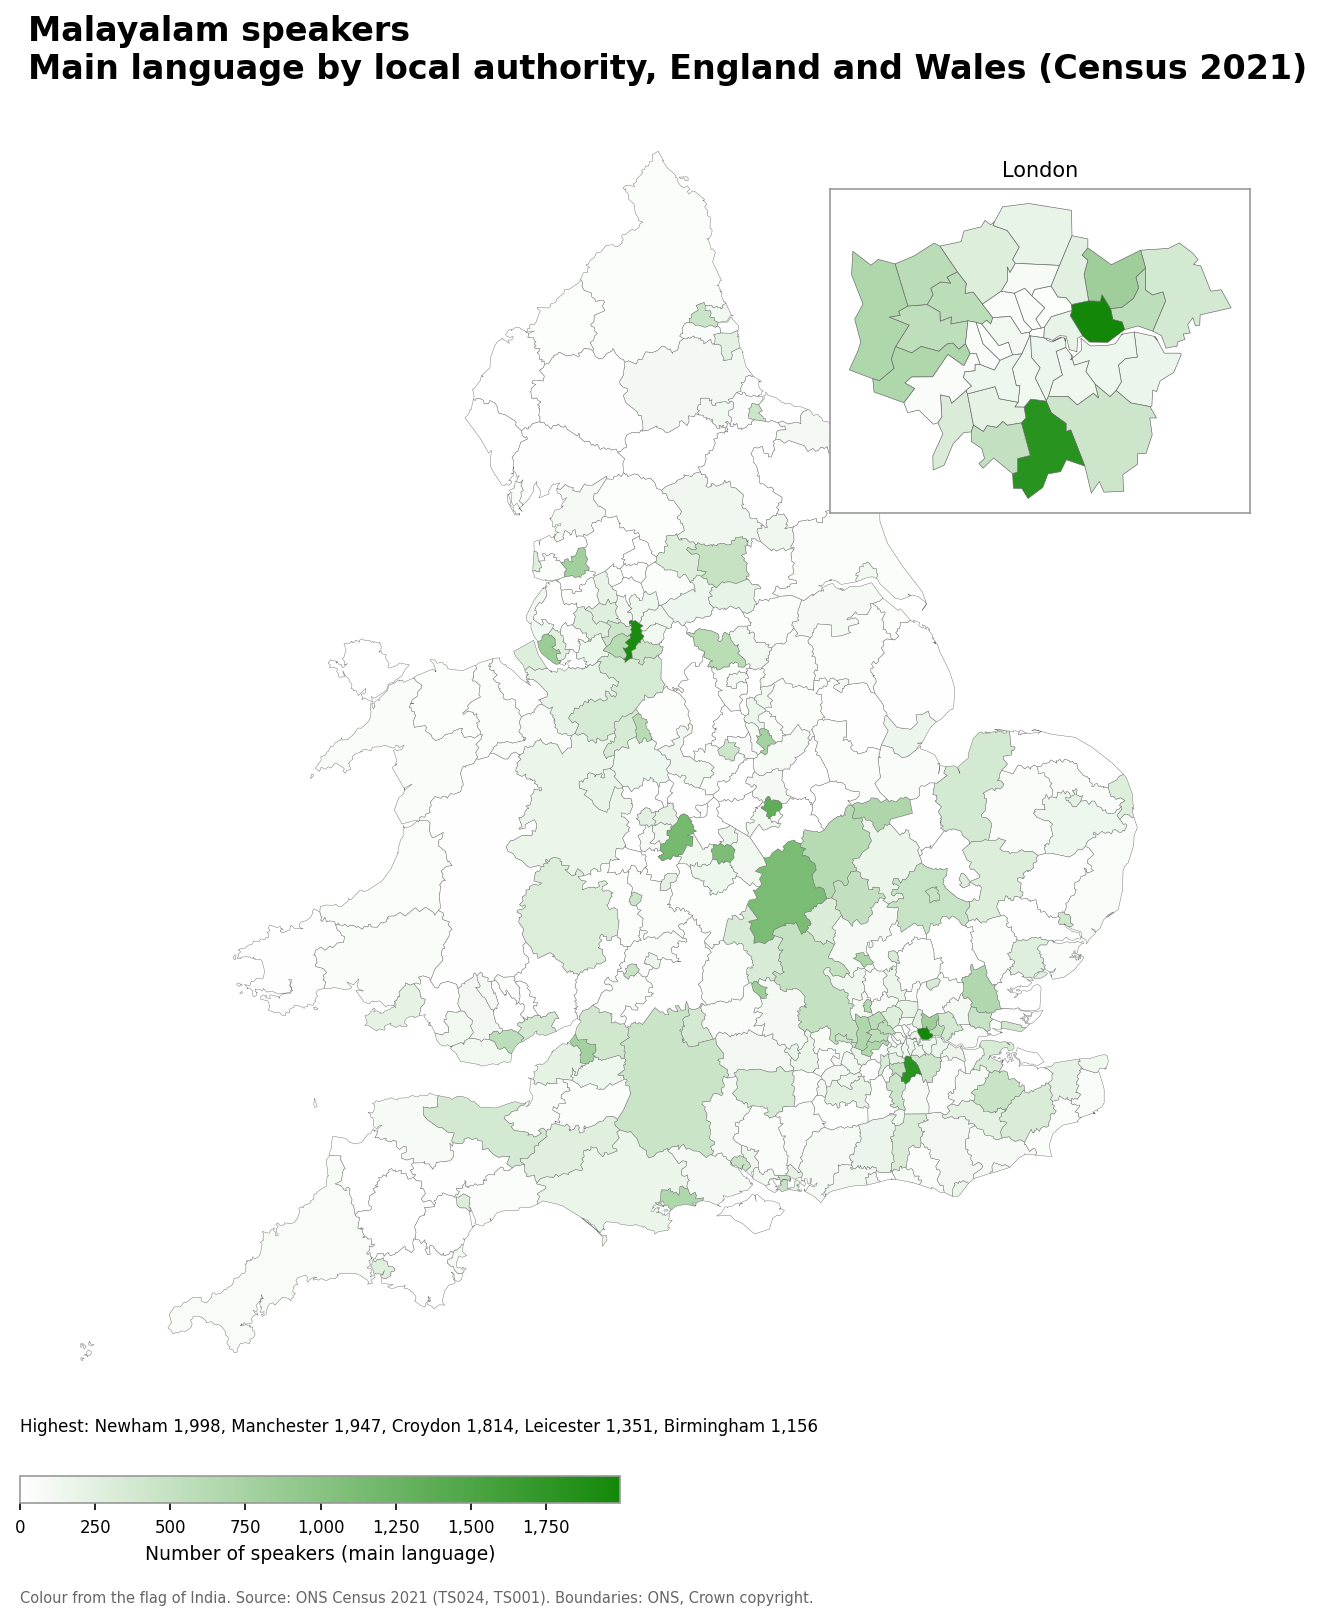
- Newham: 1,998
- Manchester: 1,947
- Croydon: 1,814
- Leicester: 1,351
- Birmingham: 1,156
Malayalam speakers as a share of the population
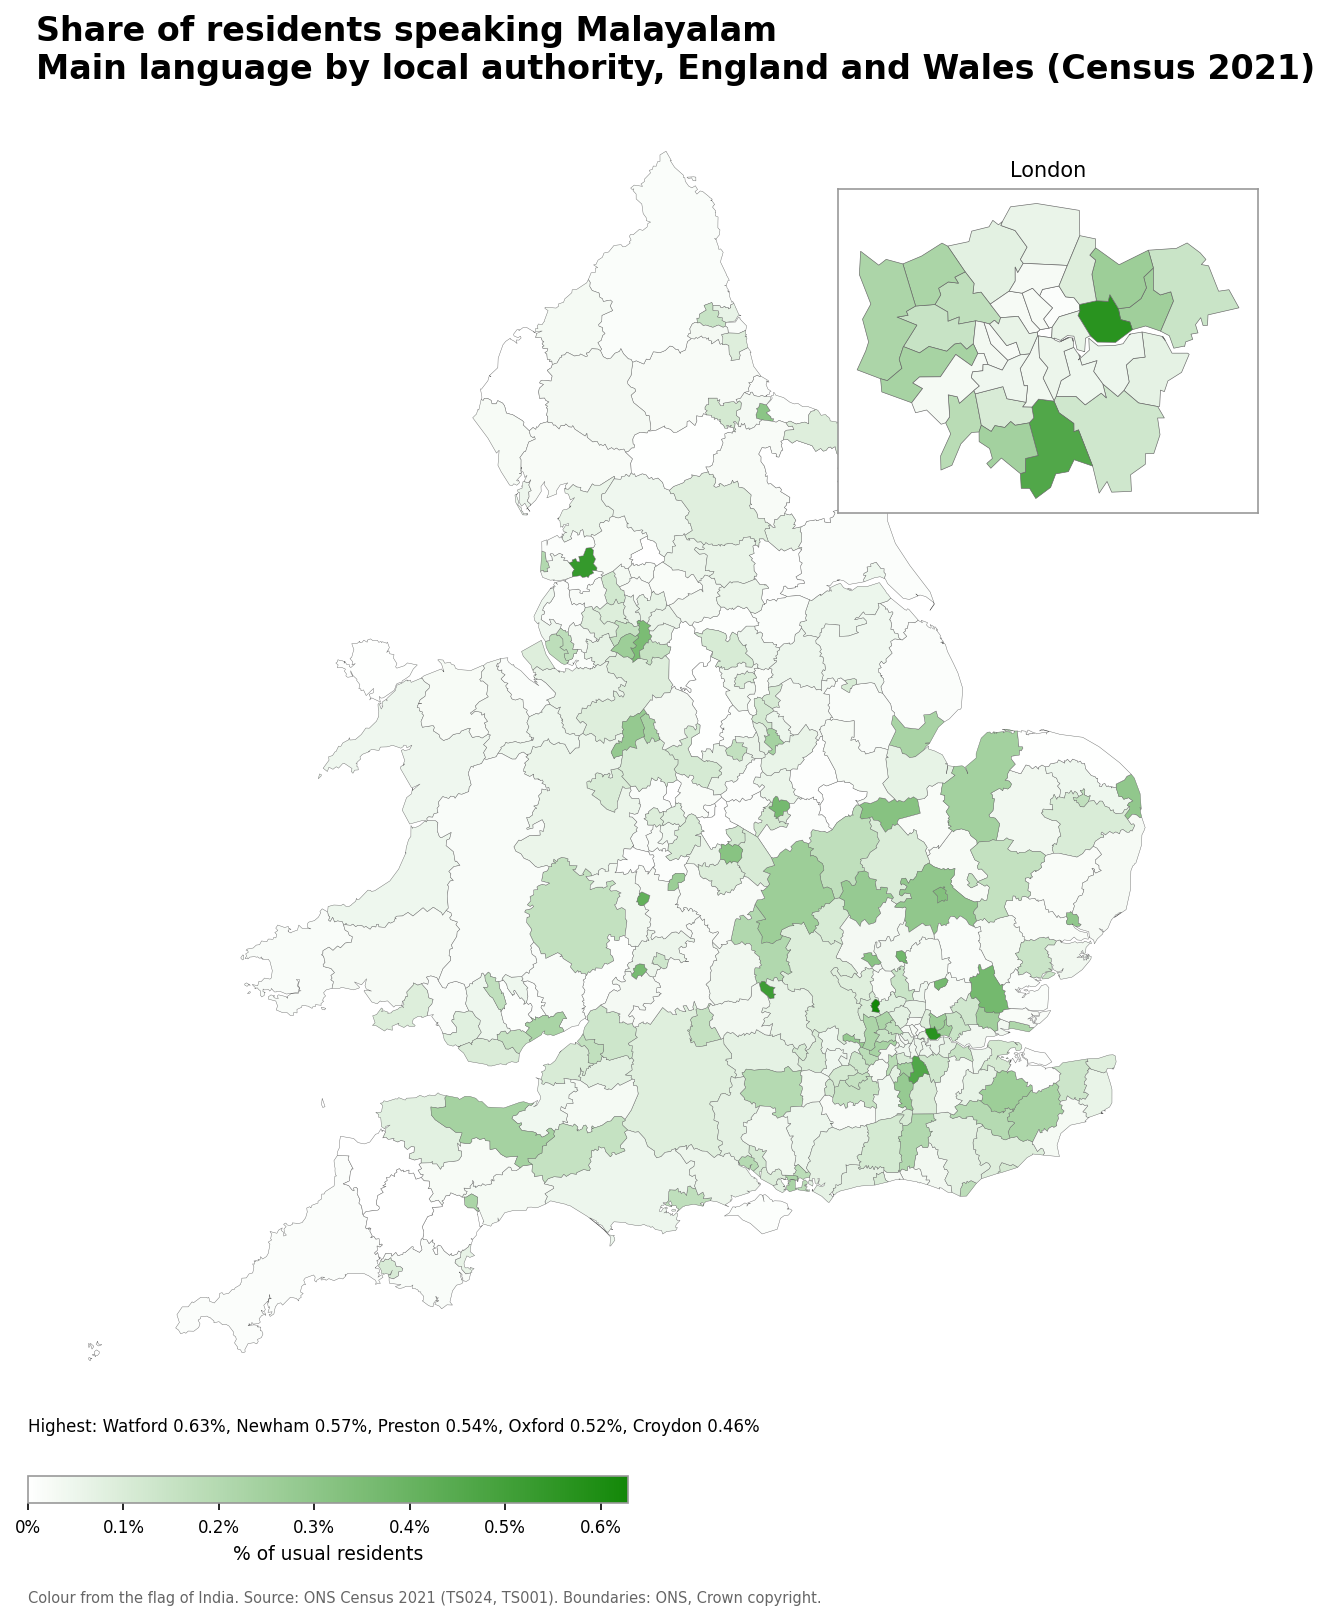
- Watford: 0.63% (643 speakers)
- Newham: 0.57% (1,998 speakers)
- Preston: 0.54% (795 speakers)
- Oxford: 0.52% (835 speakers)
- Croydon: 0.46% (1,814 speakers)
Number of Sinhala speakers
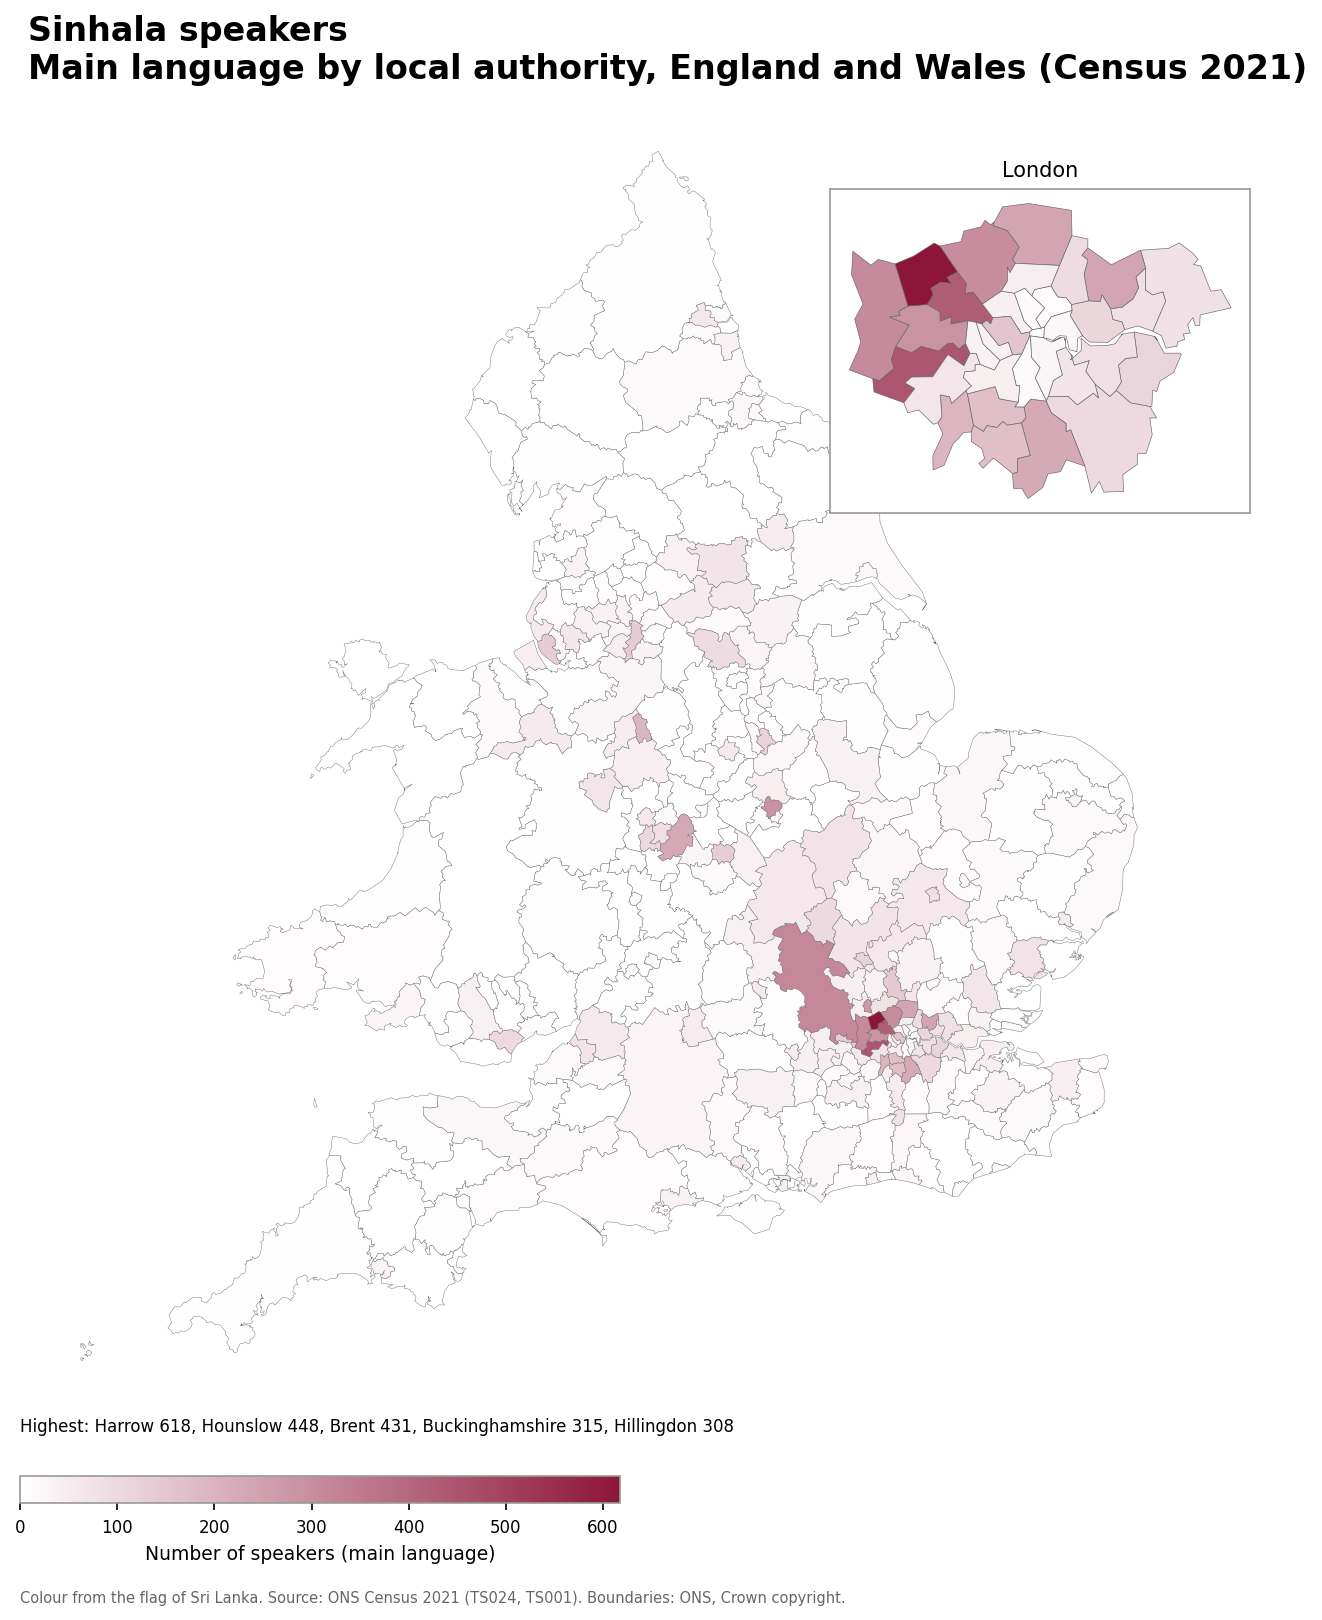
- Harrow: 618
- Hounslow: 448
- Brent: 431
- Buckinghamshire: 315
- Hillingdon: 308
Sinhala speakers as a share of the population
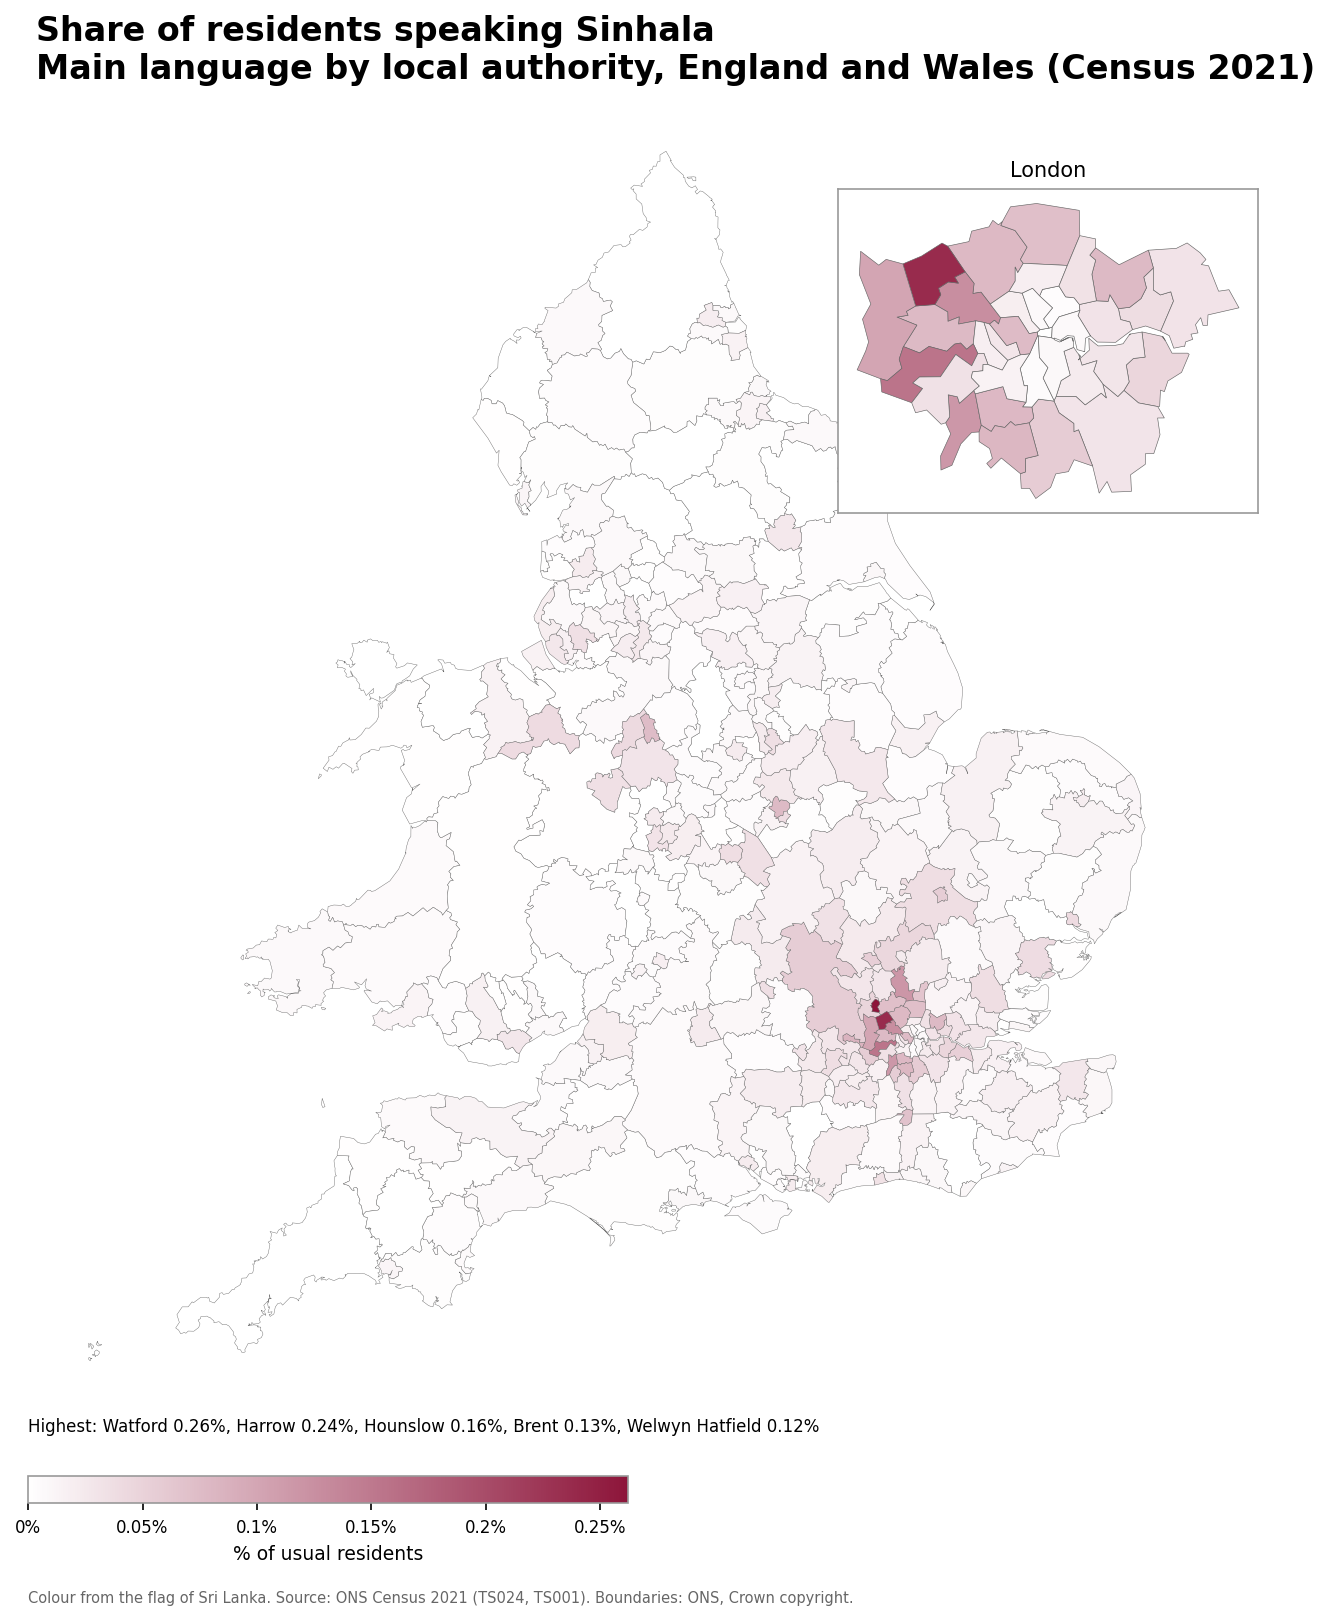
- Watford: 0.26% (268 speakers)
- Harrow: 0.24% (618 speakers)
- Hounslow: 0.16% (448 speakers)
- Brent: 0.13% (431 speakers)
- Welwyn Hatfield: 0.12% (141 speakers)
Number of Nepalese speakers
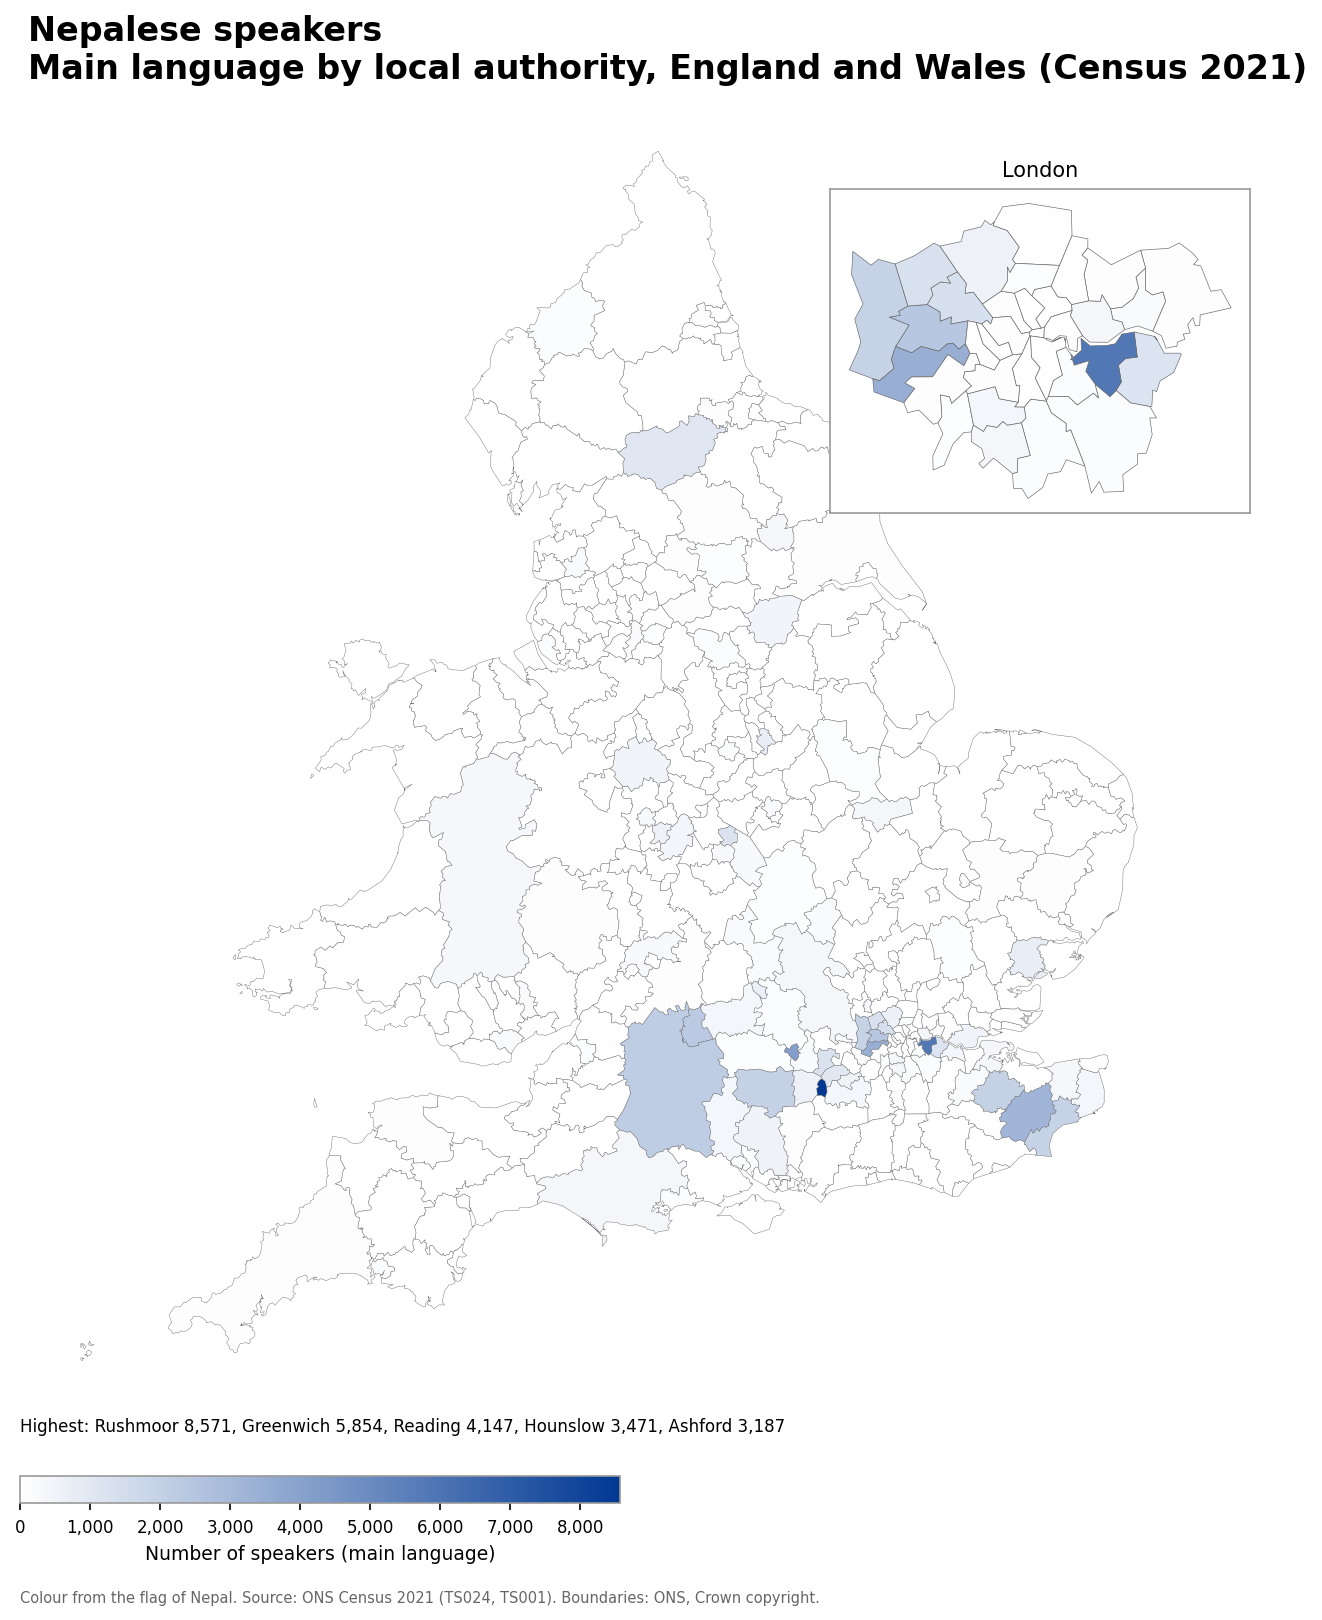
- Rushmoor: 8,571
- Greenwich: 5,854
- Reading: 4,147
- Hounslow: 3,471
- Ashford: 3,187
Nepalese speakers as a share of the population
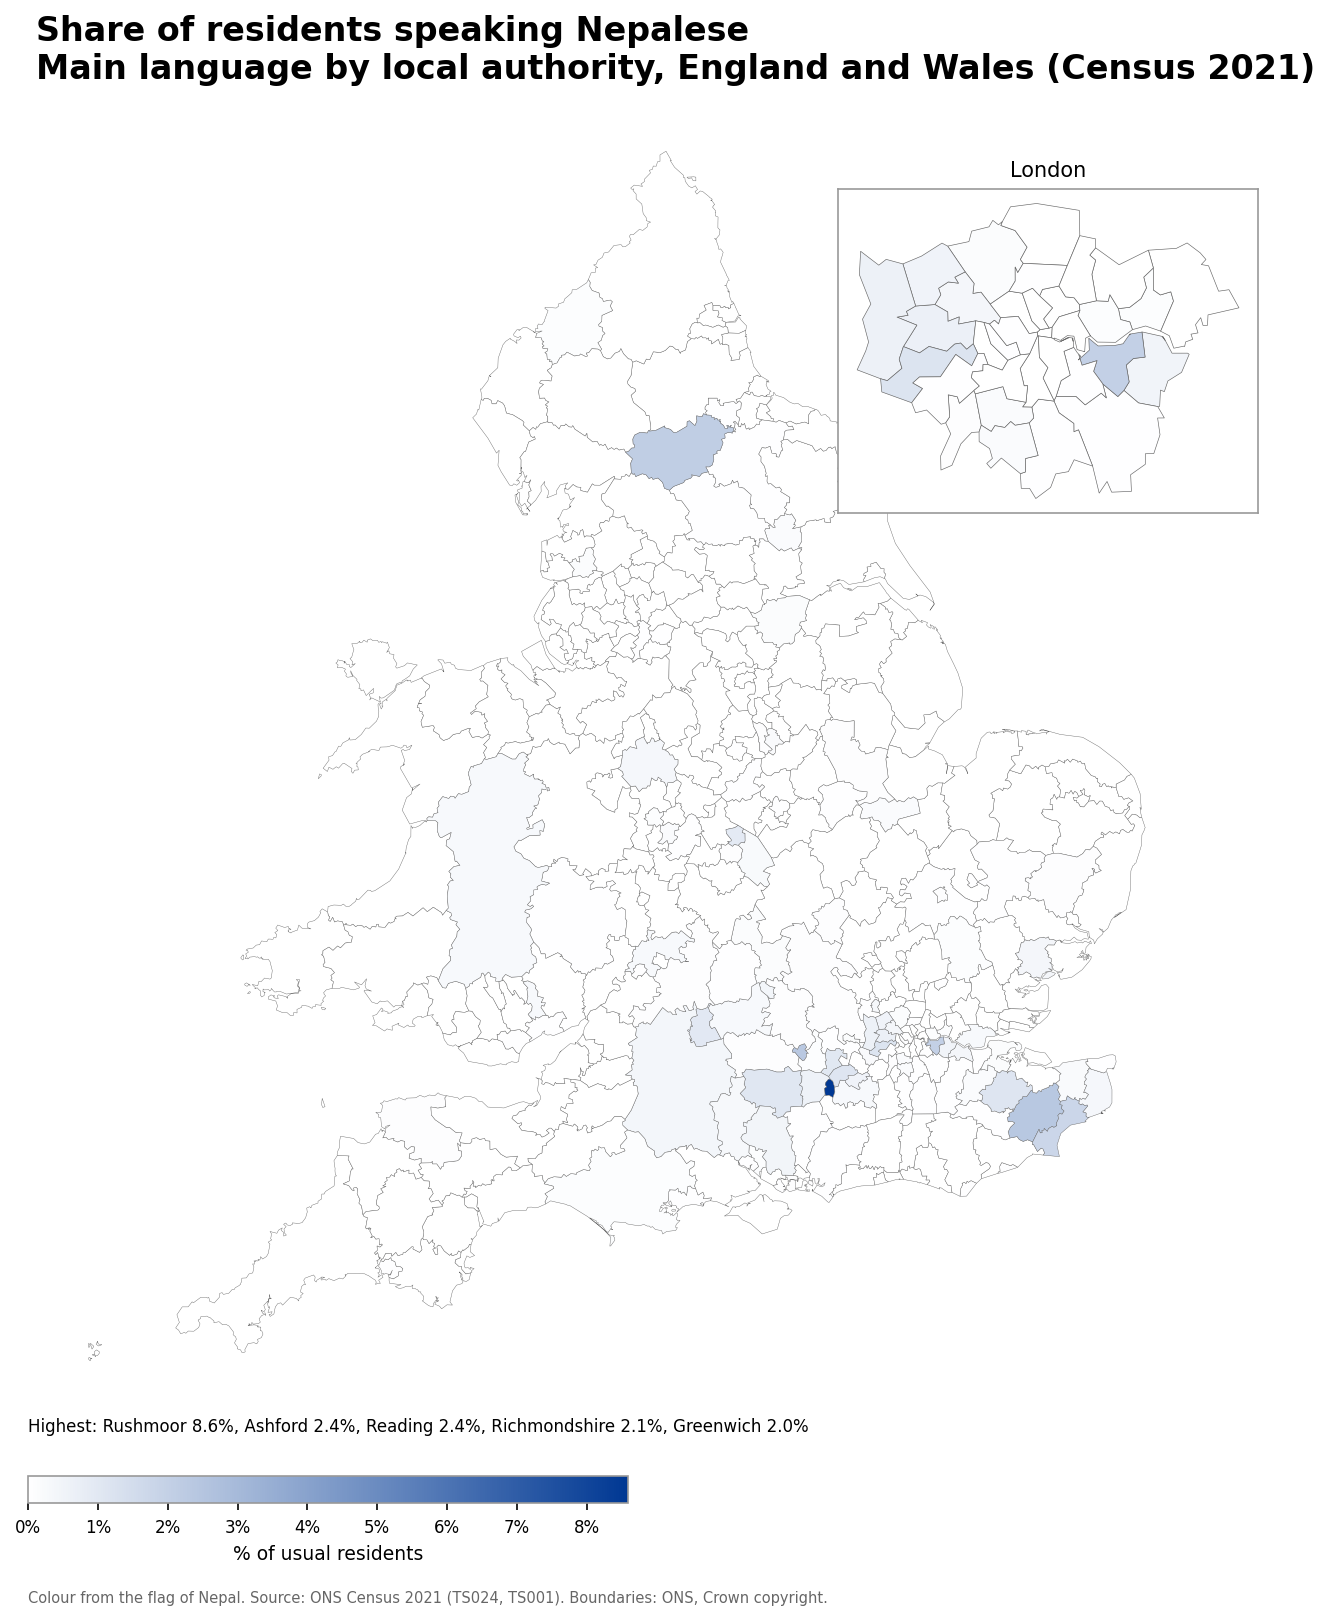
- Rushmoor: 8.6% (8,571 speakers)
- Ashford: 2.4% (3,187 speakers)
- Reading: 2.4% (4,147 speakers)
- Richmondshire: 2.1% (1,060 speakers)
- Greenwich: 2.0% (5,854 speakers)
Number of Mandarin speakers
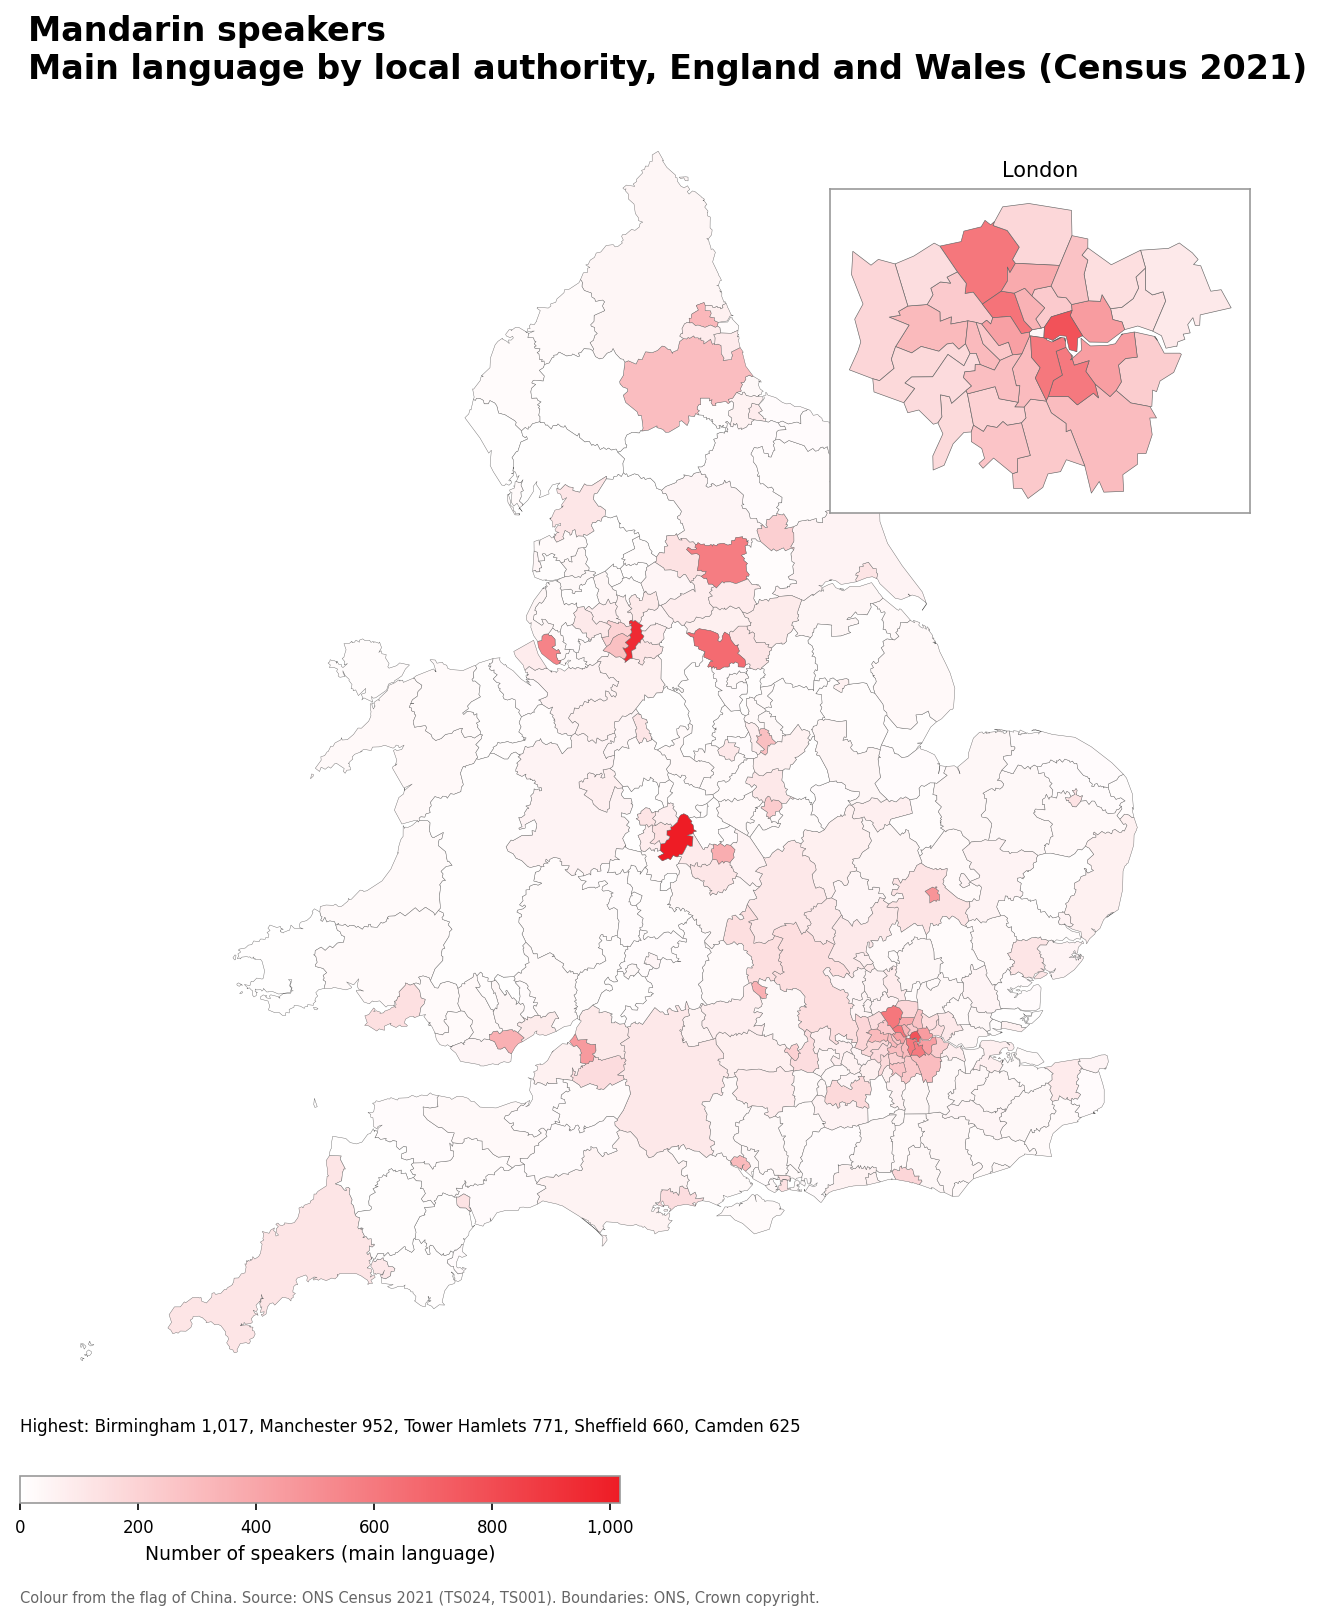
- Birmingham: 1,017
- Manchester: 952
- Tower Hamlets: 771
- Sheffield: 660
- Camden: 625
Mandarin speakers as a share of the population
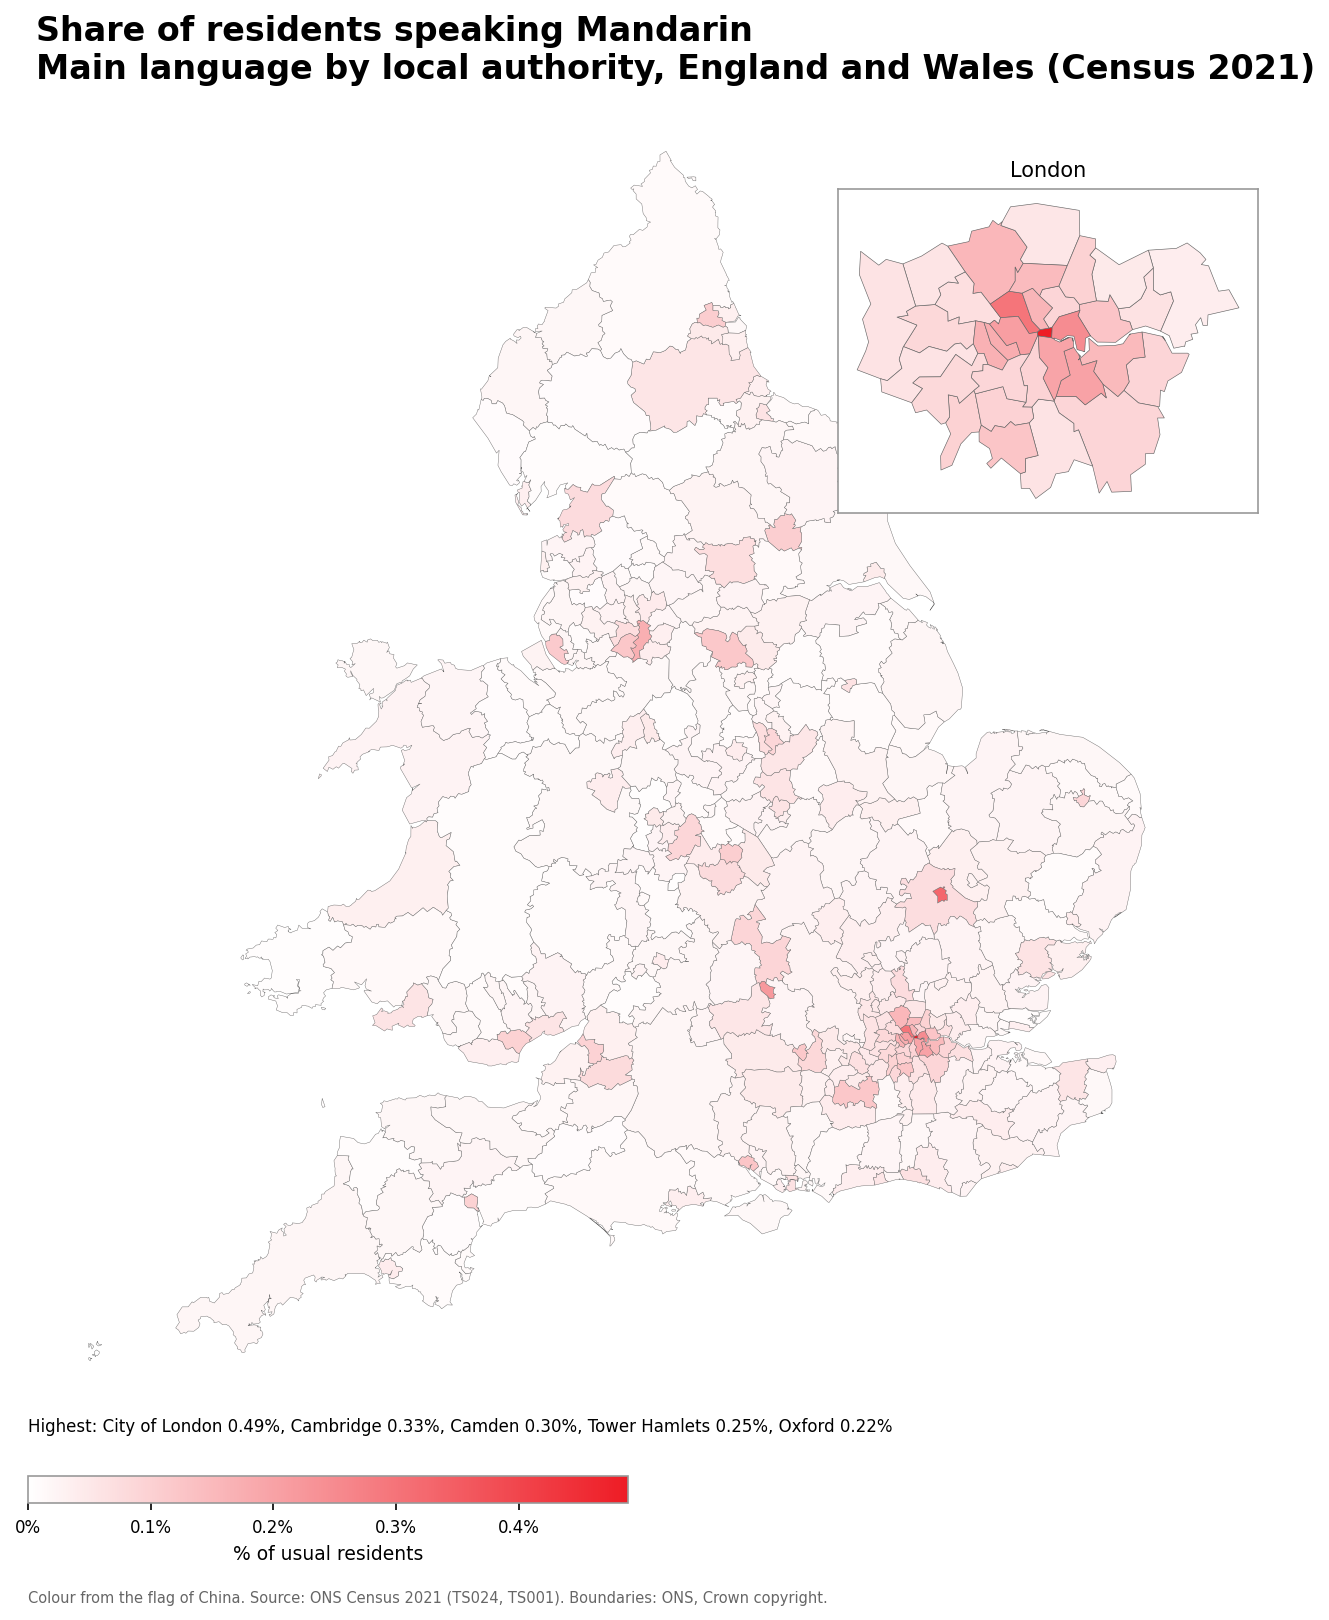
- City of London: 0.49% (42 speakers)
- Cambridge: 0.33% (479 speakers)
- Camden: 0.30% (625 speakers)
- Tower Hamlets: 0.25% (771 speakers)
- Oxford: 0.22% (357 speakers)
Number of Cantonese speakers
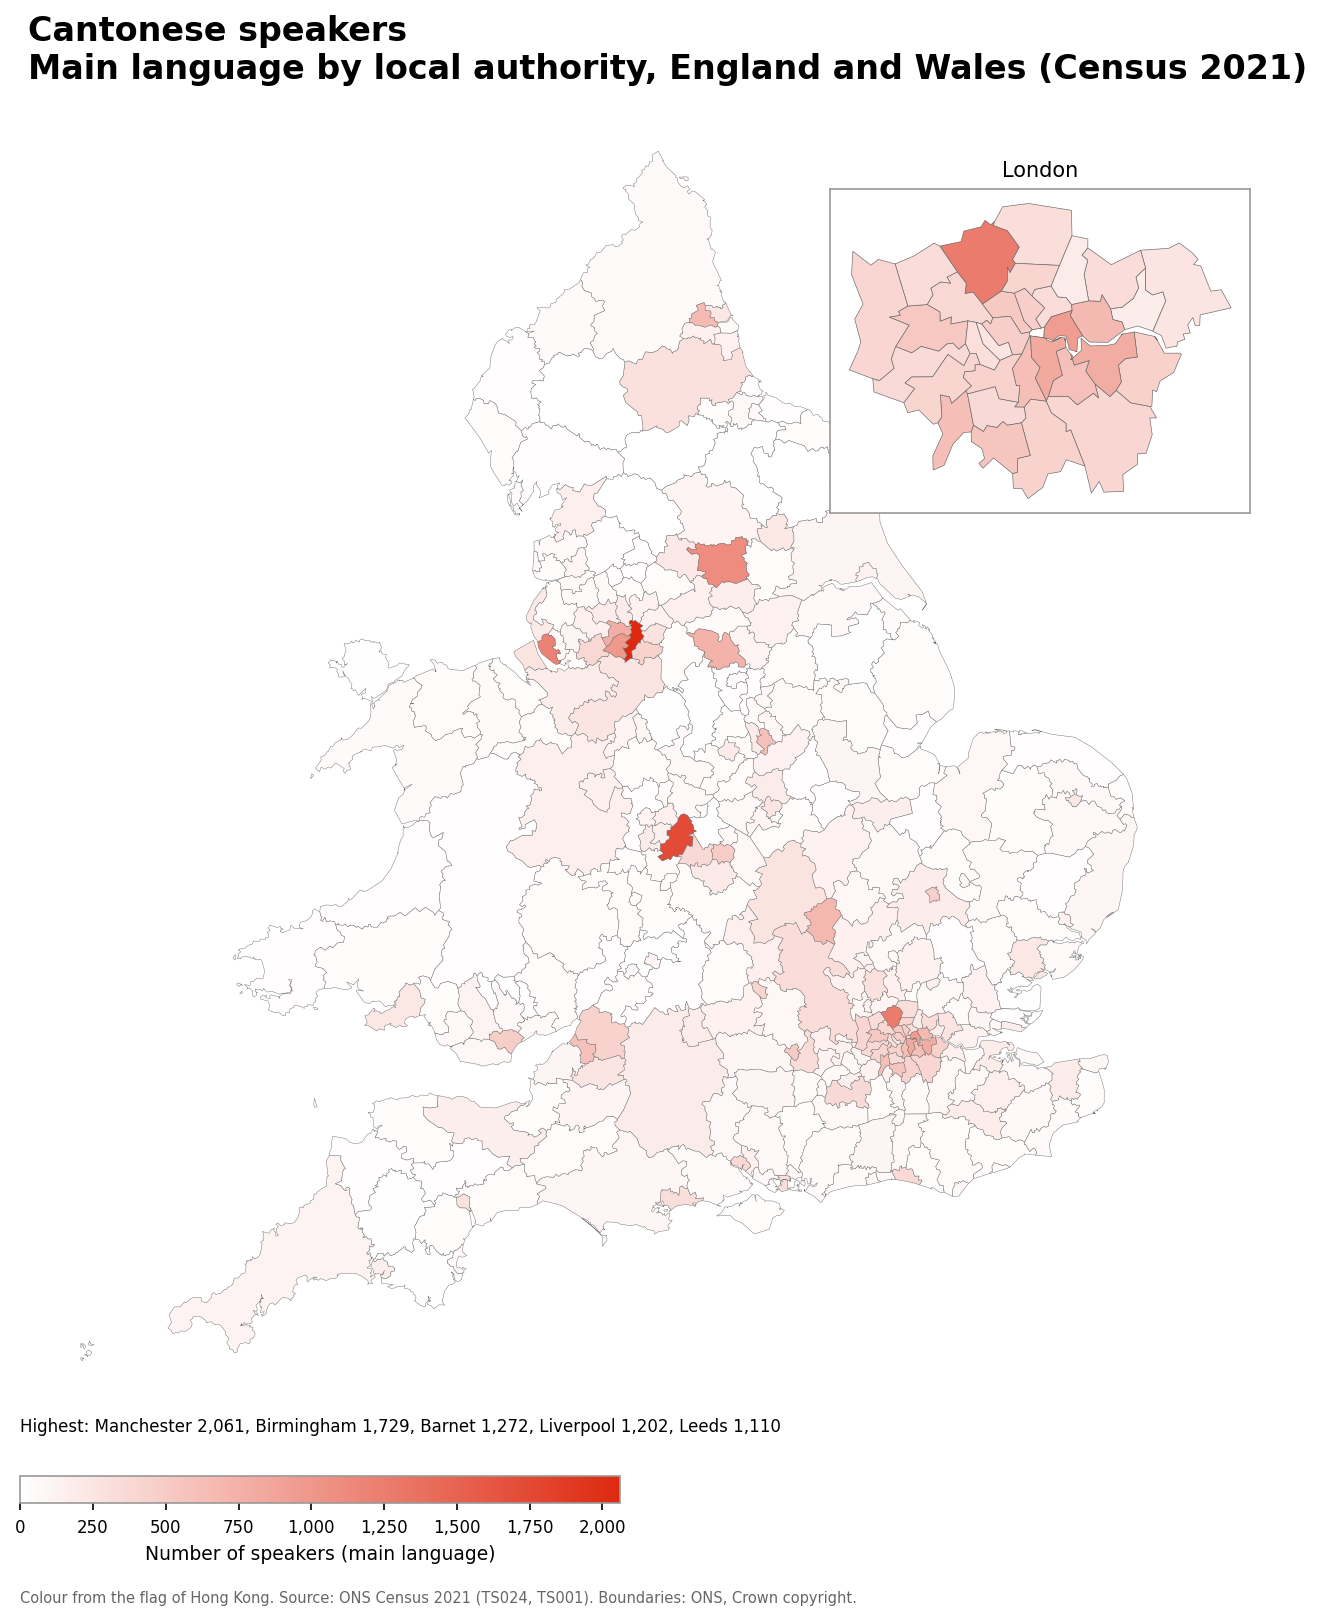
- Manchester: 2,061
- Birmingham: 1,729
- Barnet: 1,272
- Liverpool: 1,202
- Leeds: 1,110
Cantonese speakers as a share of the population
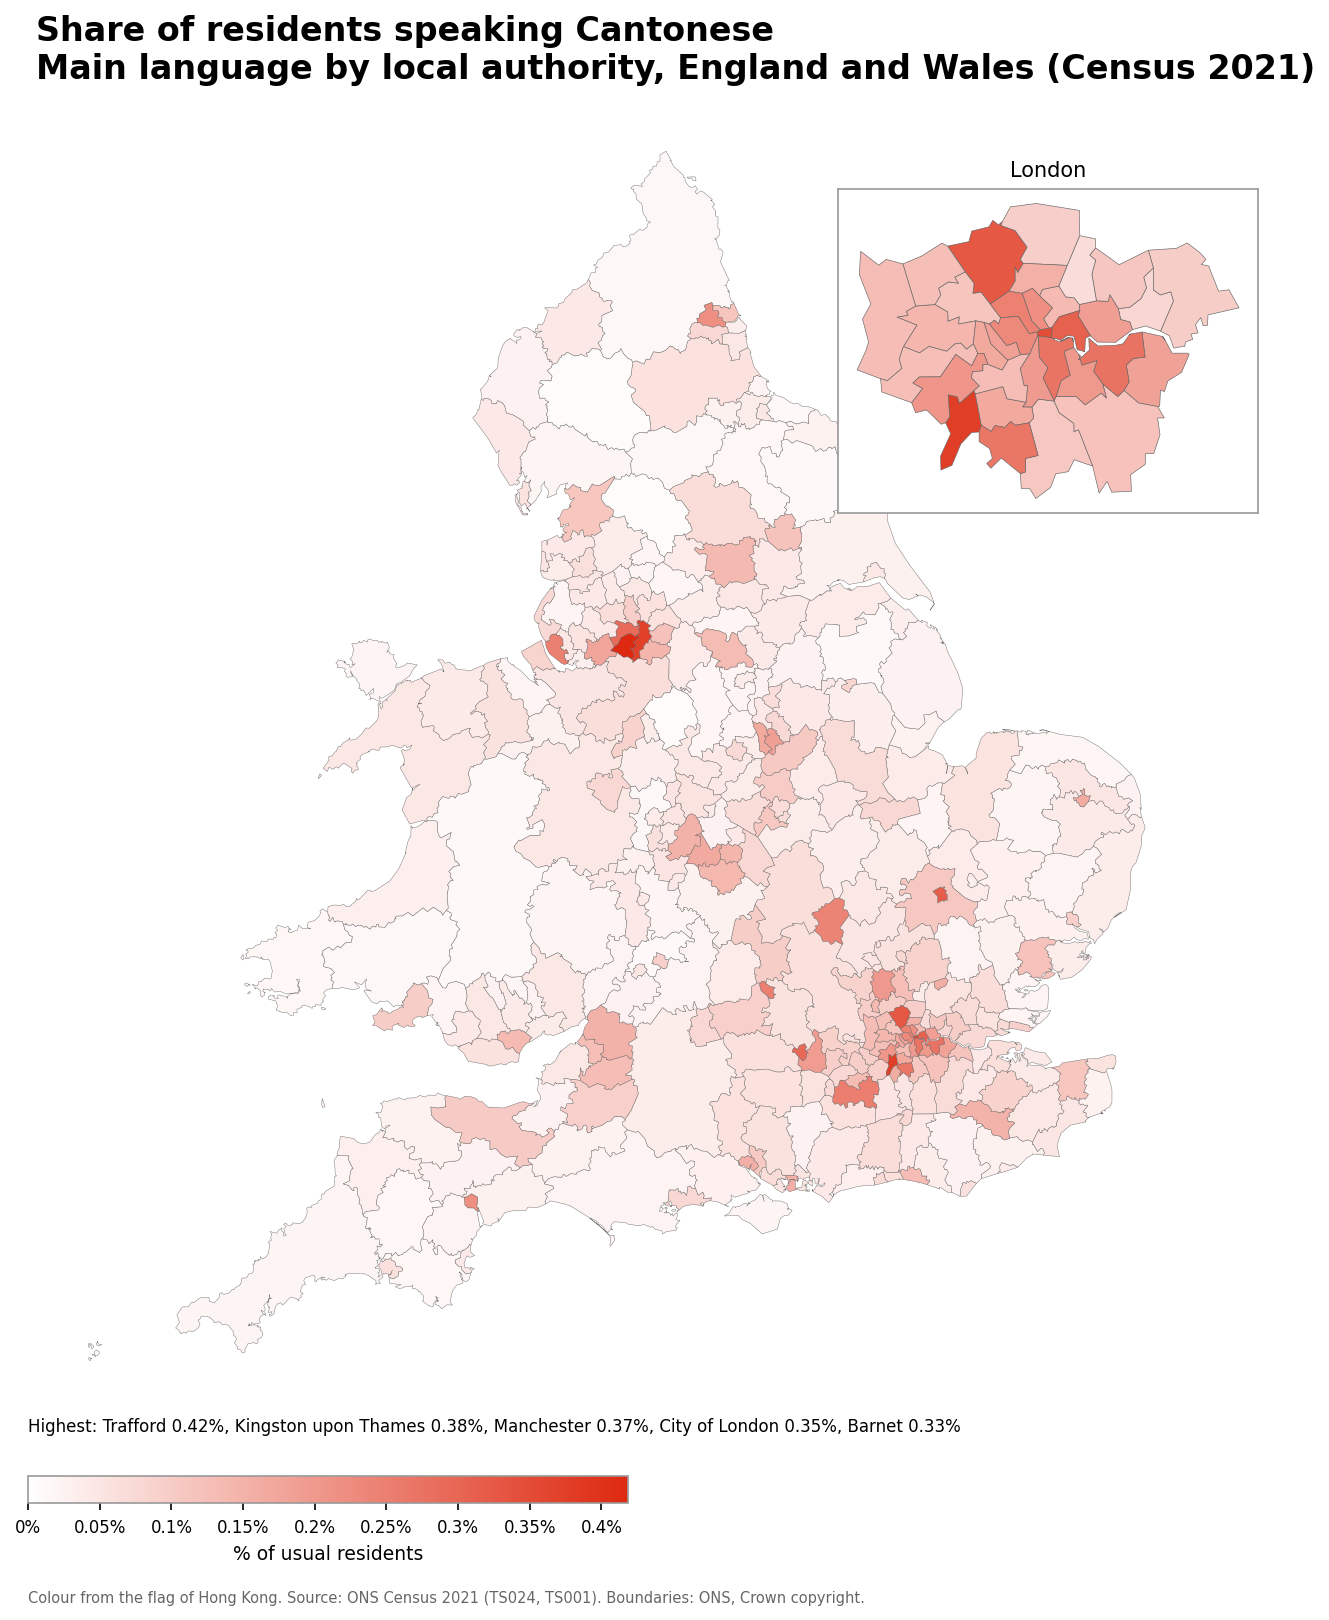
- Trafford: 0.42% (984 speakers)
- Kingston upon Thames: 0.38% (633 speakers)
- Manchester: 0.37% (2,061 speakers)
- City of London: 0.35% (30 speakers)
- Barnet: 0.33% (1,272 speakers)
Number of Chinese (other) speakers
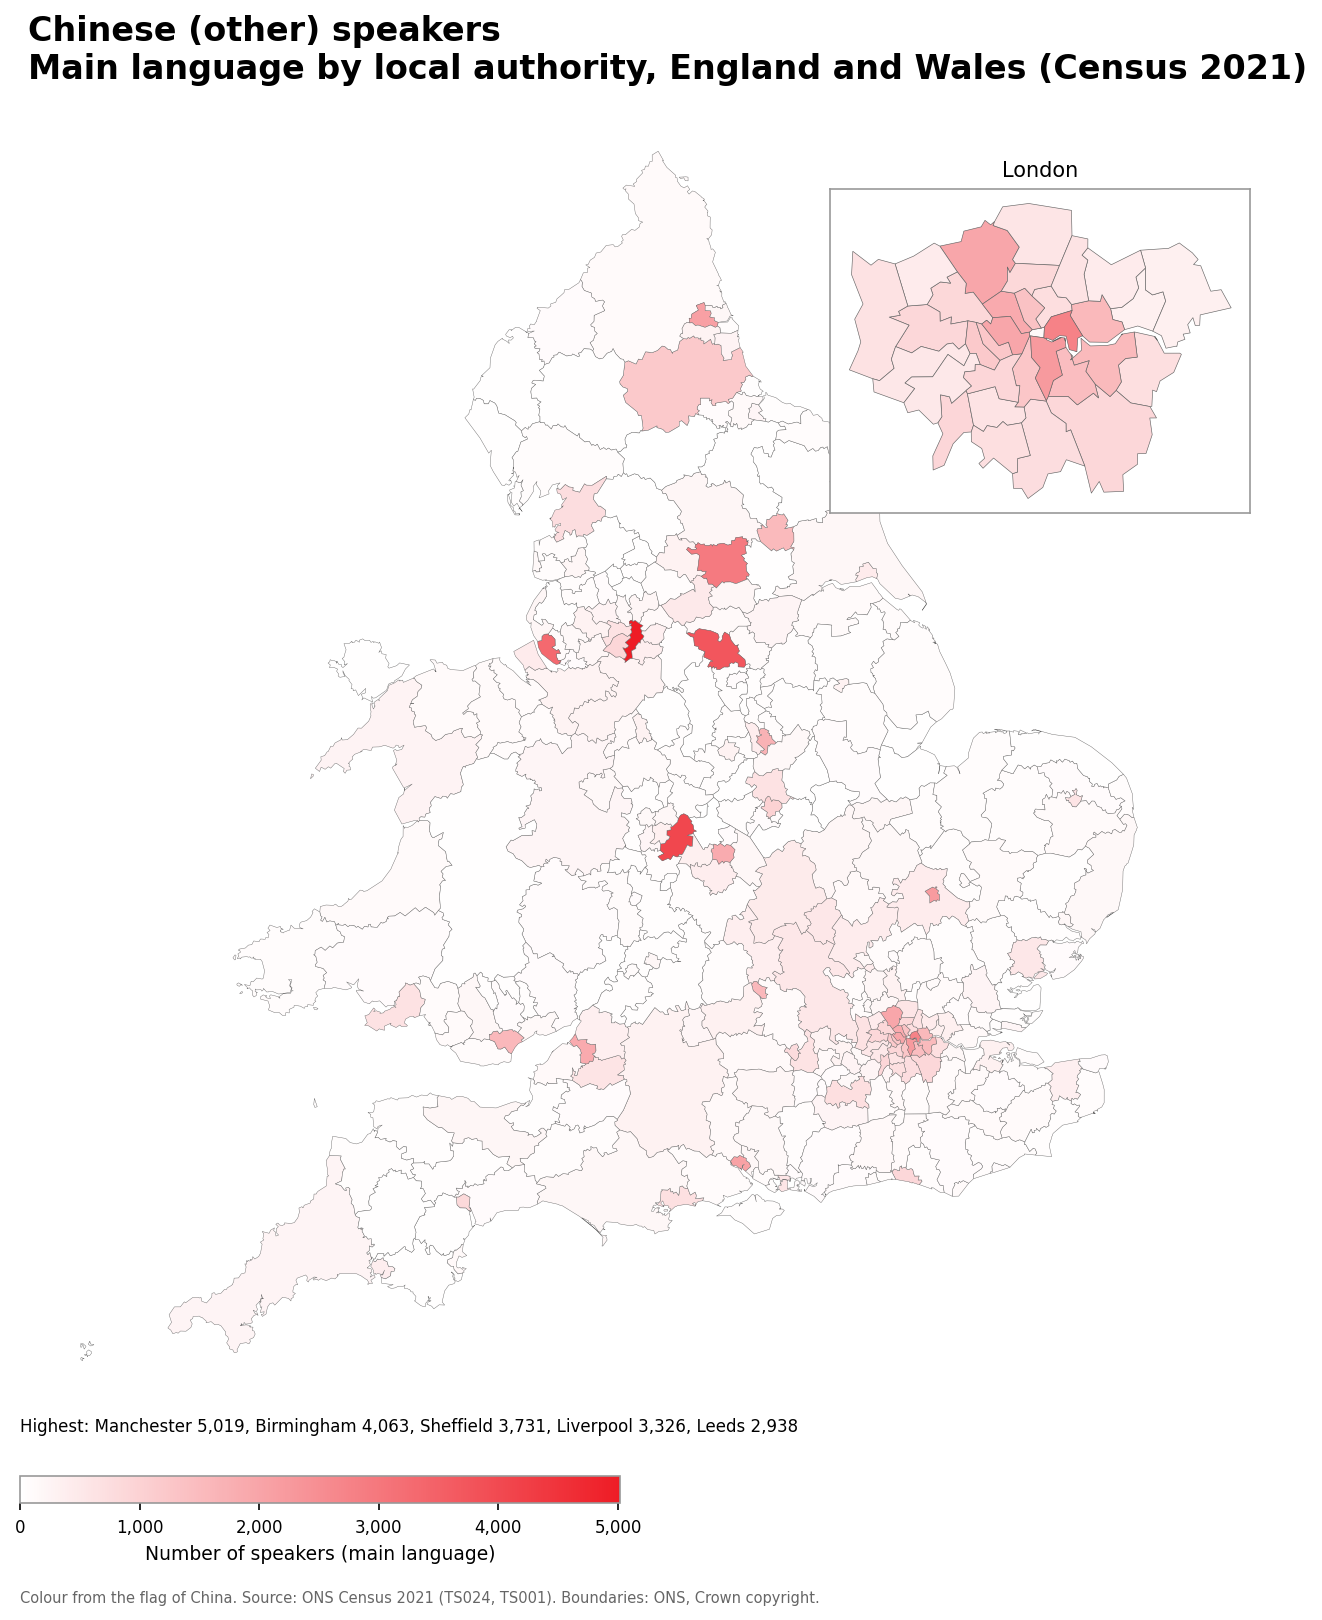
- Manchester: 5,019
- Birmingham: 4,063
- Sheffield: 3,731
- Liverpool: 3,326
- Leeds: 2,938
Chinese (other) speakers as a share of the population
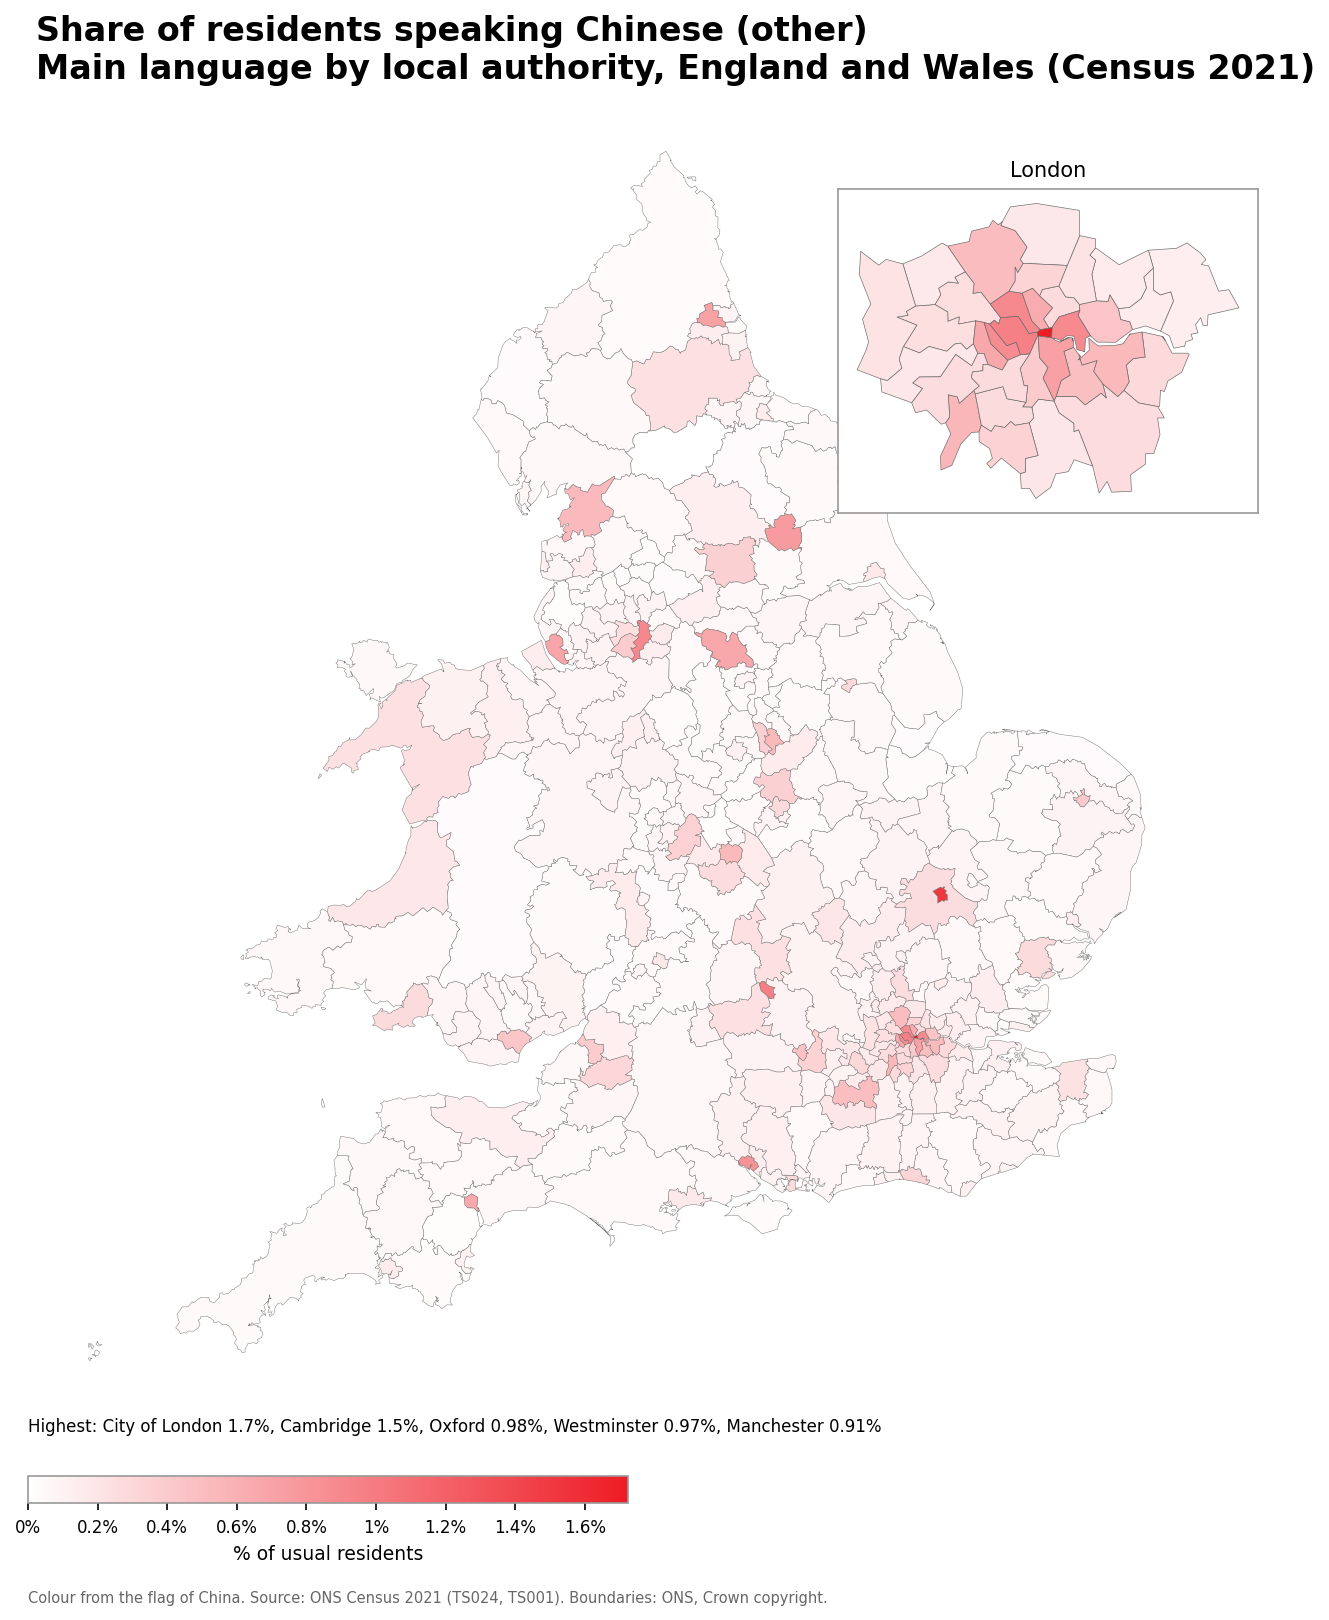
- City of London: 1.7% (148 speakers)
- Cambridge: 1.5% (2,212 speakers)
- Oxford: 0.98% (1,580 speakers)
- Westminster: 0.97% (1,974 speakers)
- Manchester: 0.91% (5,019 speakers)
Number of Japanese speakers
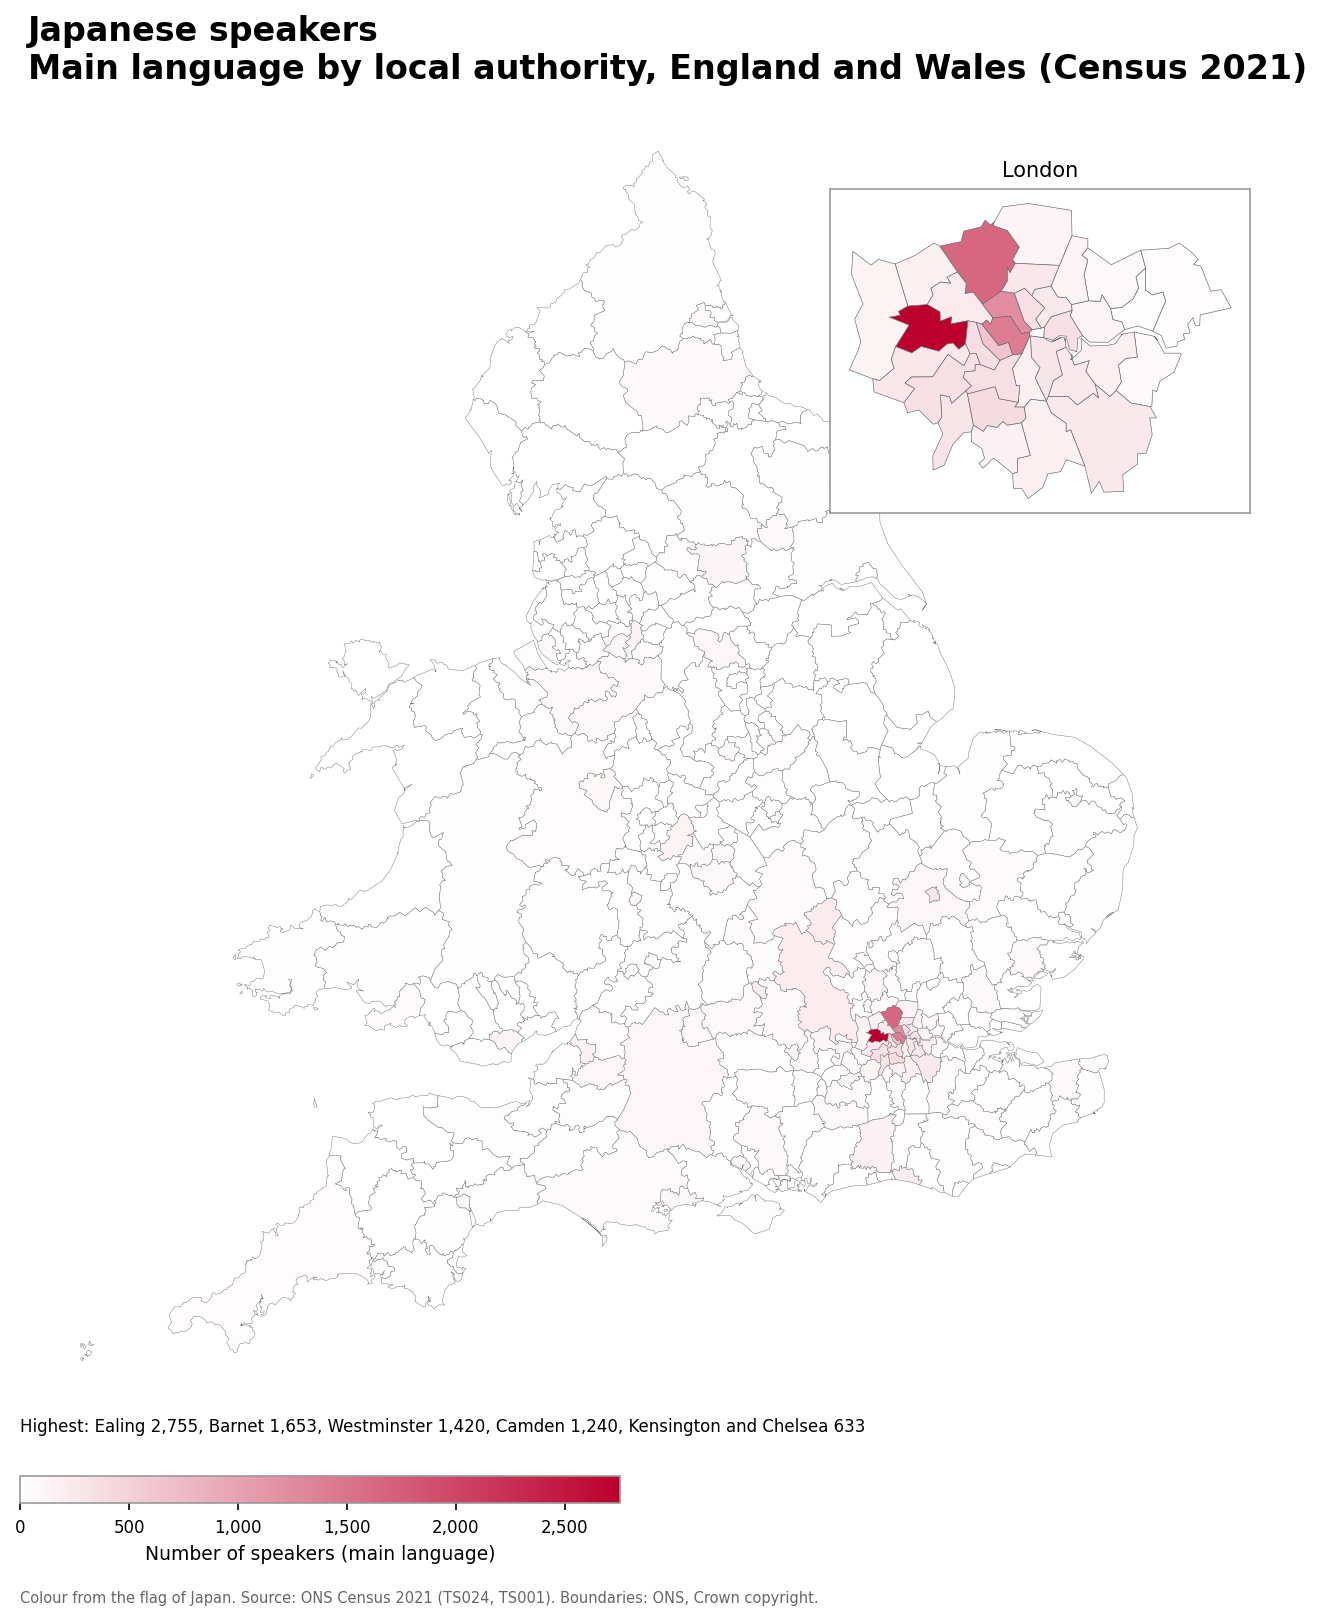
- Ealing: 2,755
- Barnet: 1,653
- Westminster: 1,420
- Camden: 1,240
- Kensington and Chelsea: 633
Japanese speakers as a share of the population
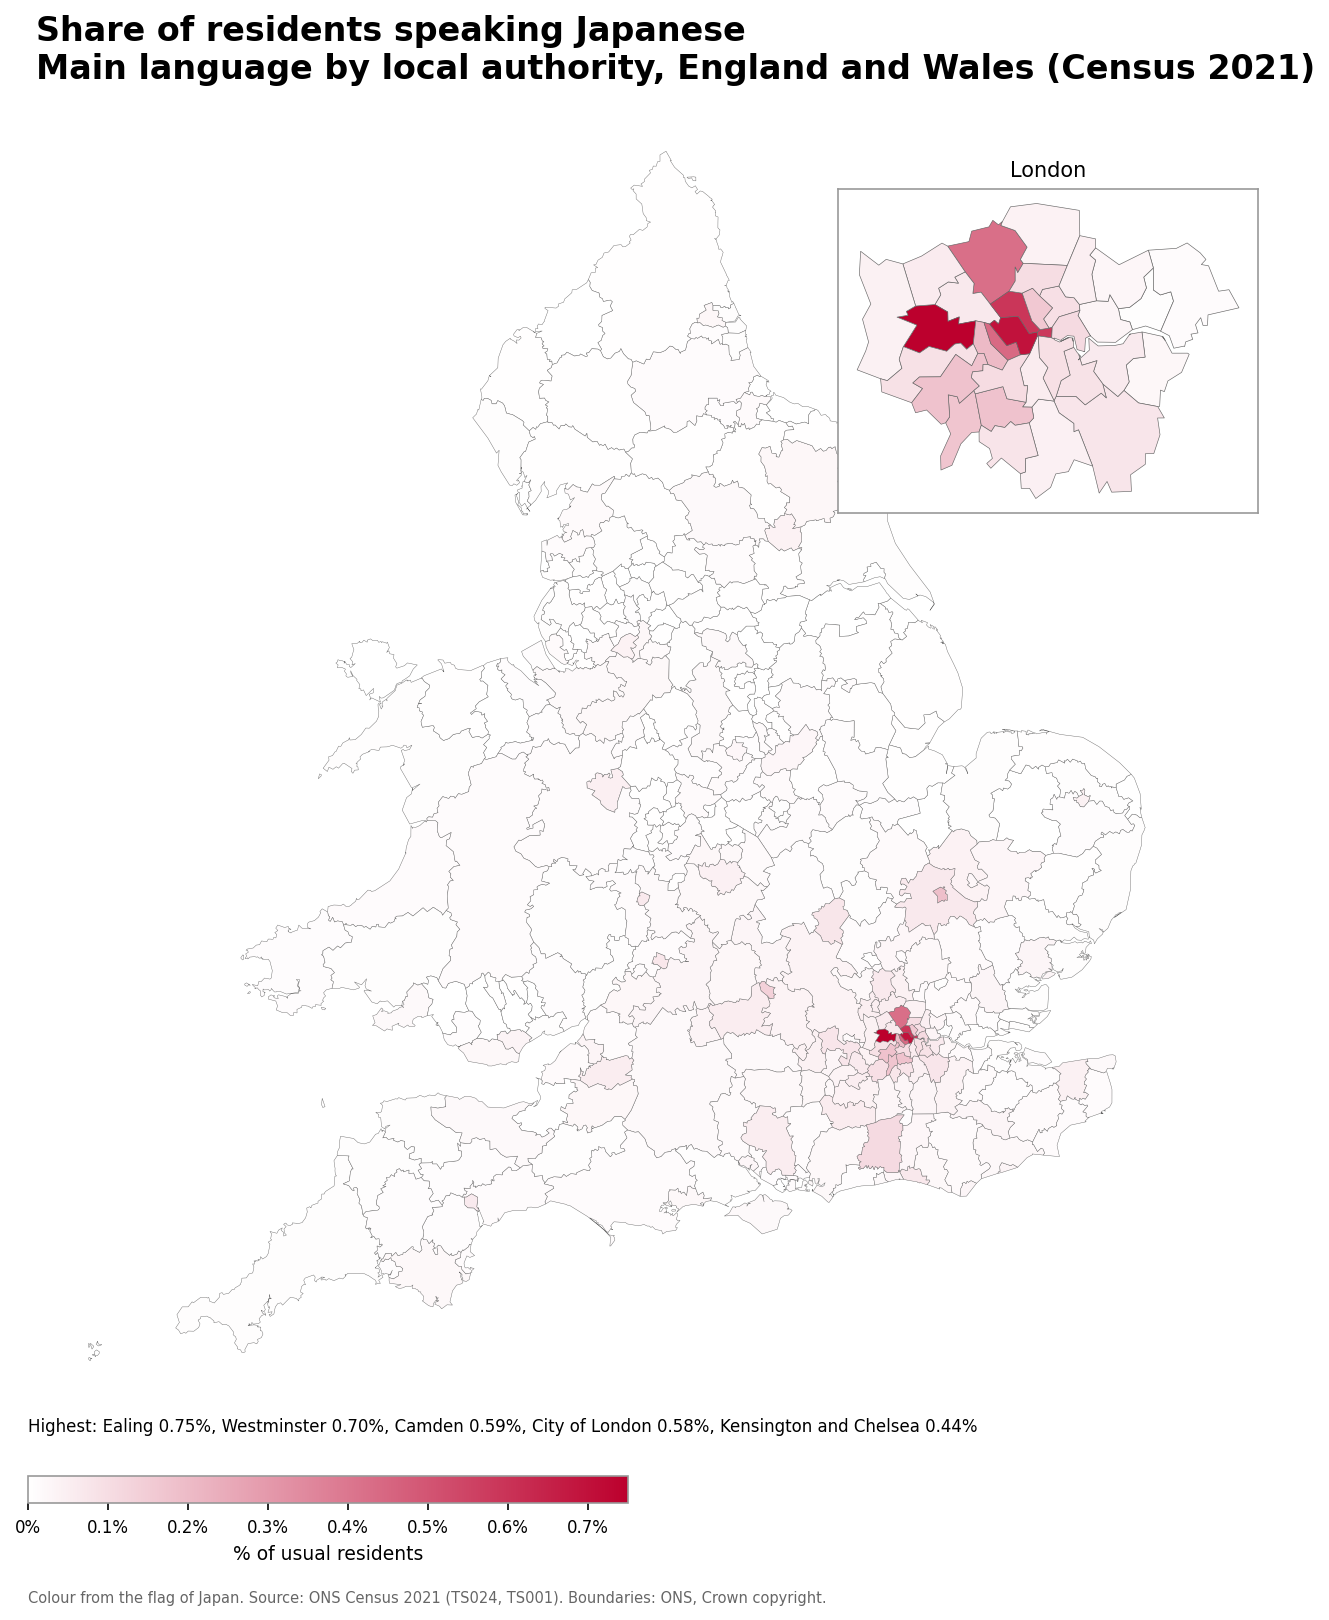
- Ealing: 0.75% (2,755 speakers)
- Westminster: 0.70% (1,420 speakers)
- Camden: 0.59% (1,240 speakers)
- City of London: 0.58% (50 speakers)
- Kensington and Chelsea: 0.44% (633 speakers)
Number of Korean speakers
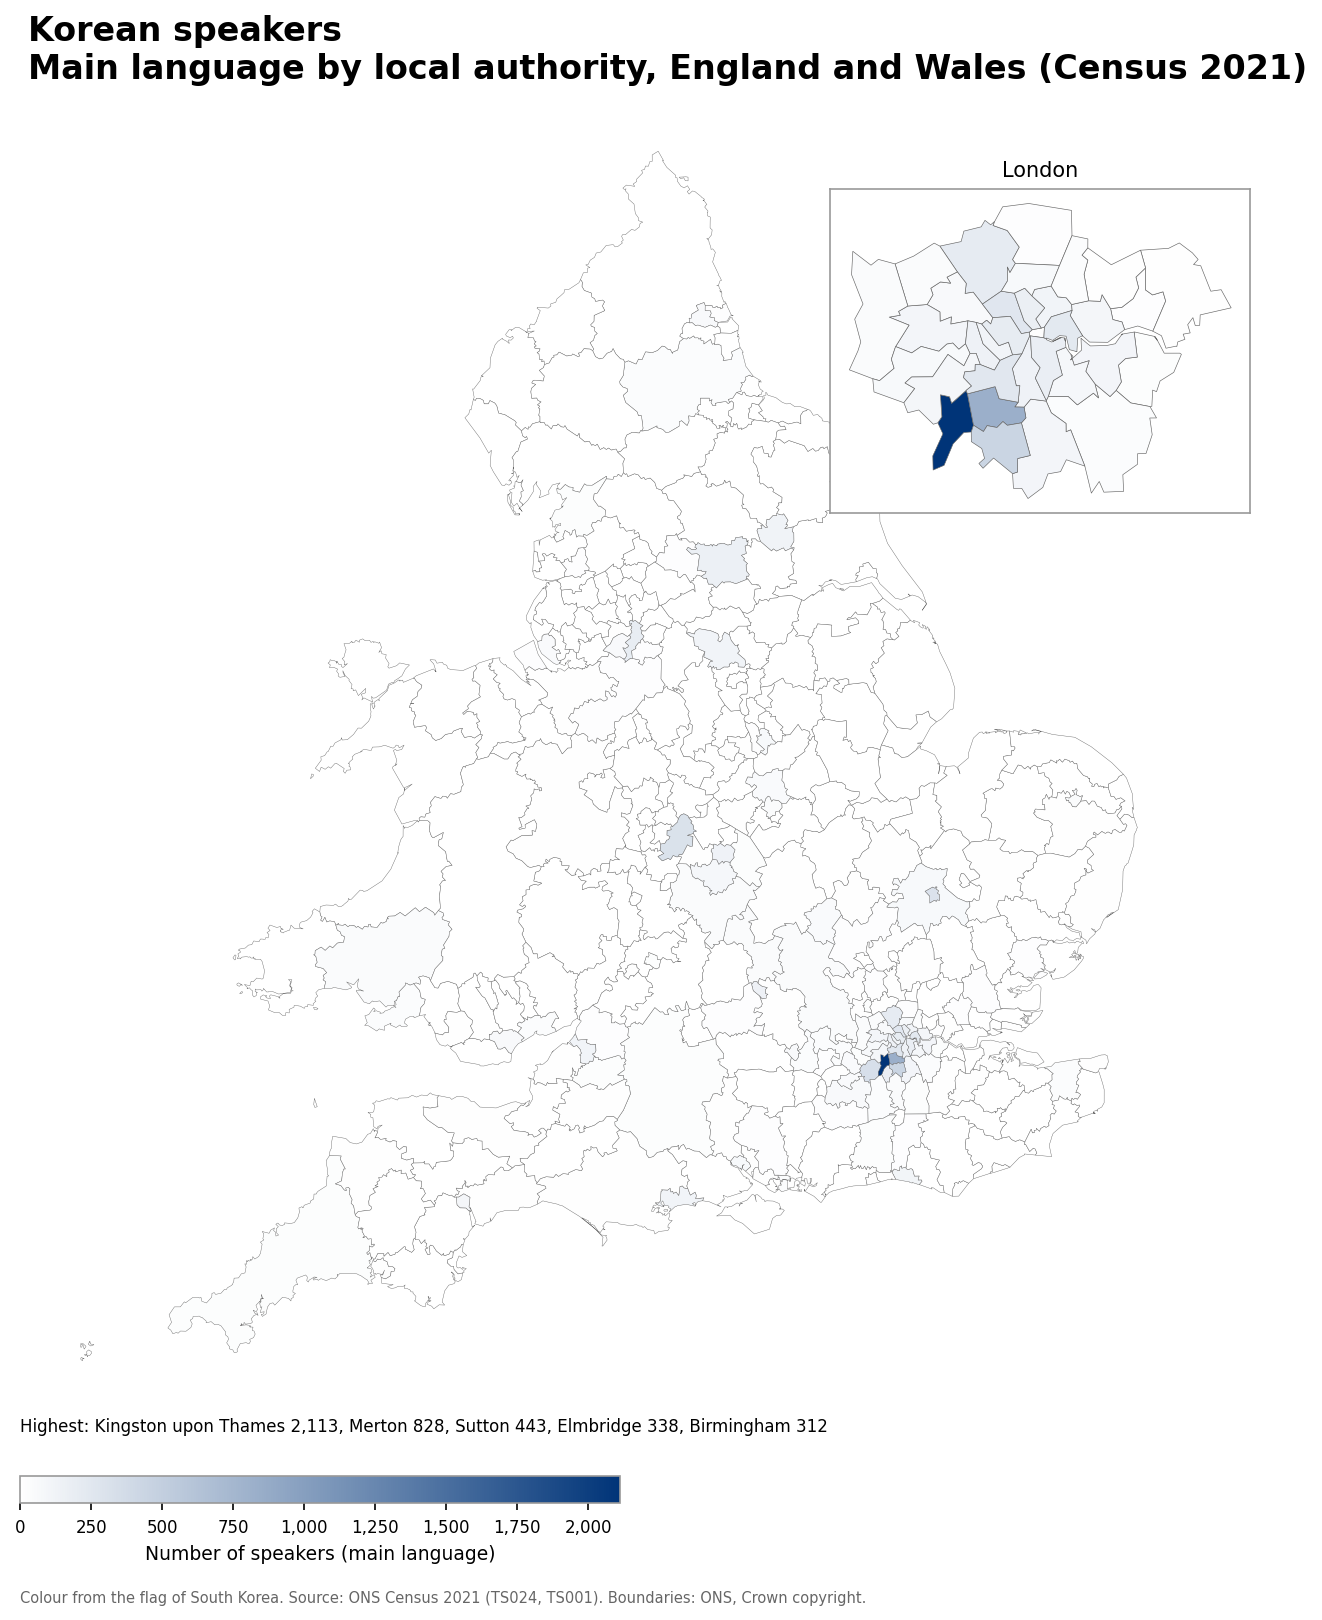
- Kingston upon Thames: 2,113
- Merton: 828
- Sutton: 443
- Elmbridge: 338
- Birmingham: 312
Korean speakers as a share of the population
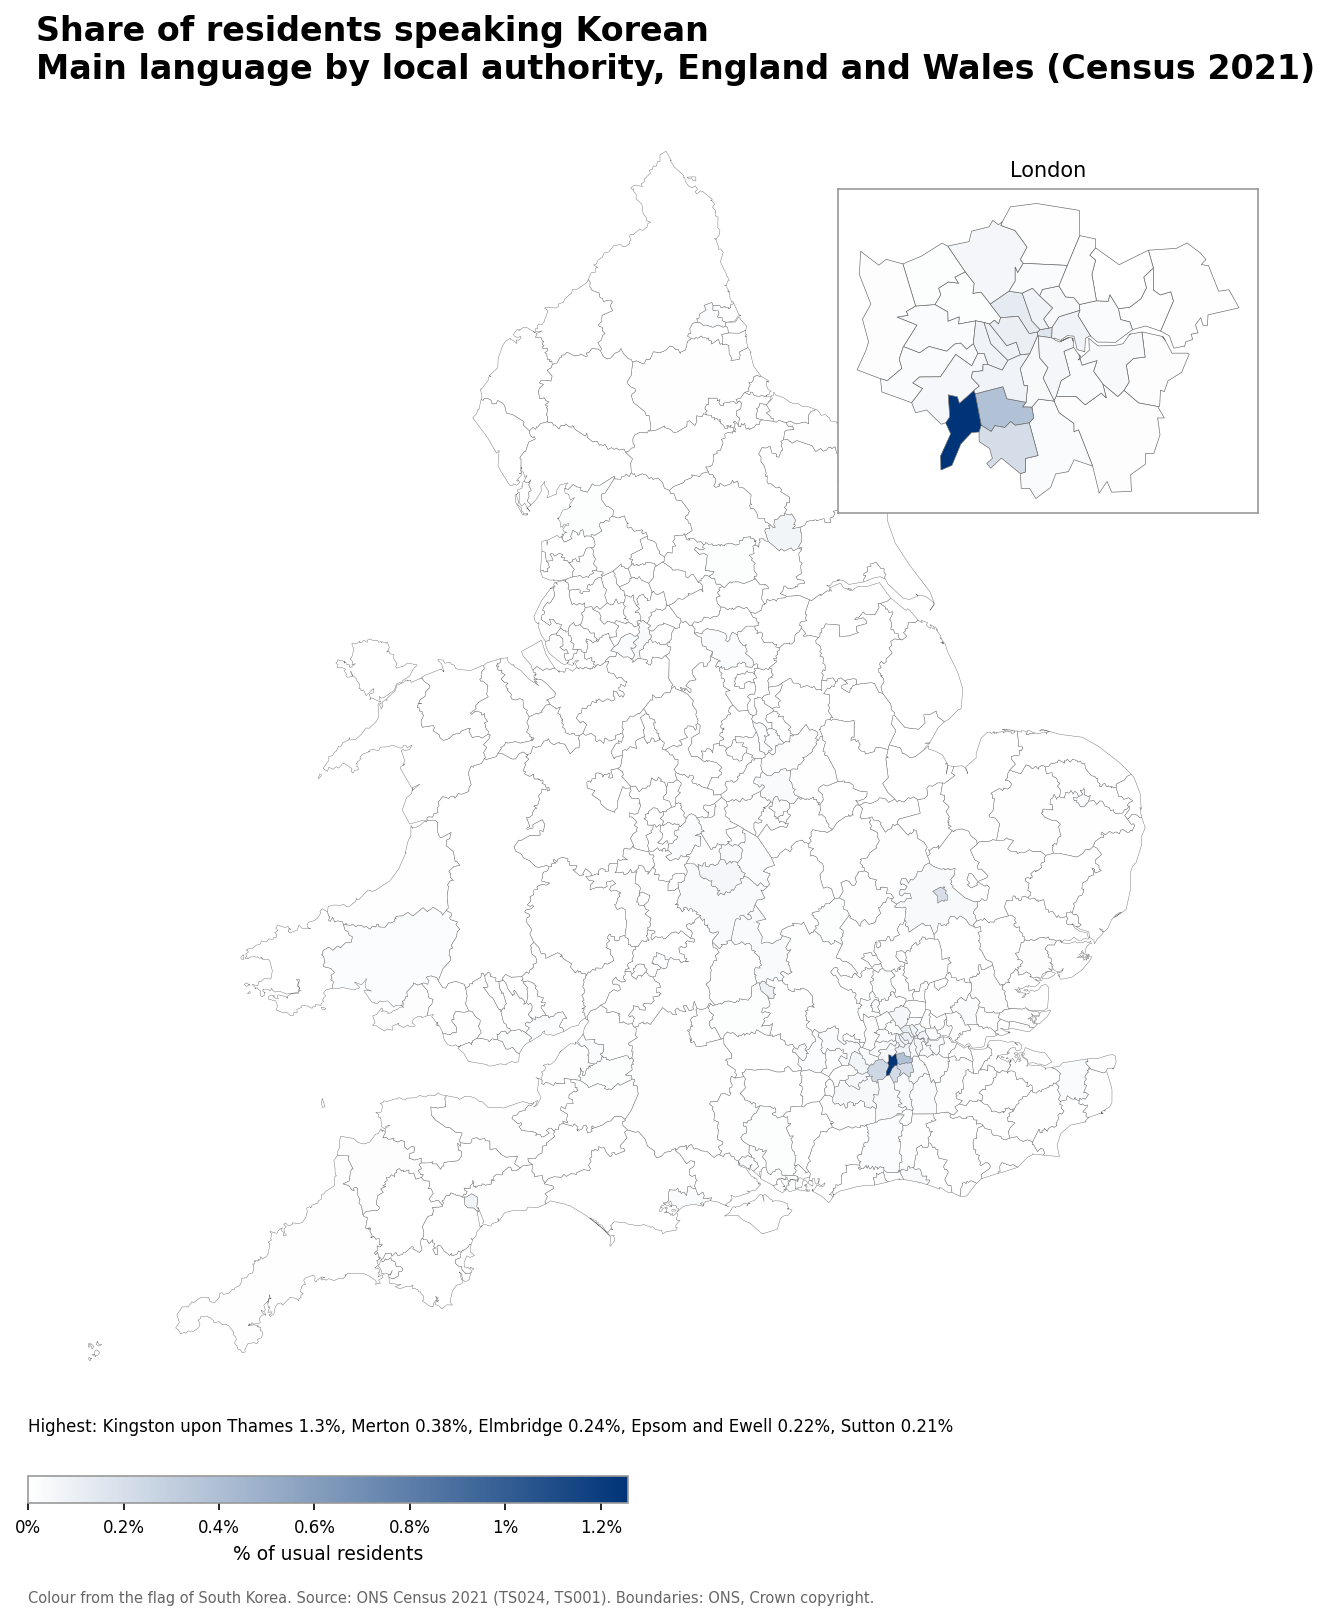
- Kingston upon Thames: 1.3% (2,113 speakers)
- Merton: 0.38% (828 speakers)
- Elmbridge: 0.24% (338 speakers)
- Epsom and Ewell: 0.22% (179 speakers)
- Sutton: 0.21% (443 speakers)
Number of Vietnamese speakers
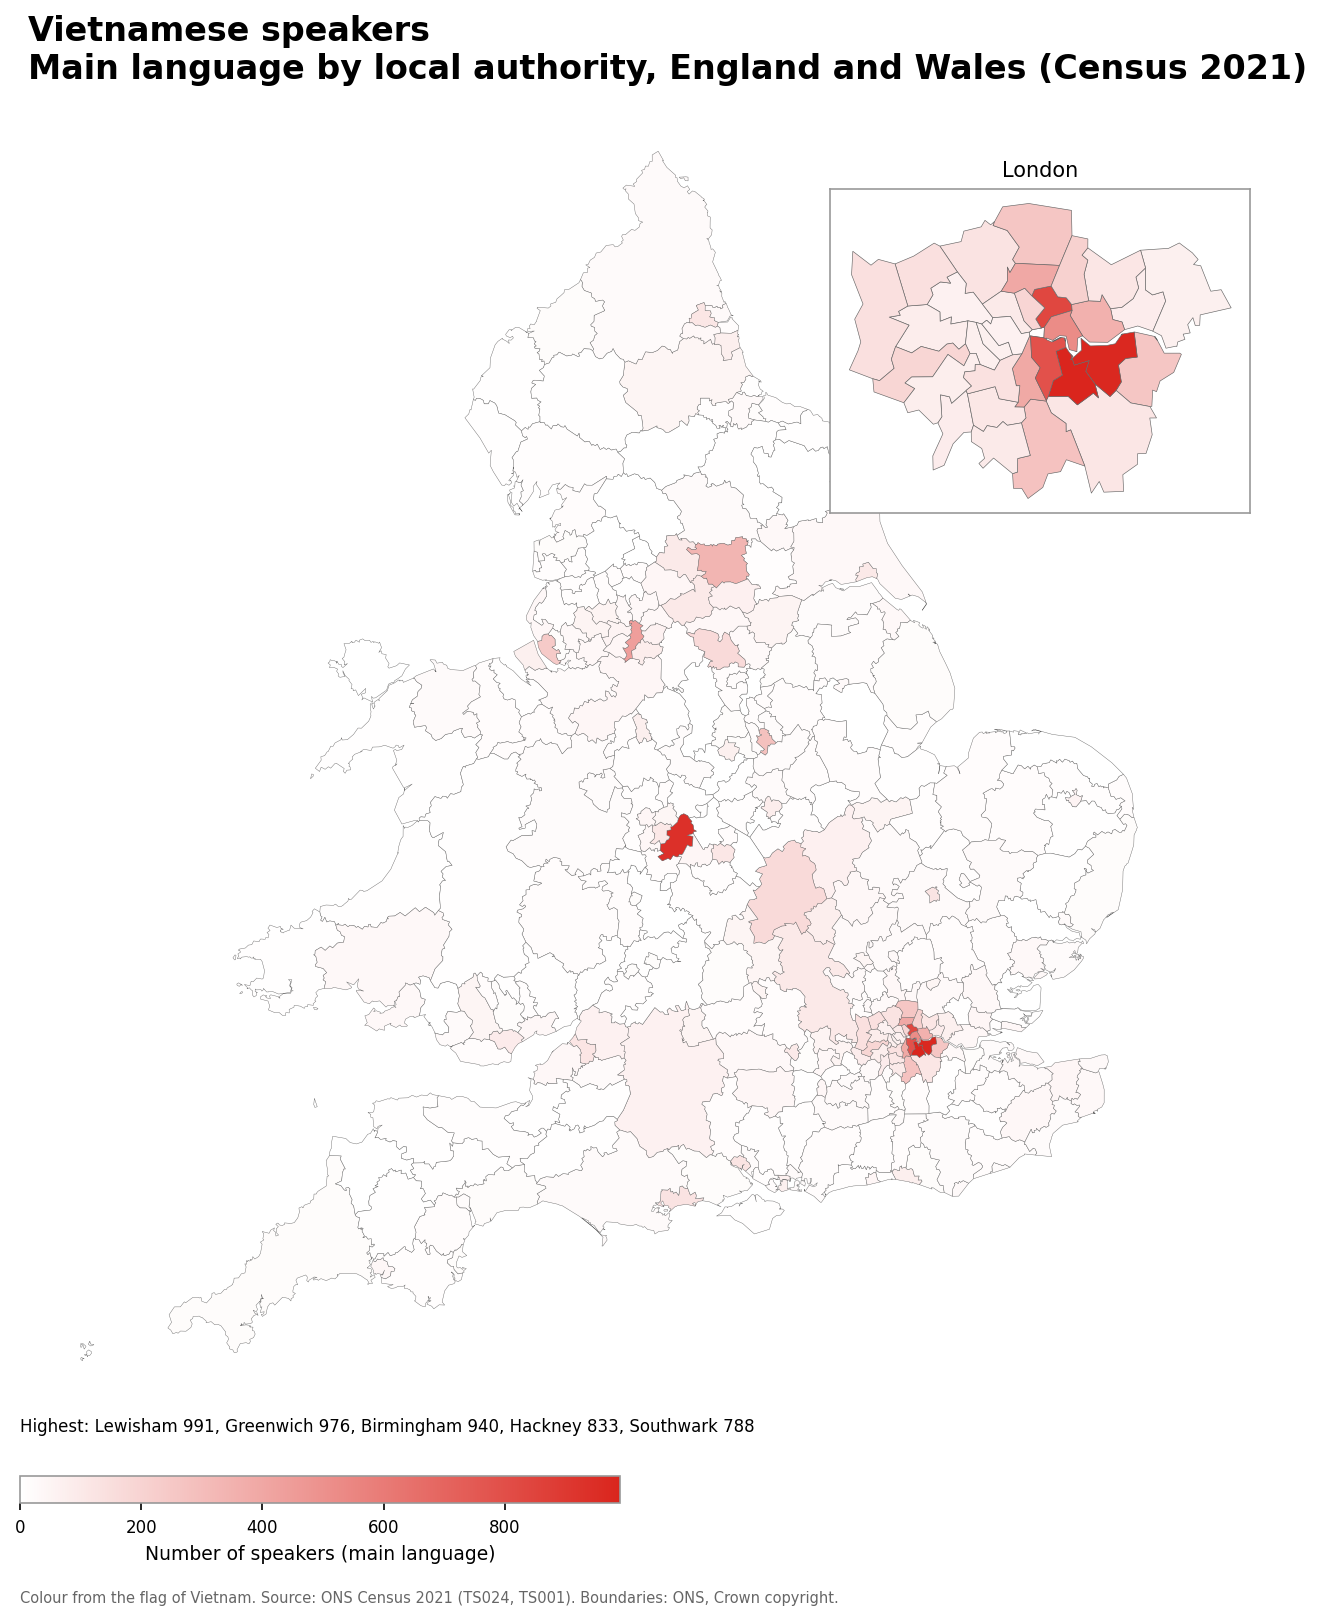
- Lewisham: 991
- Greenwich: 976
- Birmingham: 940
- Hackney: 833
- Southwark: 788
Vietnamese speakers as a share of the population
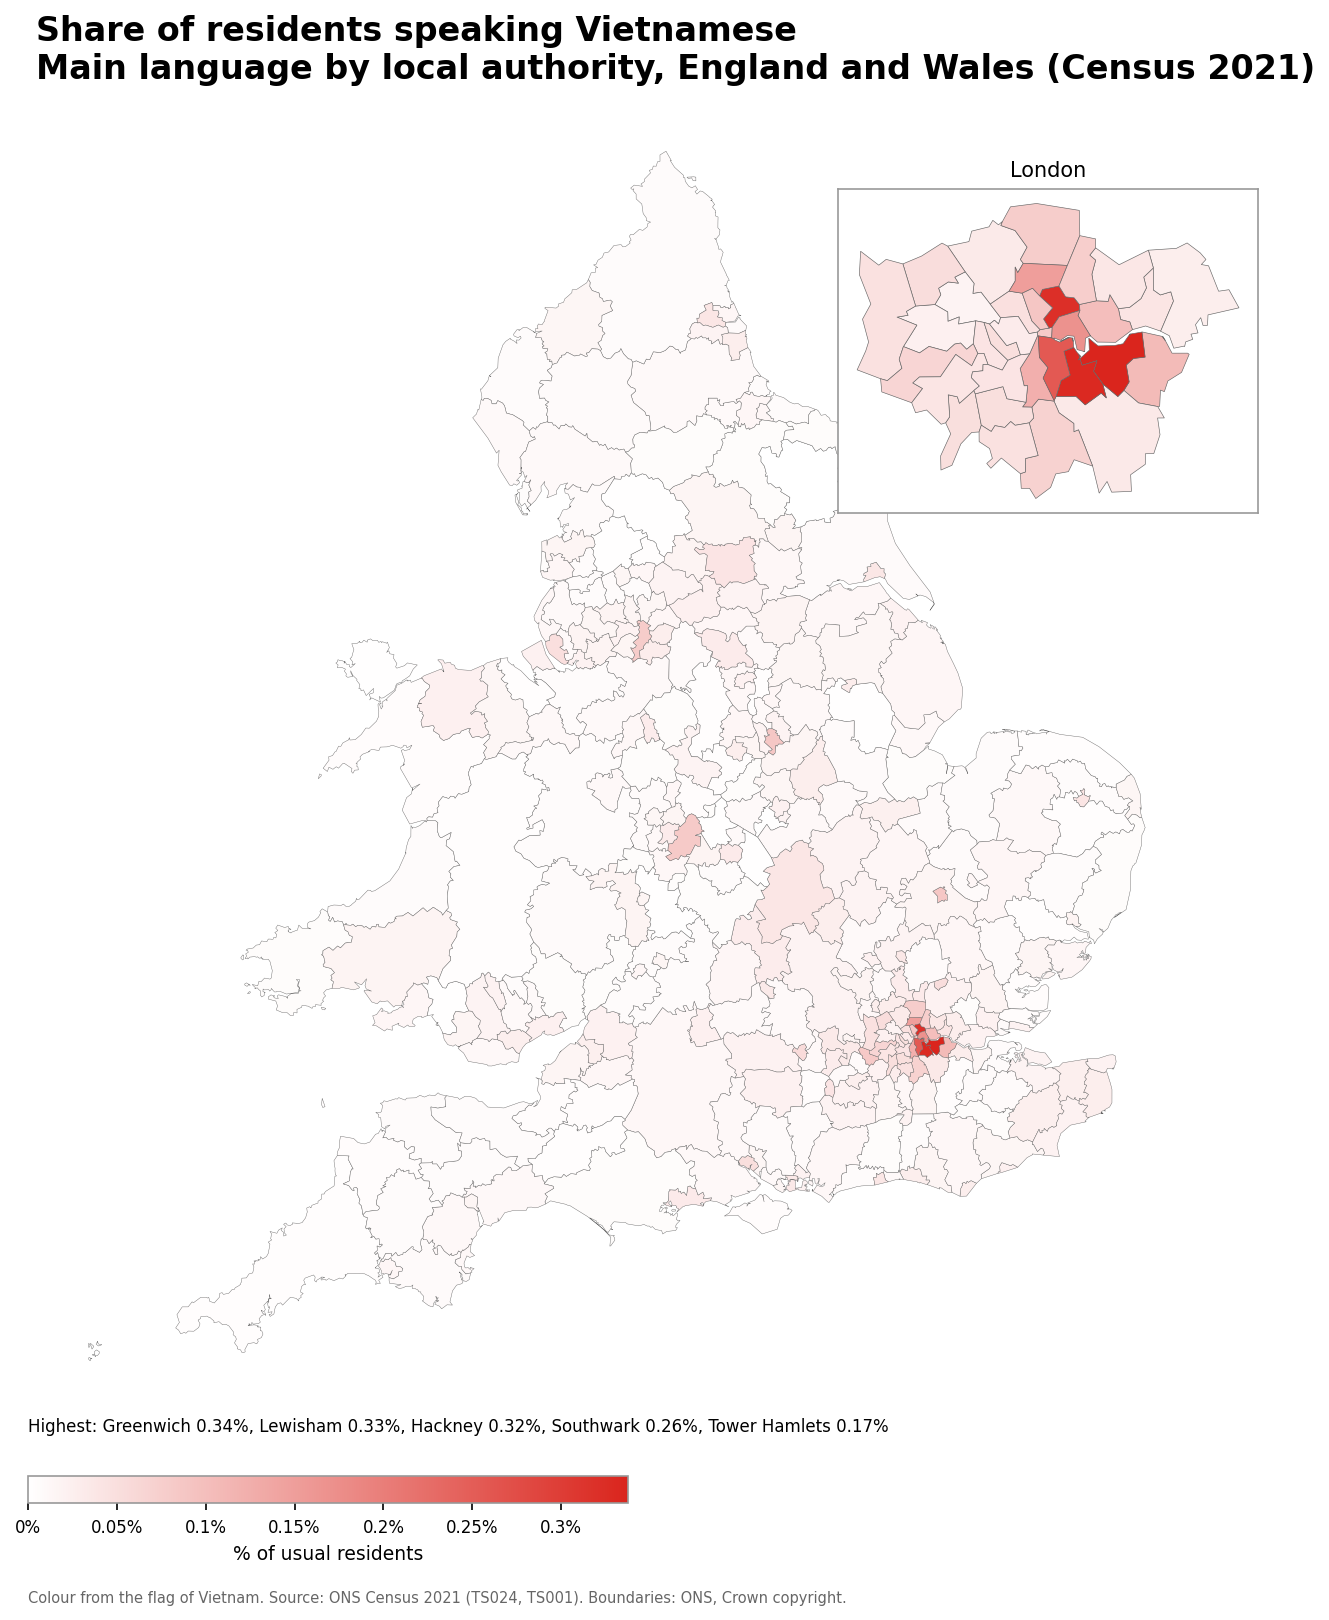
- Greenwich: 0.34% (976 speakers)
- Lewisham: 0.33% (991 speakers)
- Hackney: 0.32% (833 speakers)
- Southwark: 0.26% (788 speakers)
- Tower Hamlets: 0.17% (525 speakers)
Number of Thai speakers
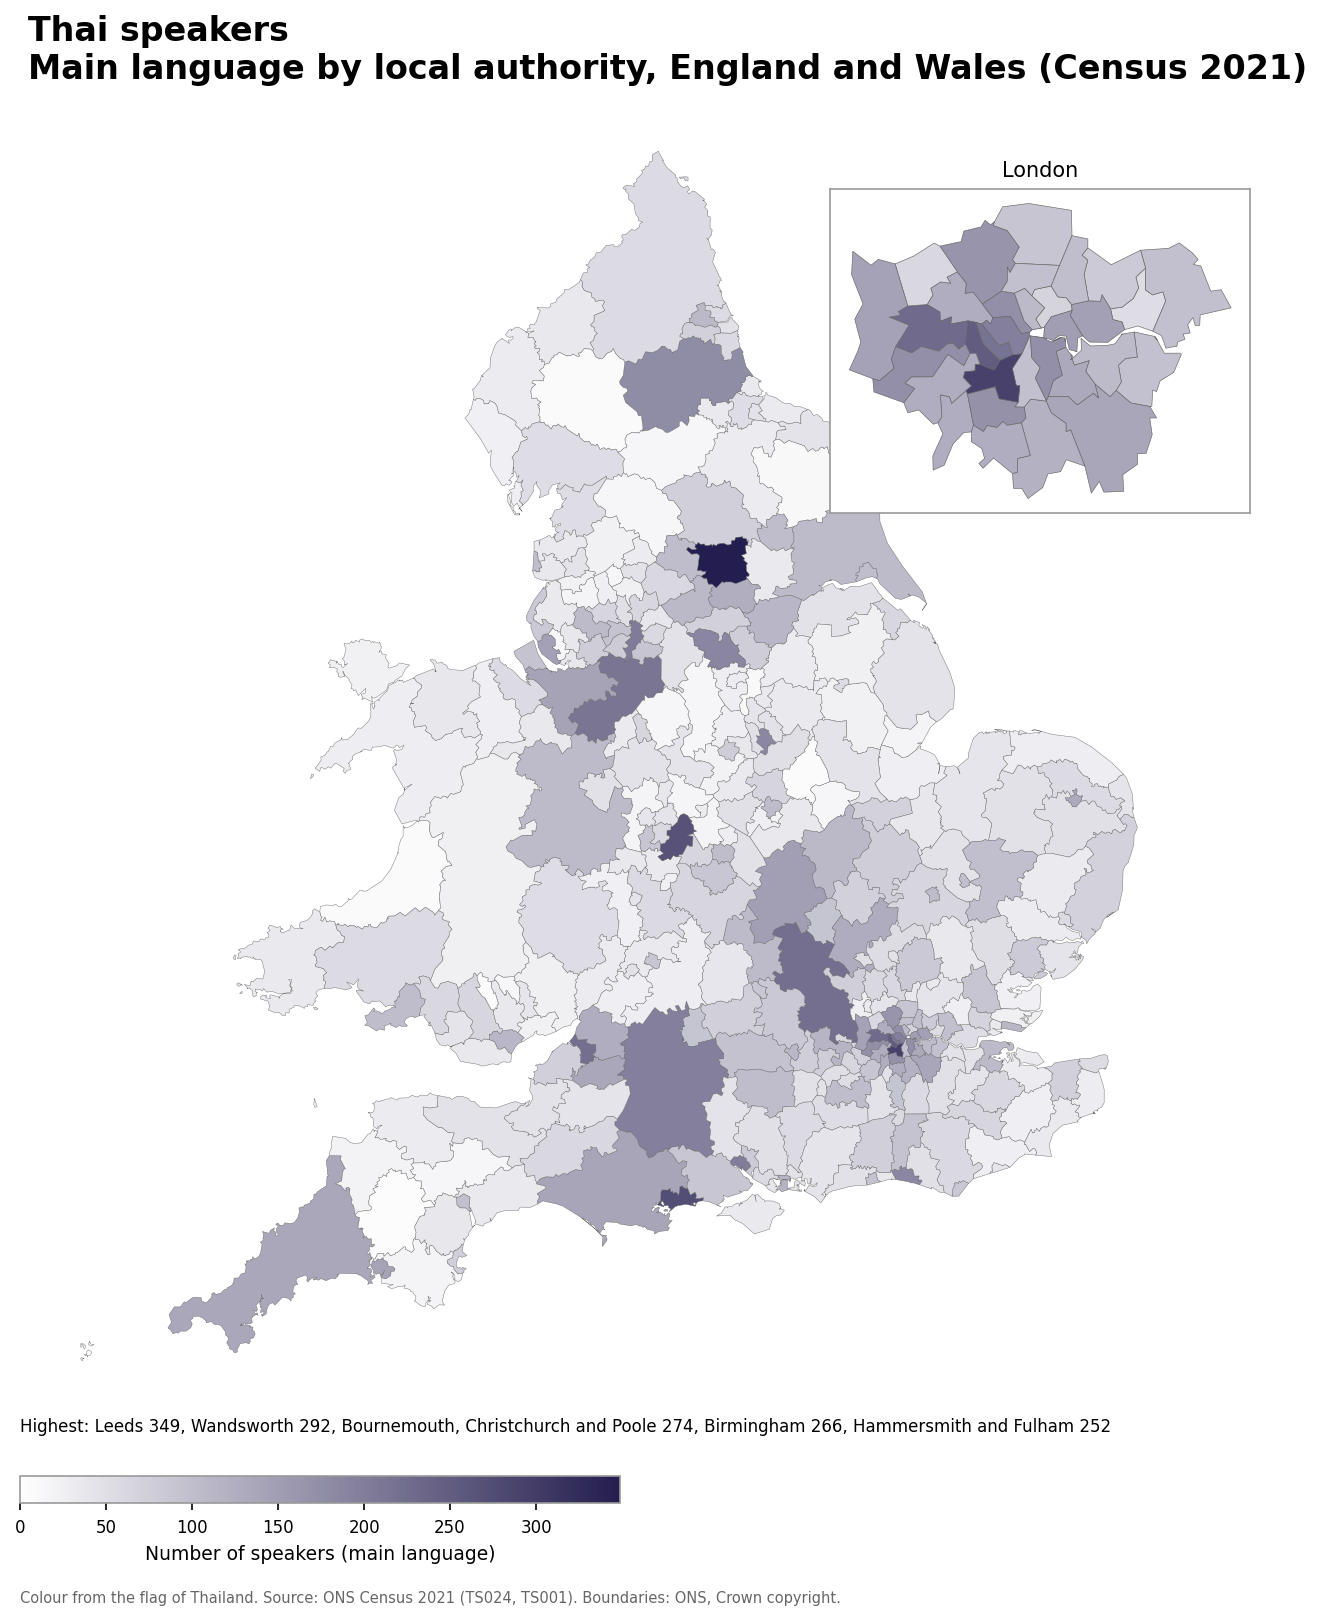
- Leeds: 349
- Wandsworth: 292
- Bournemouth, Christchurch and Poole: 274
- Birmingham: 266
- Hammersmith and Fulham: 252
Thai speakers as a share of the population
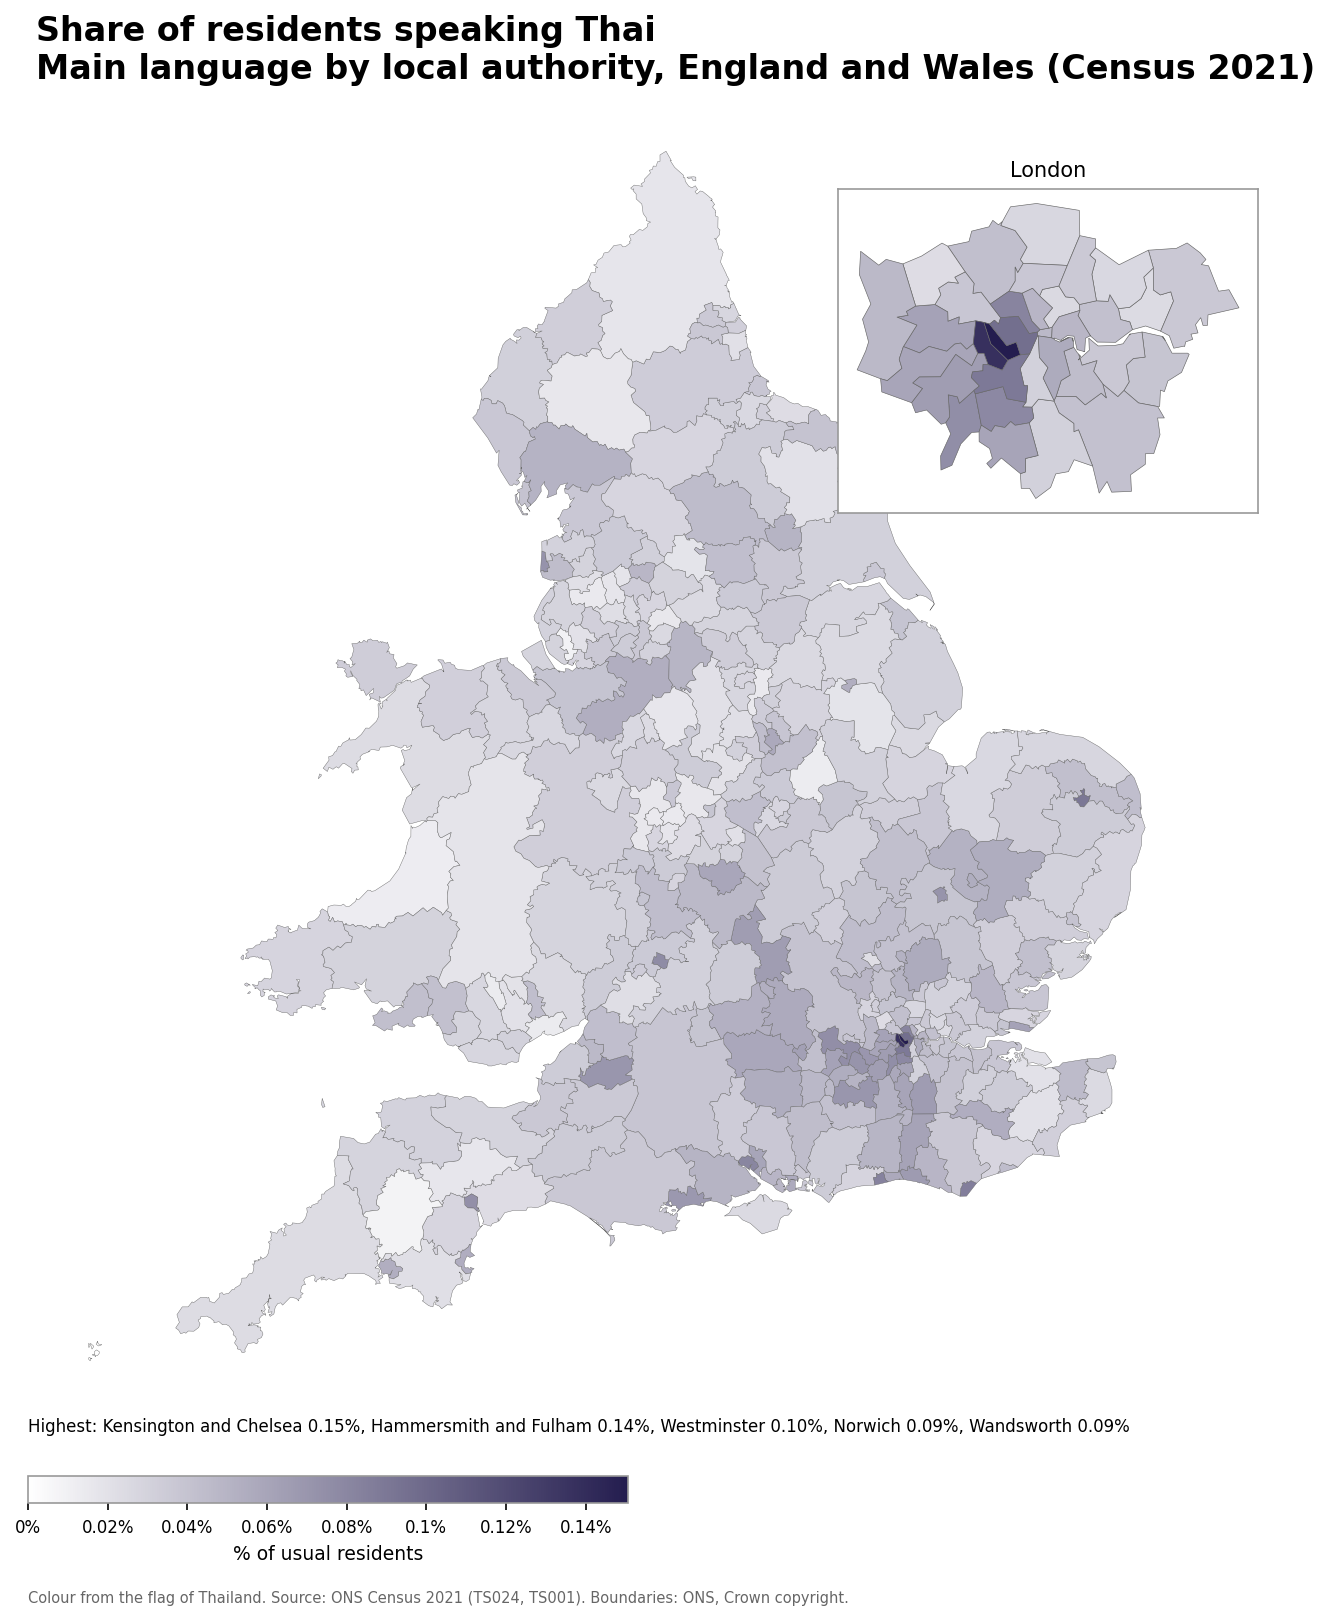
- Kensington and Chelsea: 0.15% (216 speakers)
- Hammersmith and Fulham: 0.14% (252 speakers)
- Westminster: 0.10% (197 speakers)
- Norwich: 0.09% (131 speakers)
- Wandsworth: 0.09% (292 speakers)
Number of Malay speakers
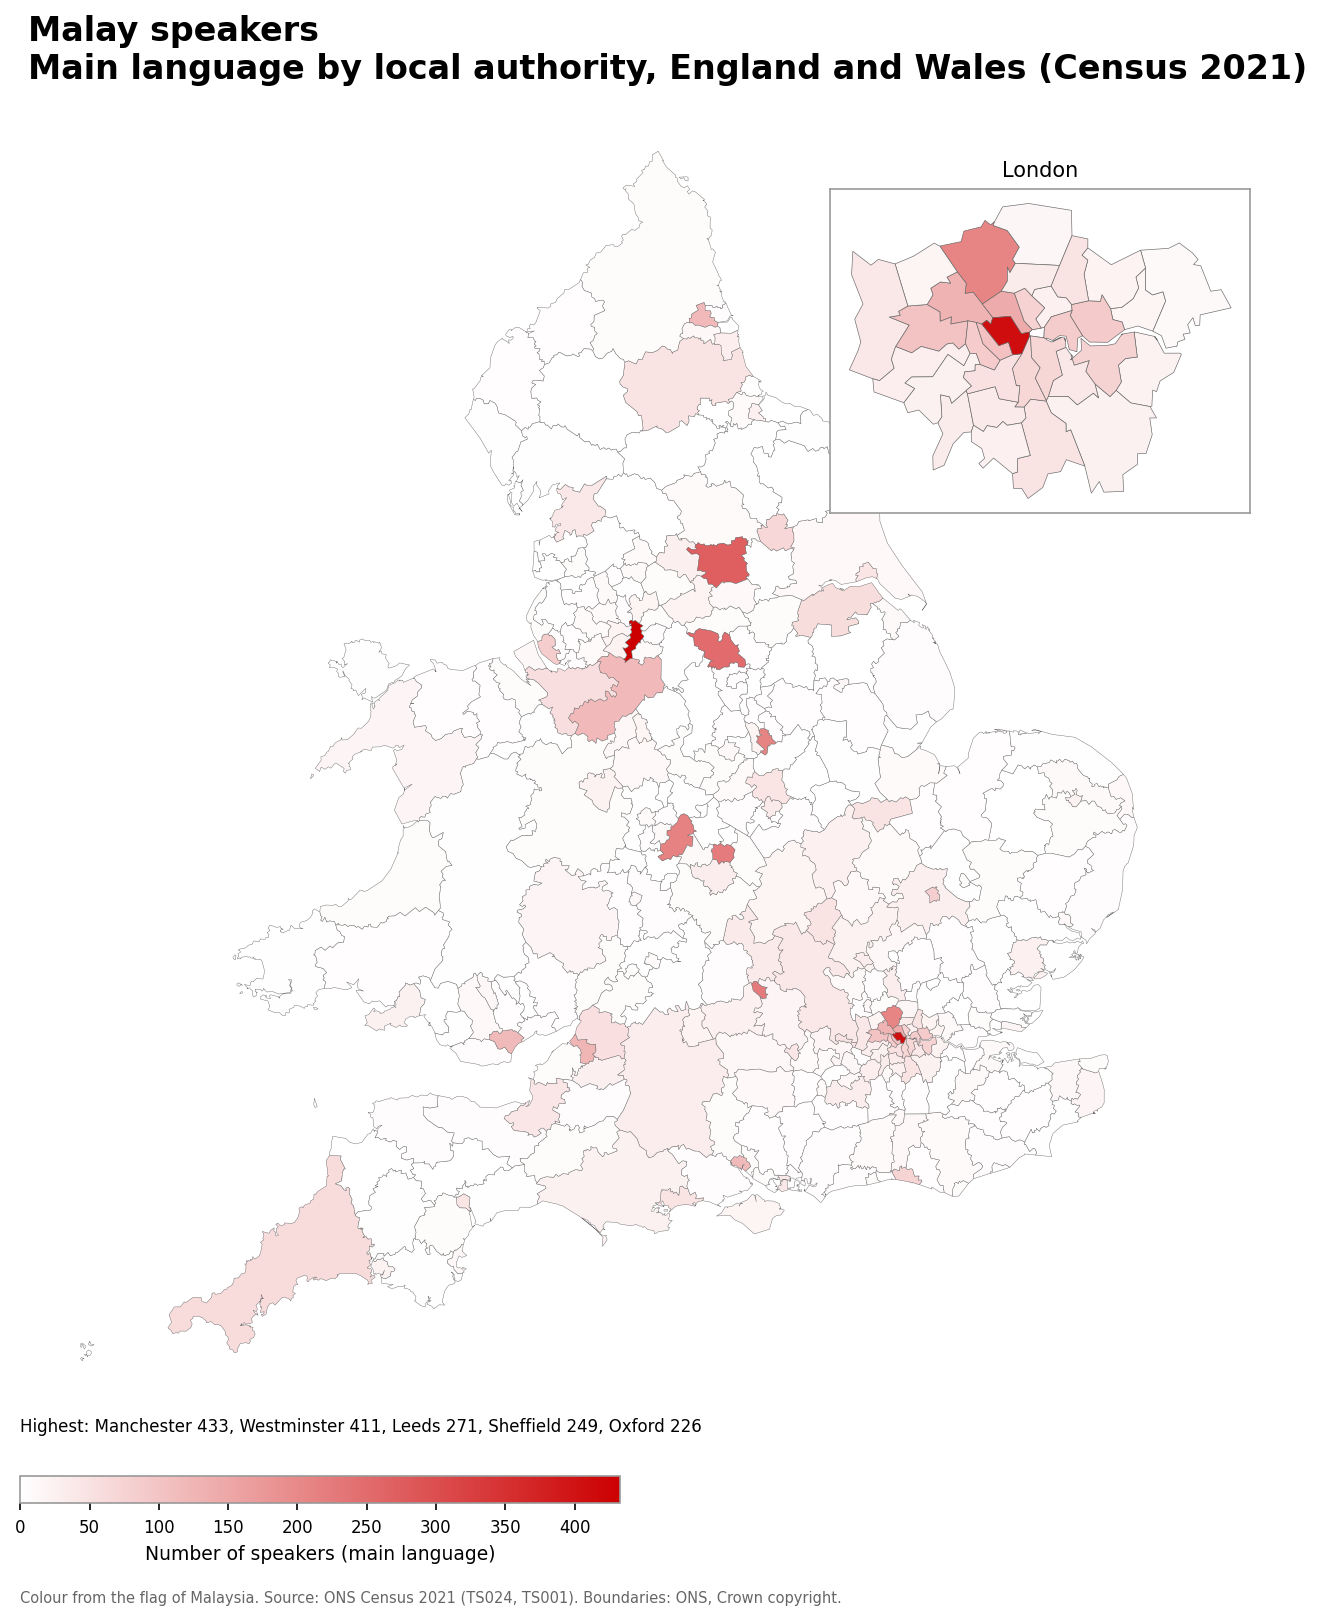
- Manchester: 433
- Westminster: 411
- Leeds: 271
- Sheffield: 249
- Oxford: 226
Malay speakers as a share of the population
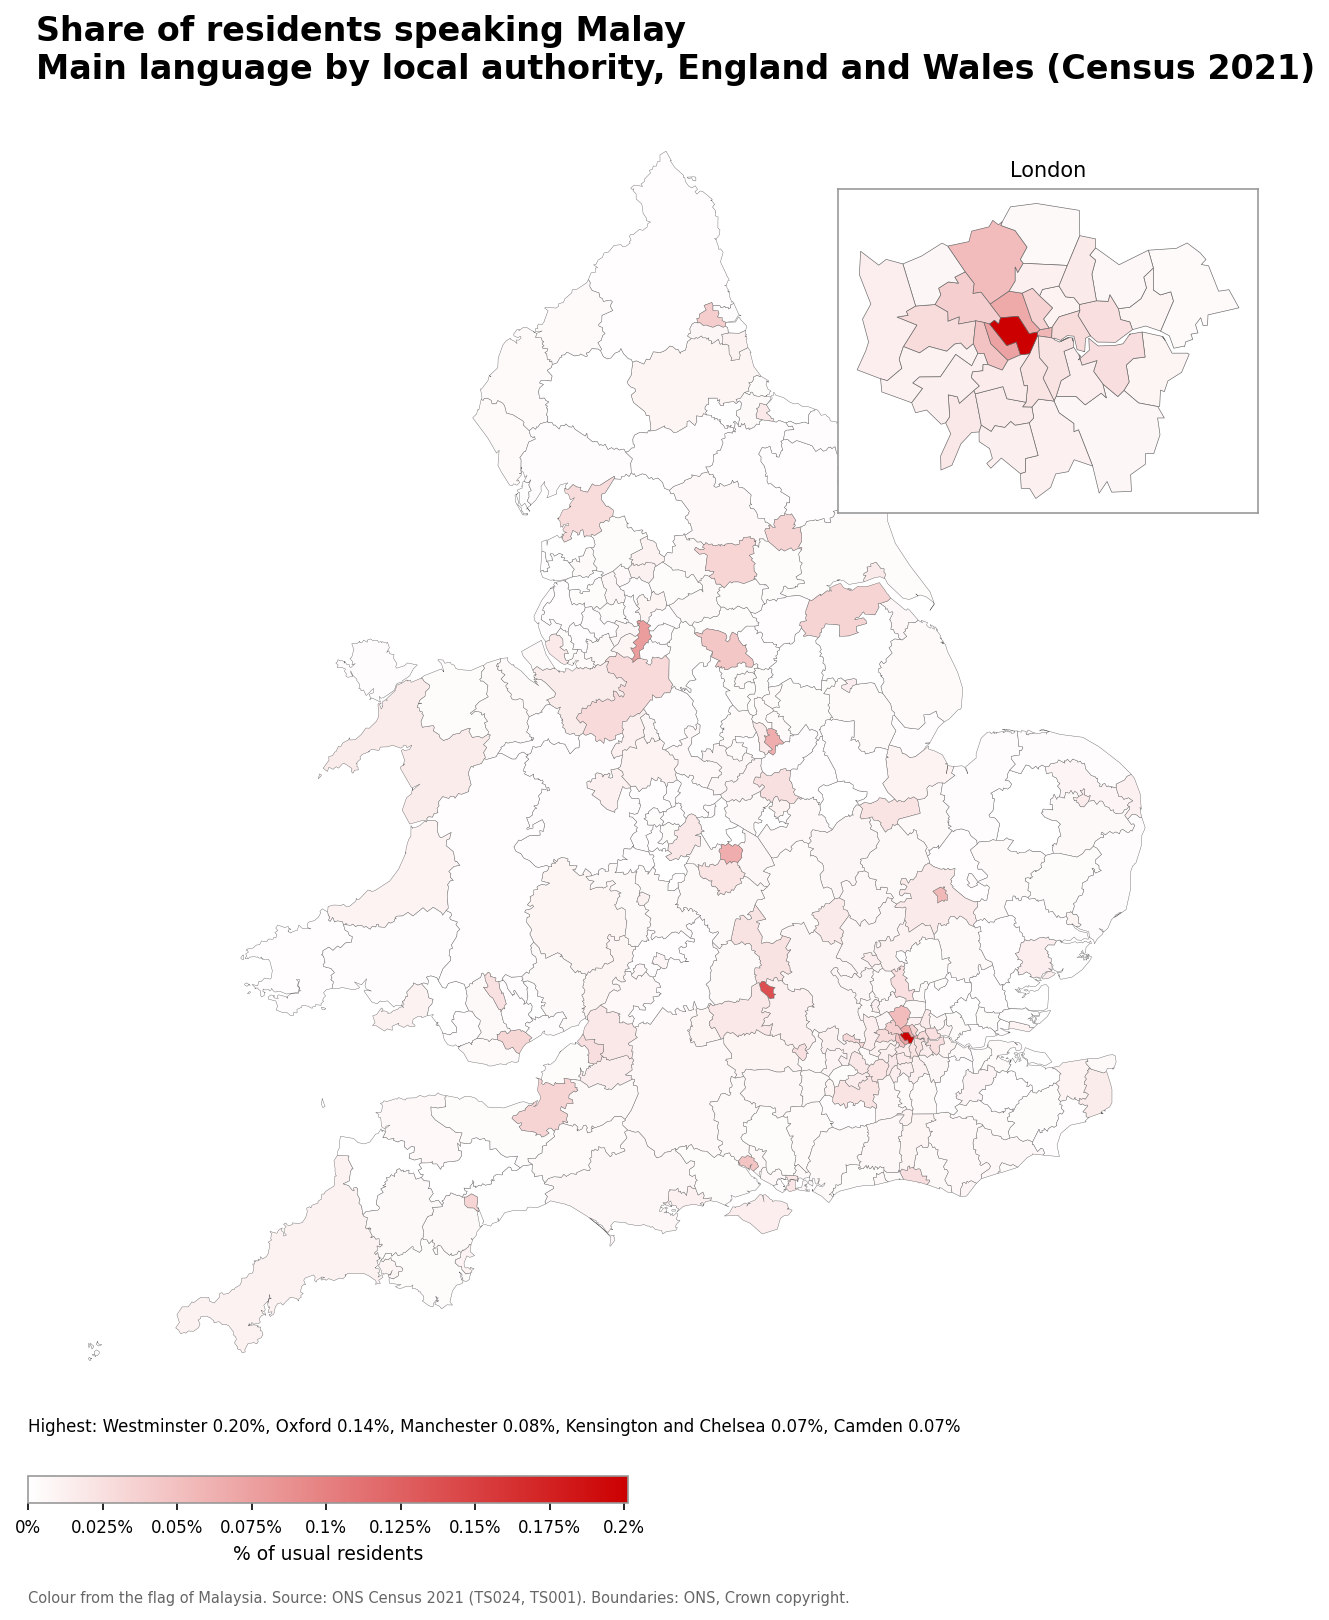
- Westminster: 0.20% (411 speakers)
- Oxford: 0.14% (226 speakers)
- Manchester: 0.08% (433 speakers)
- Kensington and Chelsea: 0.07% (105 speakers)
- Camden: 0.07% (143 speakers)
Number of Tagalog speakers
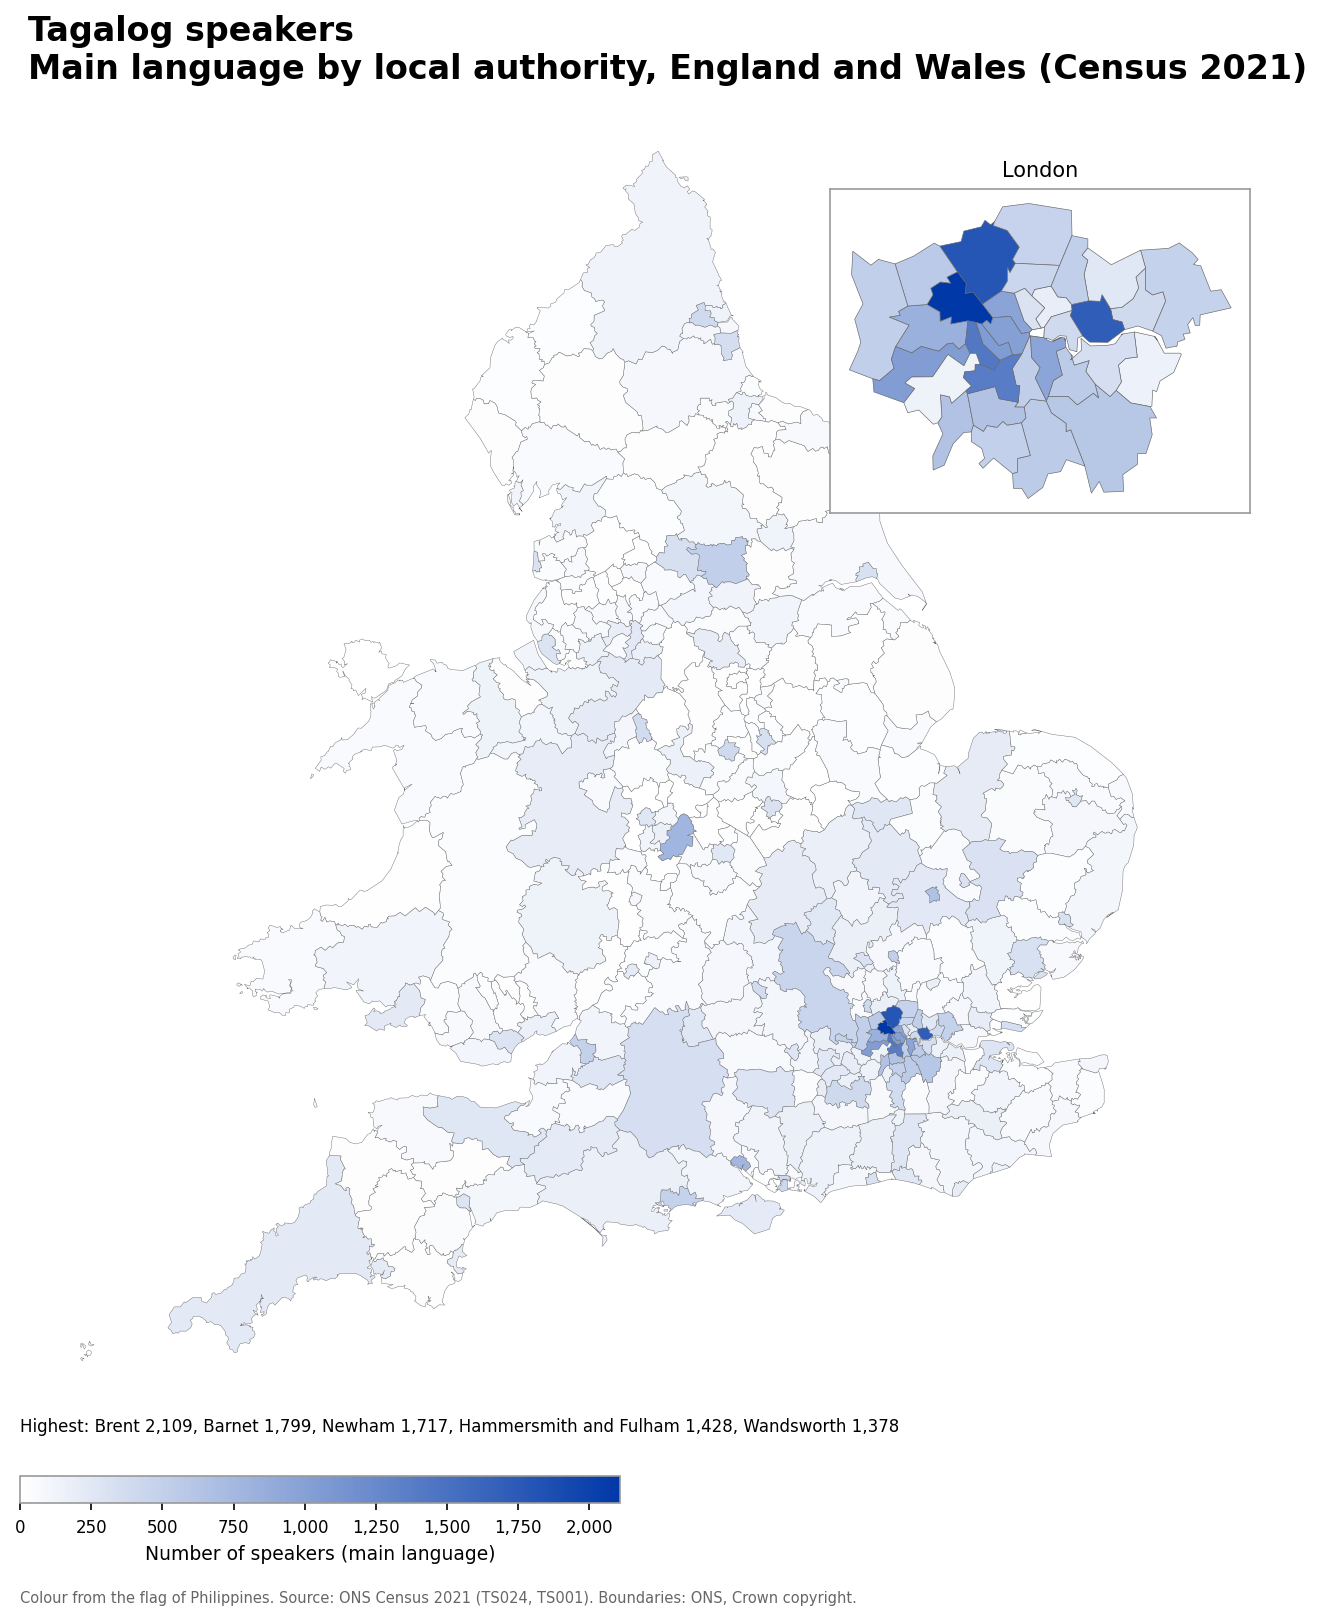
- Brent: 2,109
- Barnet: 1,799
- Newham: 1,717
- Hammersmith and Fulham: 1,428
- Wandsworth: 1,378
Tagalog speakers as a share of the population
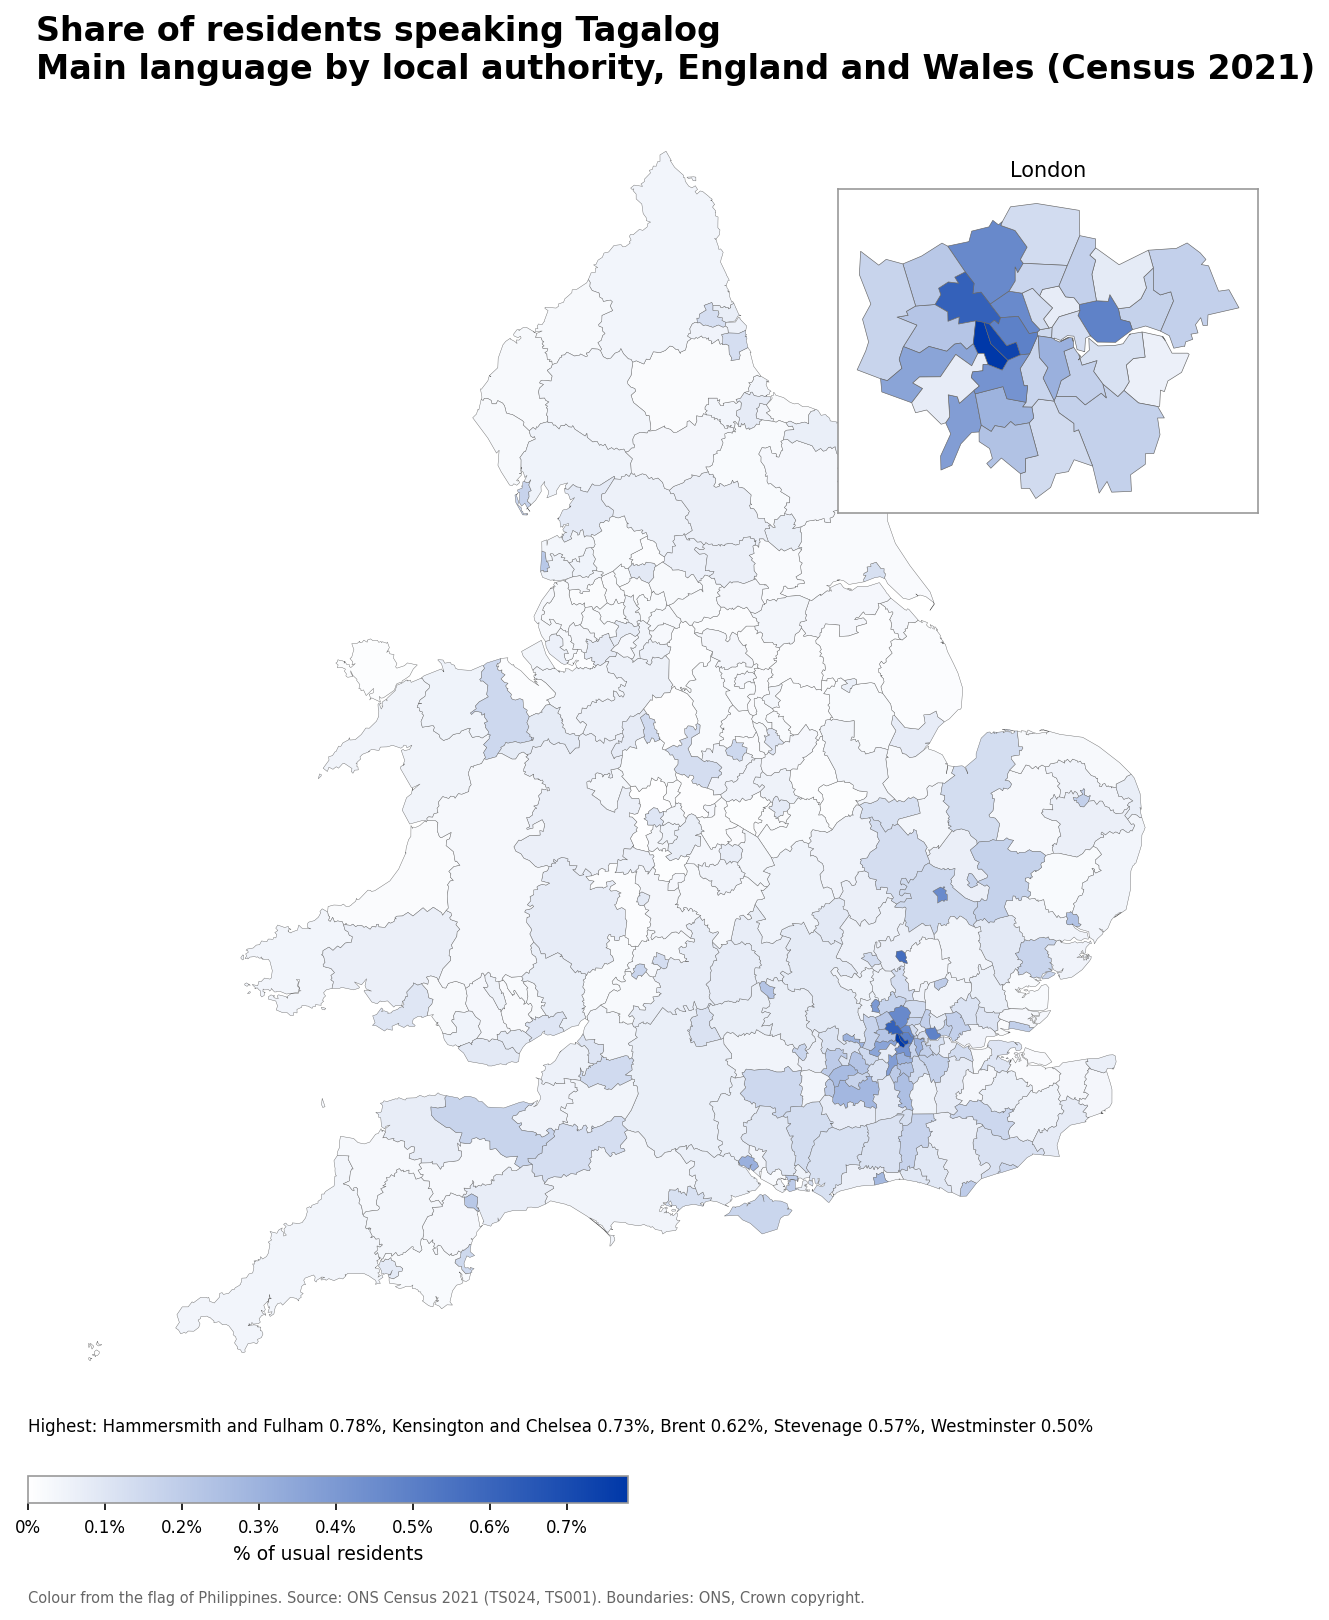
- Hammersmith and Fulham: 0.78% (1,428 speakers)
- Kensington and Chelsea: 0.73% (1,051 speakers)
- Brent: 0.62% (2,109 speakers)
- Stevenage: 0.57% (509 speakers)
- Westminster: 0.50% (1,013 speakers)
Number of Amharic speakers
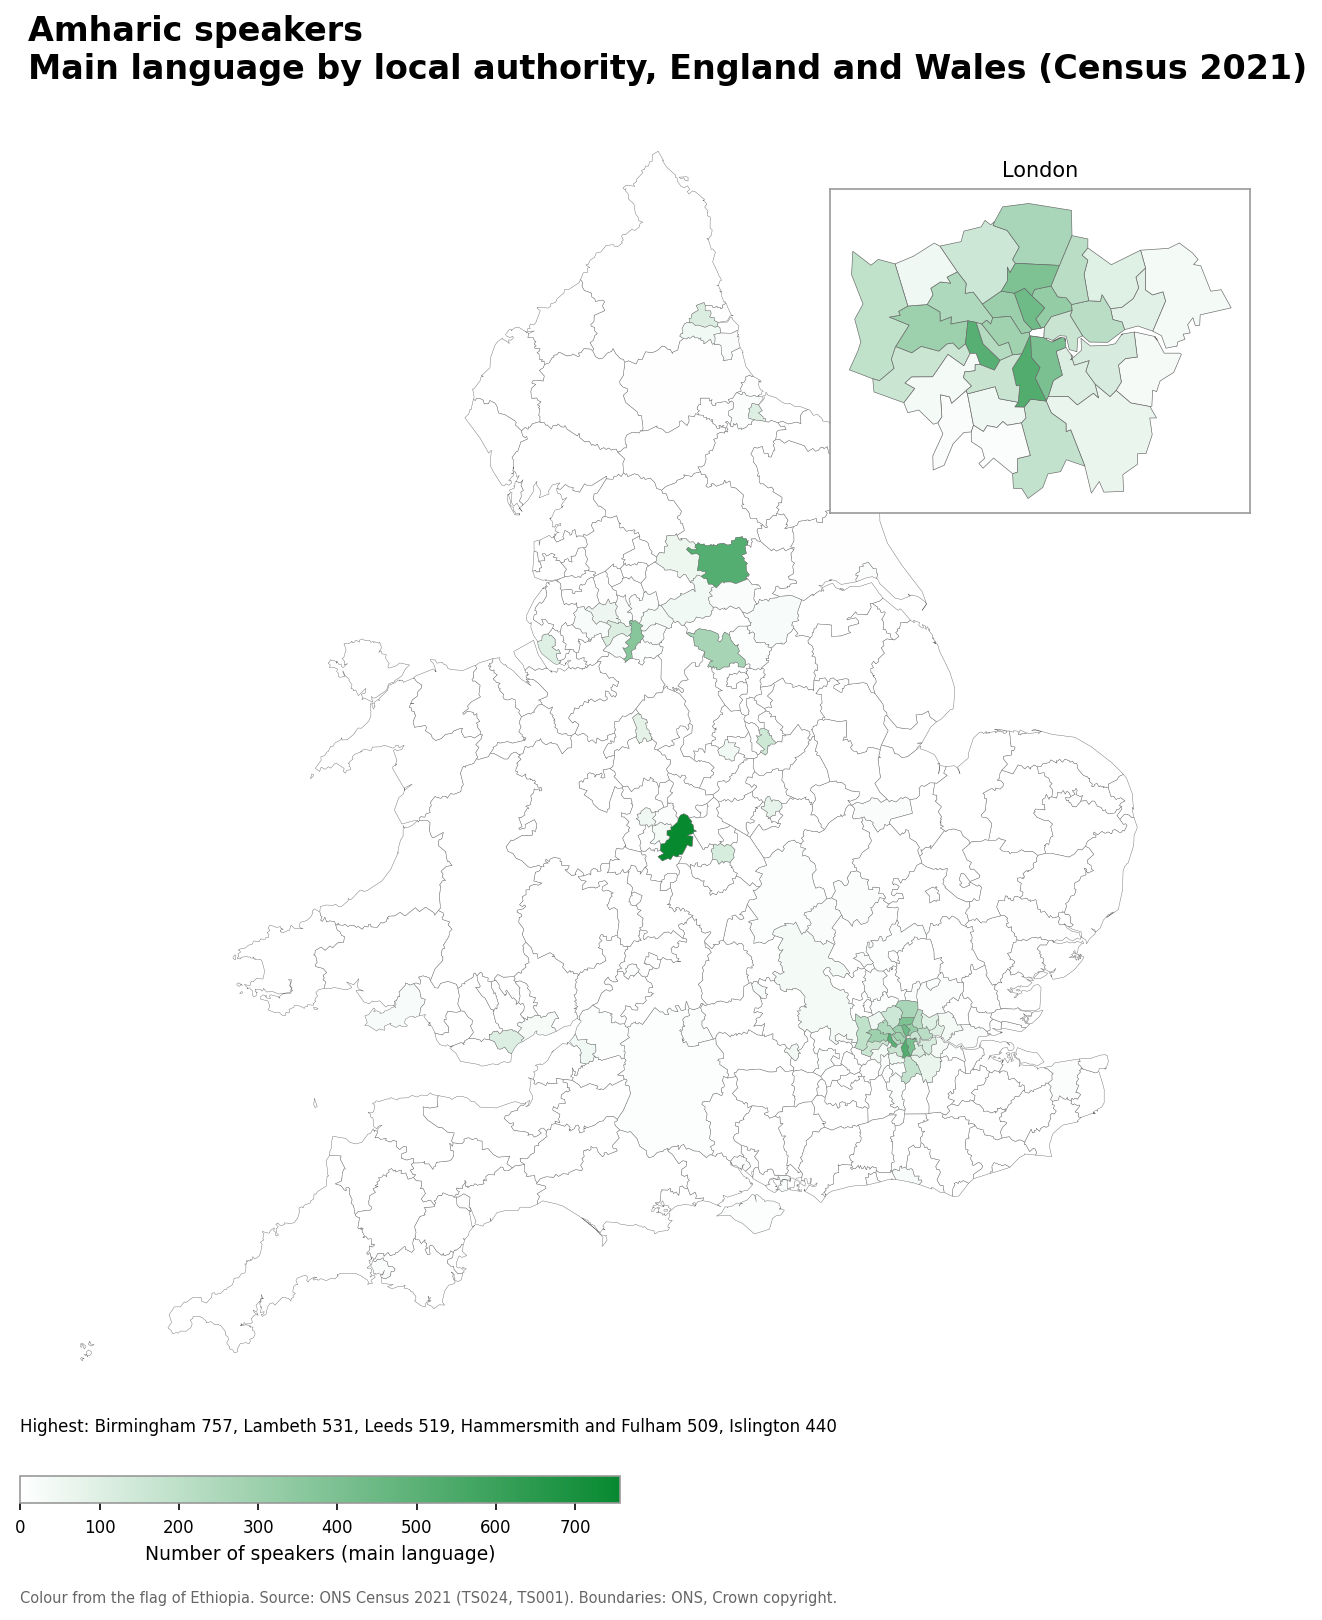
- Birmingham: 757
- Lambeth: 531
- Leeds: 519
- Hammersmith and Fulham: 509
- Islington: 440
Amharic speakers as a share of the population
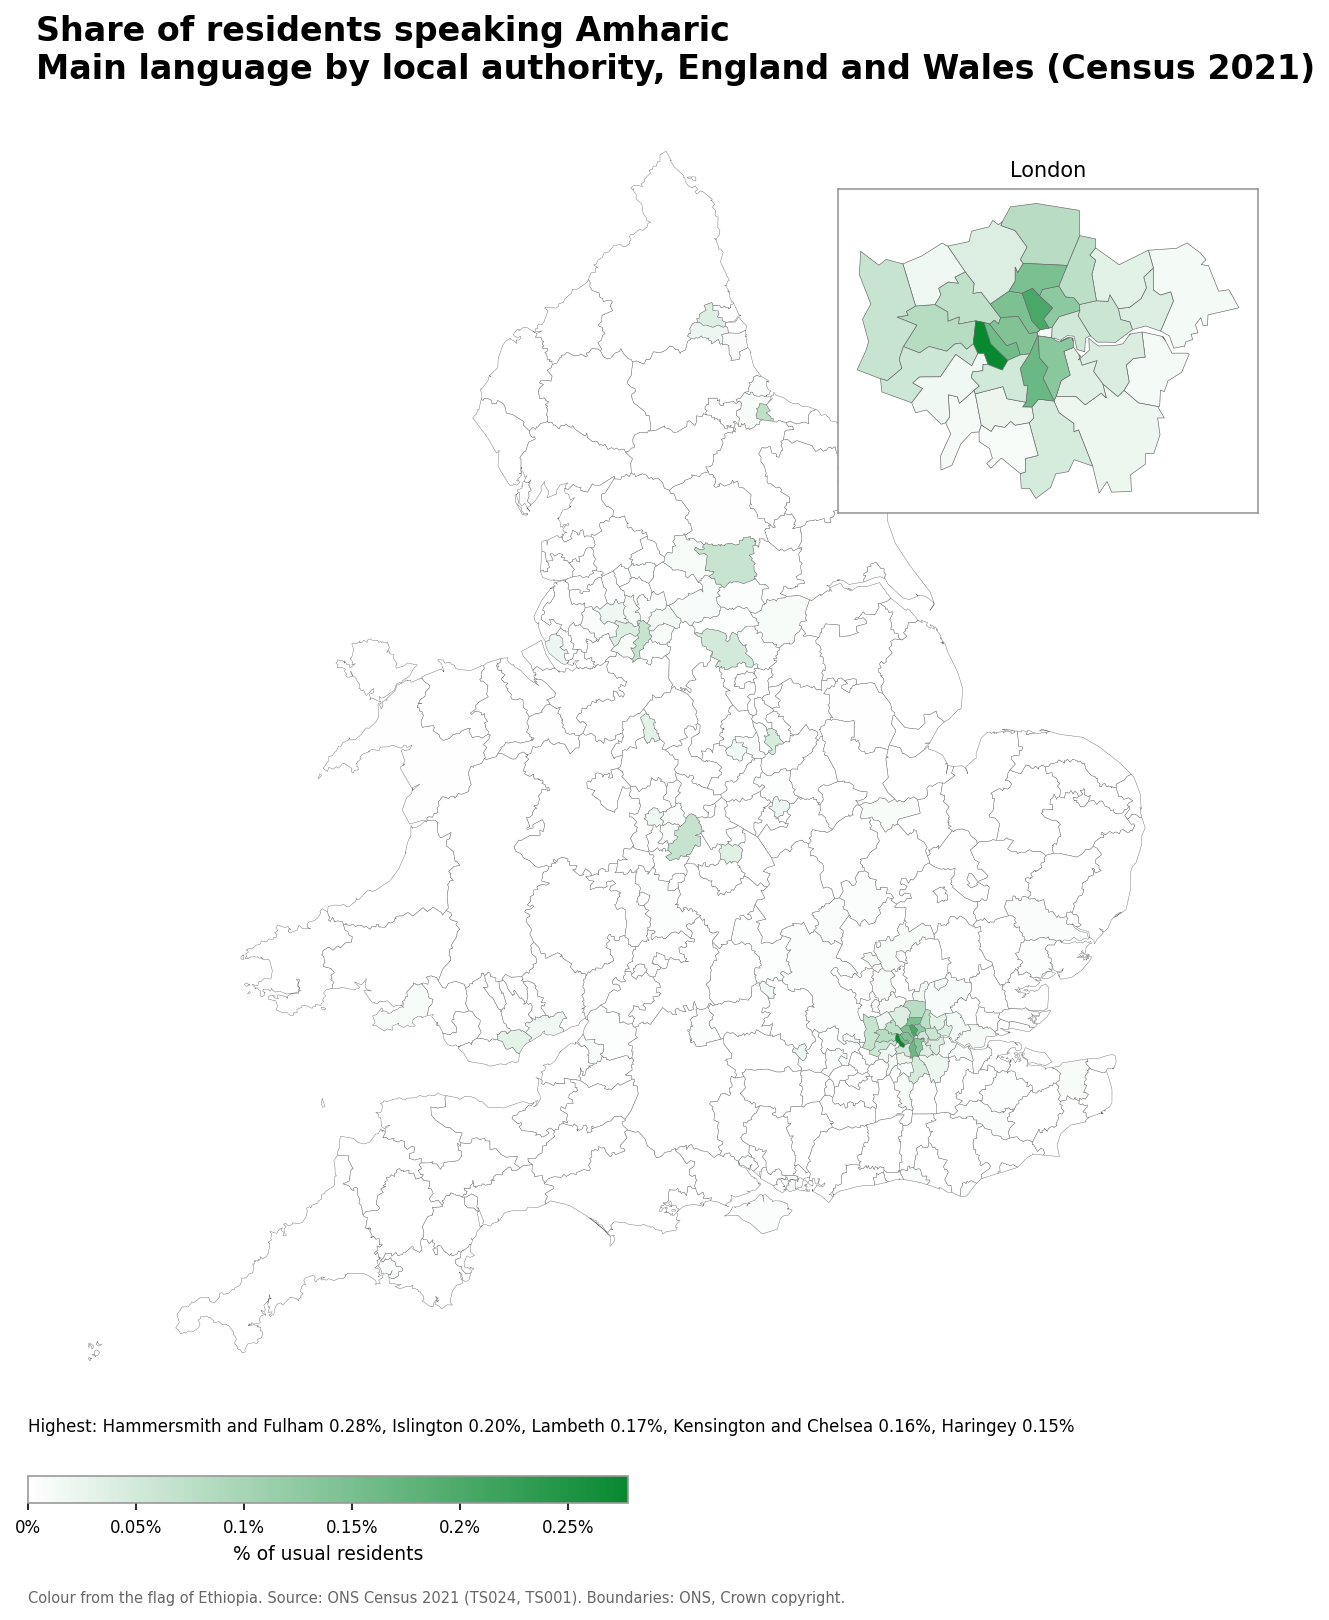
- Hammersmith and Fulham: 0.28% (509 speakers)
- Islington: 0.20% (440 speakers)
- Lambeth: 0.17% (531 speakers)
- Kensington and Chelsea: 0.16% (230 speakers)
- Haringey: 0.15% (394 speakers)
Number of Tigrinya speakers
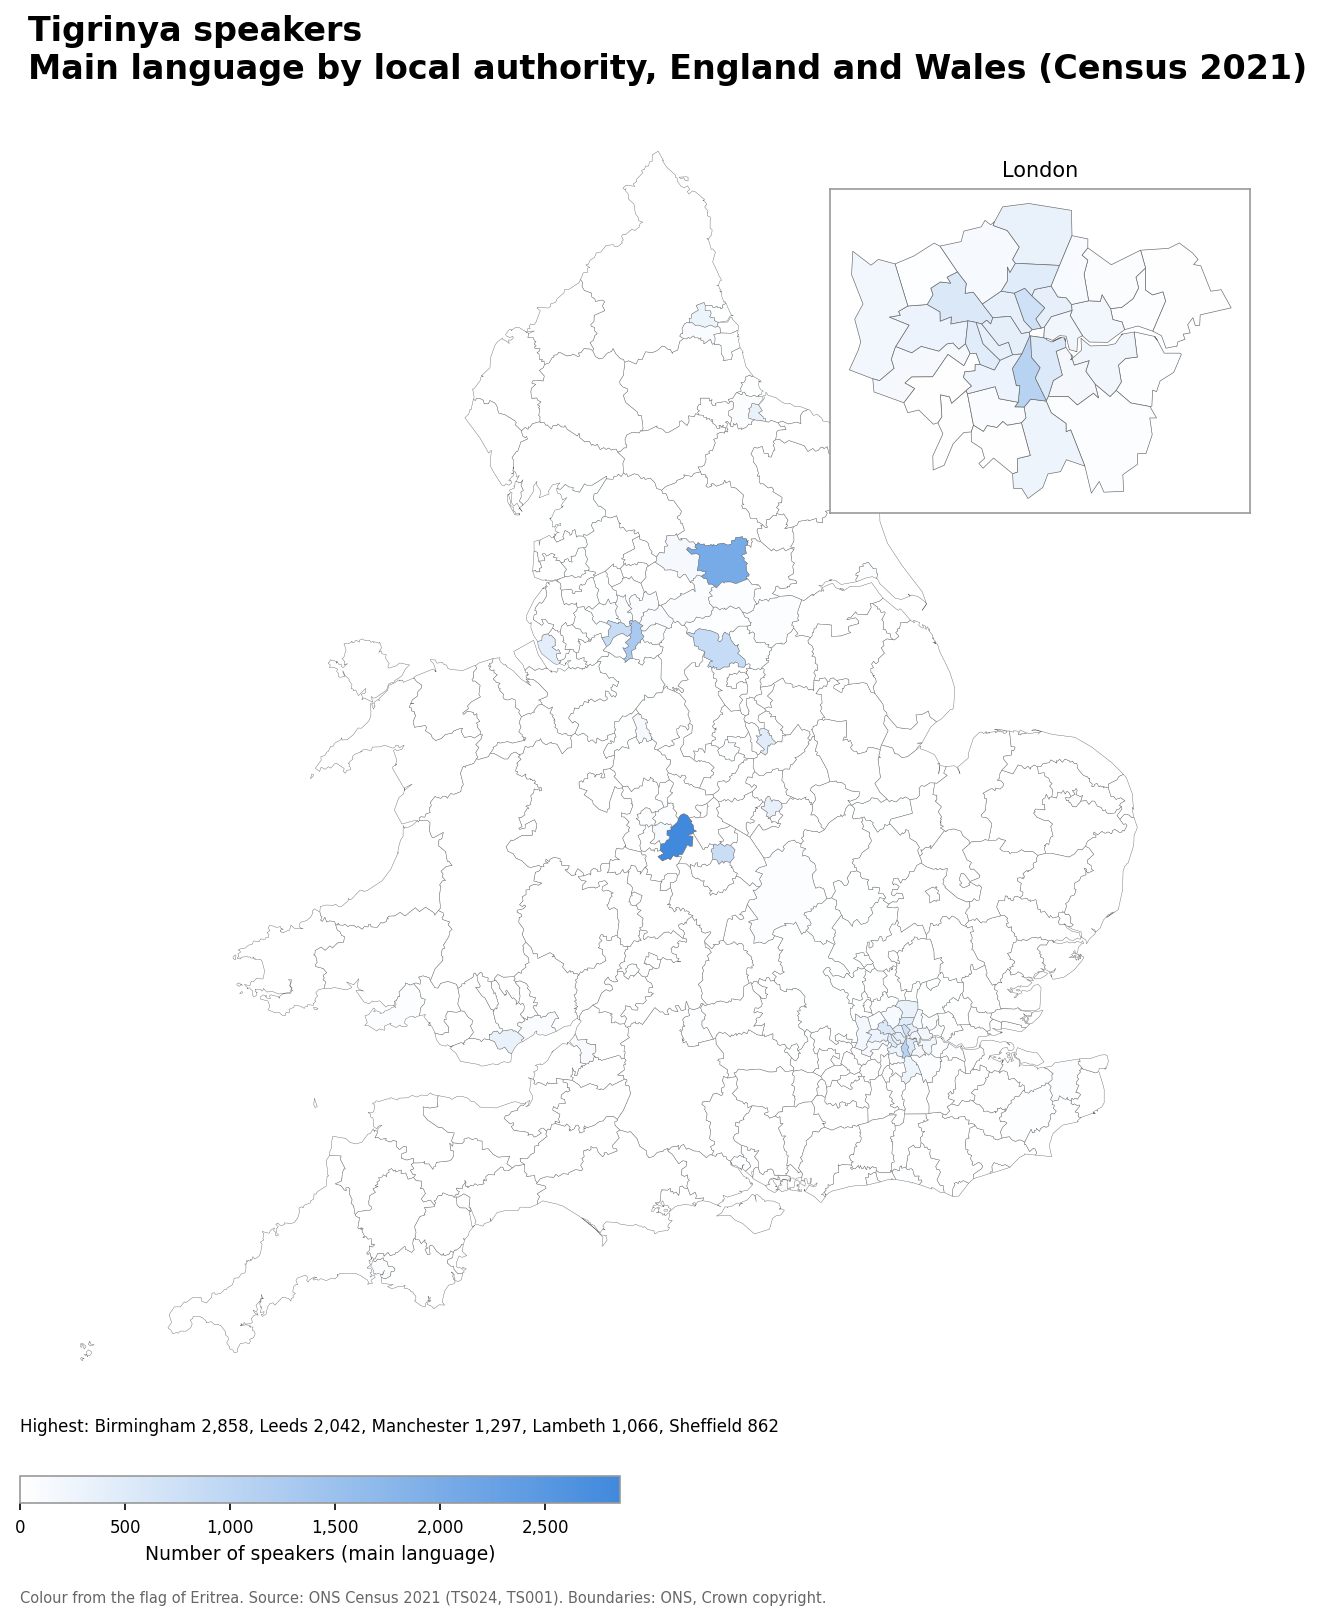
- Birmingham: 2,858
- Leeds: 2,042
- Manchester: 1,297
- Lambeth: 1,066
- Sheffield: 862
Tigrinya speakers as a share of the population
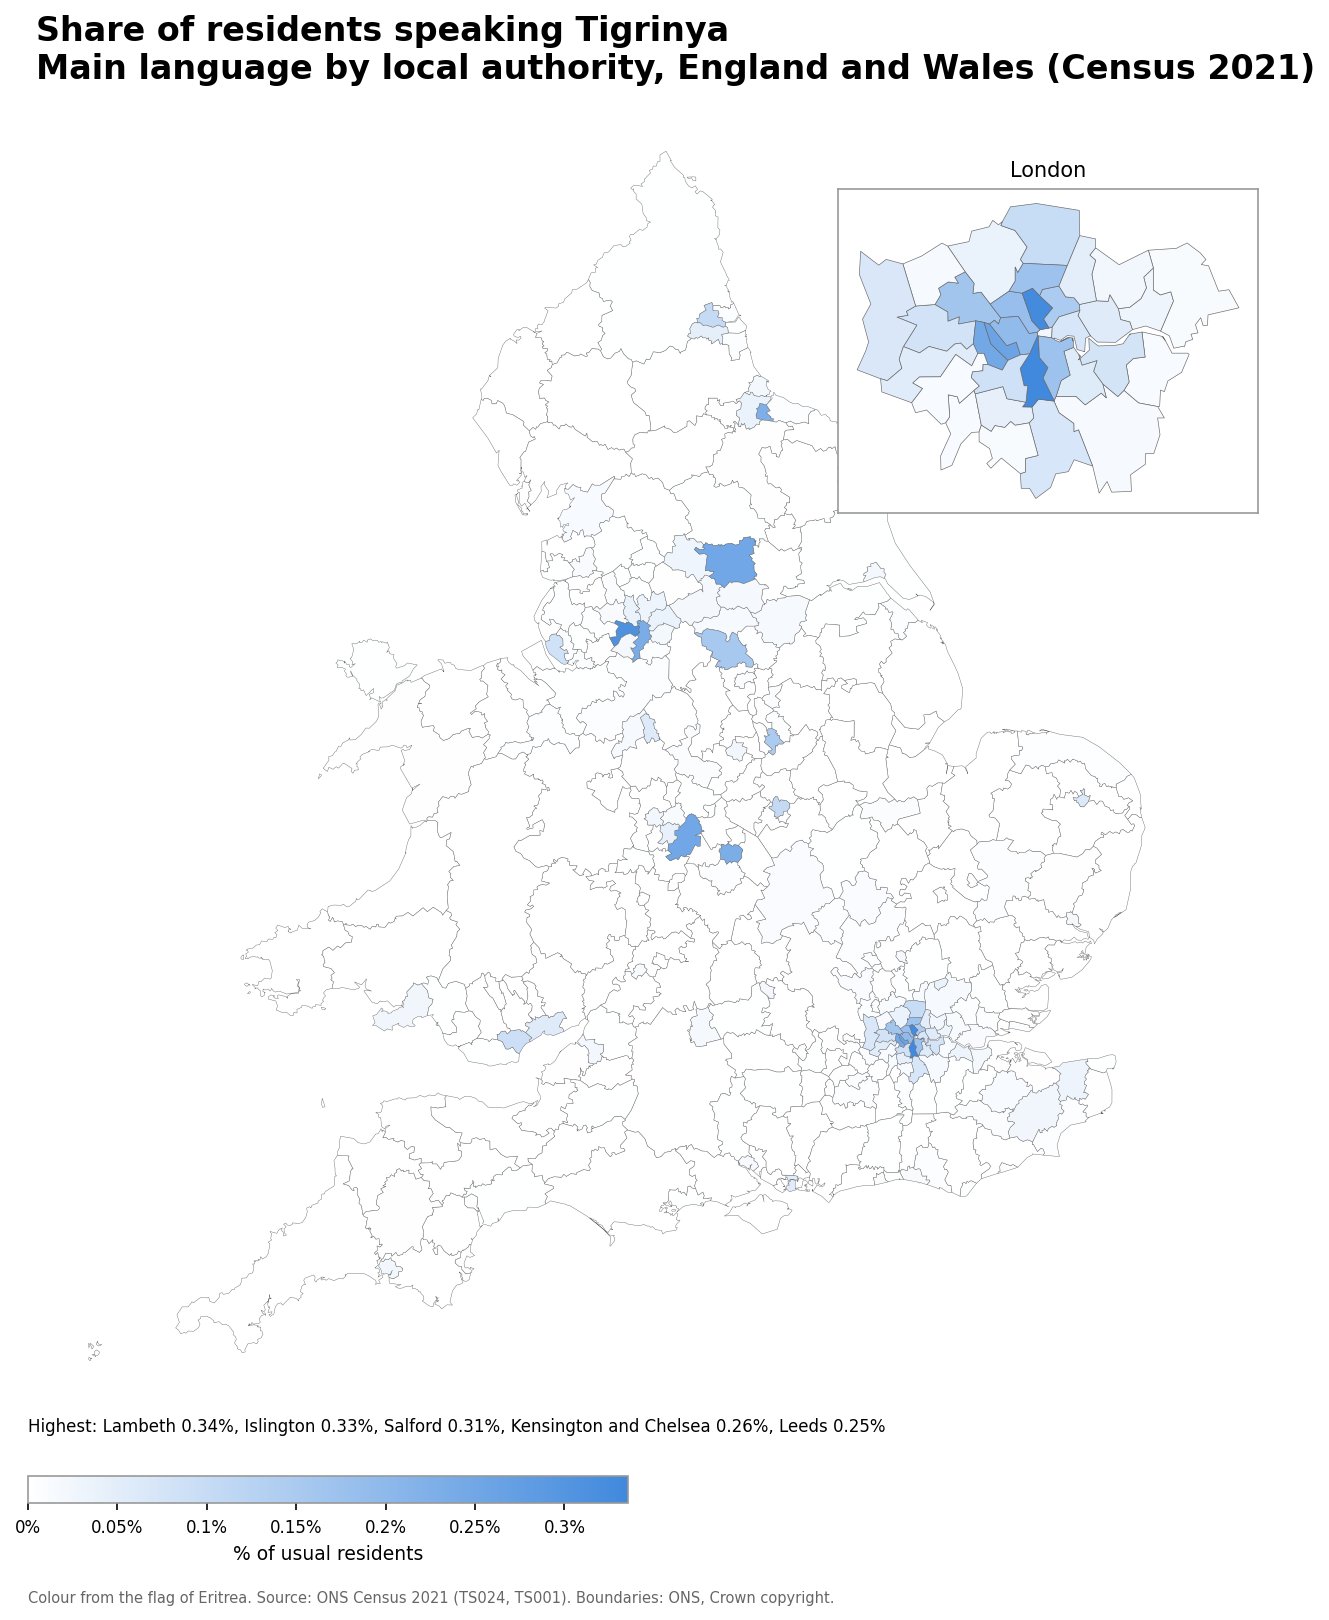
- Lambeth: 0.34% (1,066 speakers)
- Islington: 0.33% (715 speakers)
- Salford: 0.31% (845 speakers)
- Kensington and Chelsea: 0.26% (373 speakers)
- Leeds: 0.25% (2,042 speakers)
Number of Somali speakers
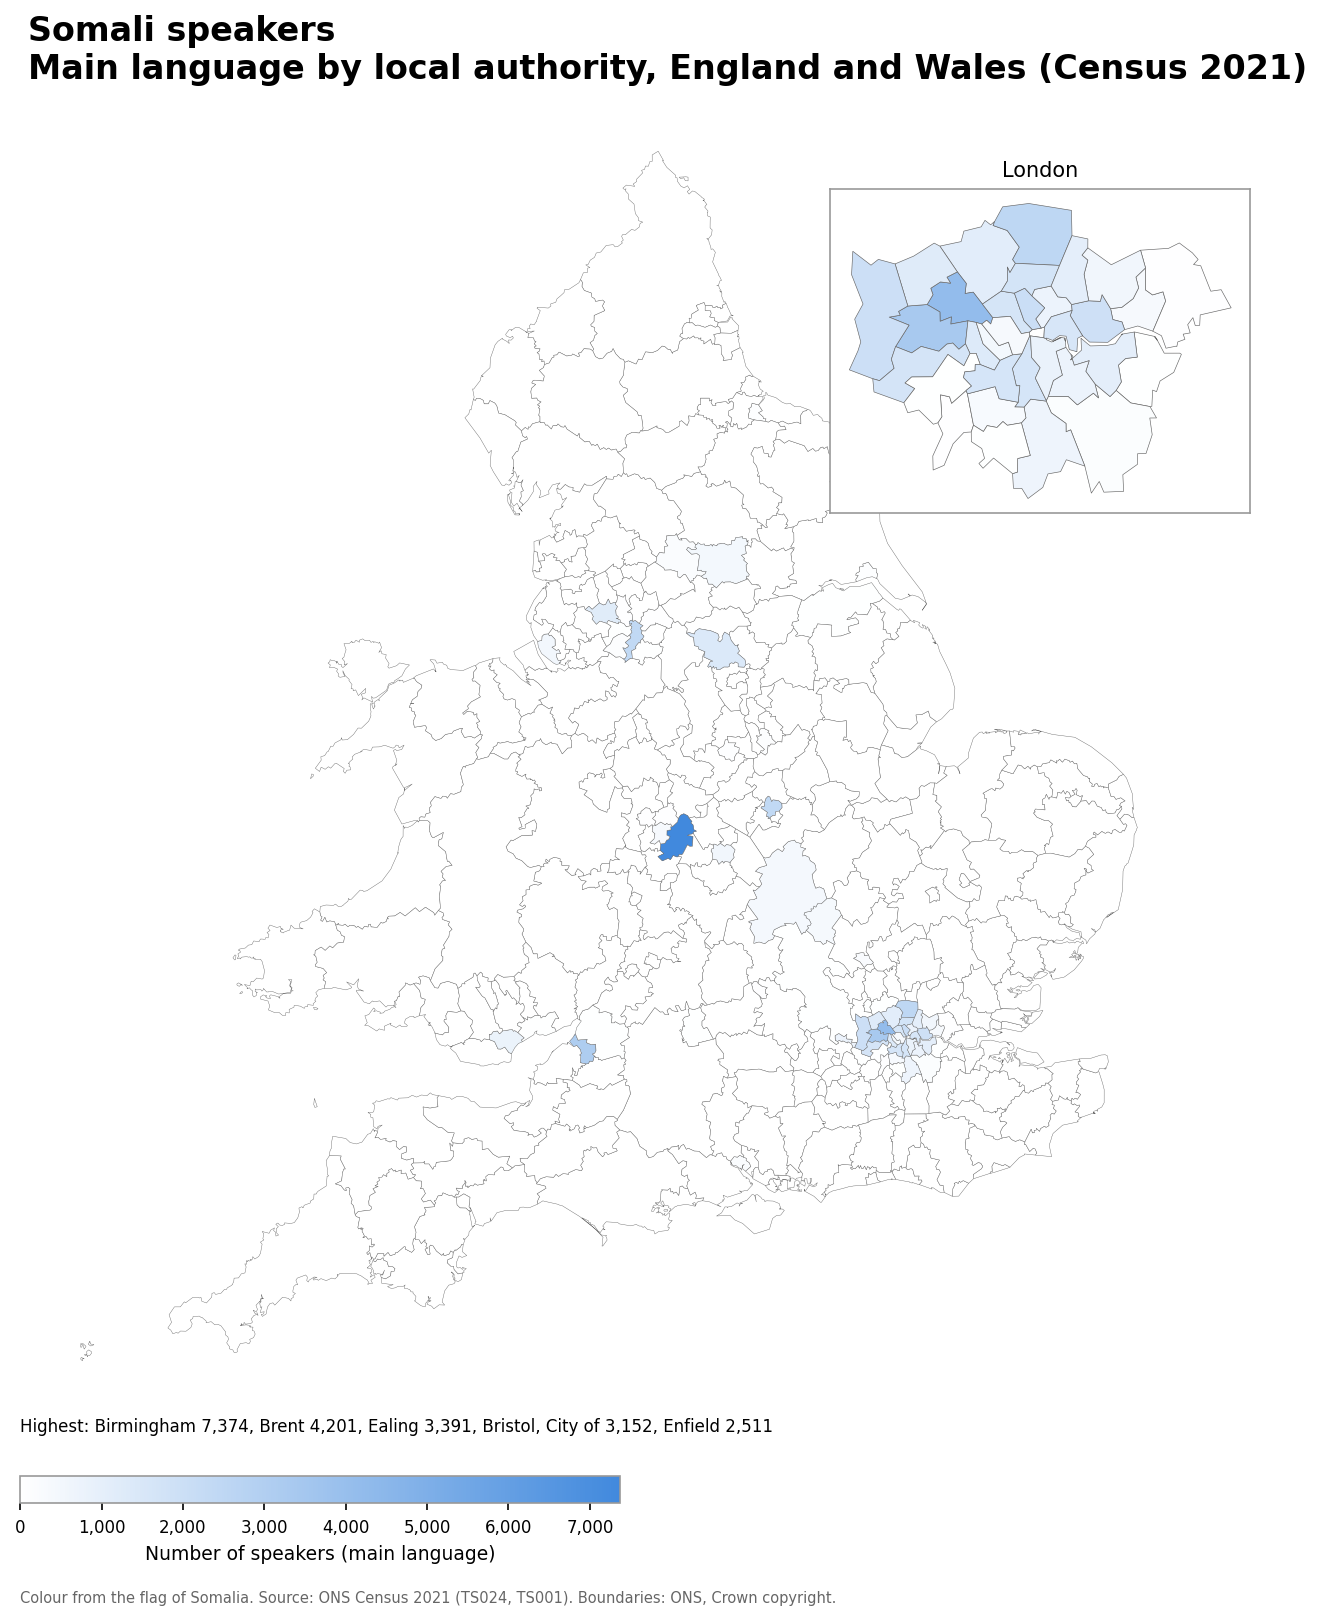
- Birmingham: 7,374
- Brent: 4,201
- Ealing: 3,391
- Bristol: 3,152
- Enfield: 2,511
Somali speakers as a share of the population
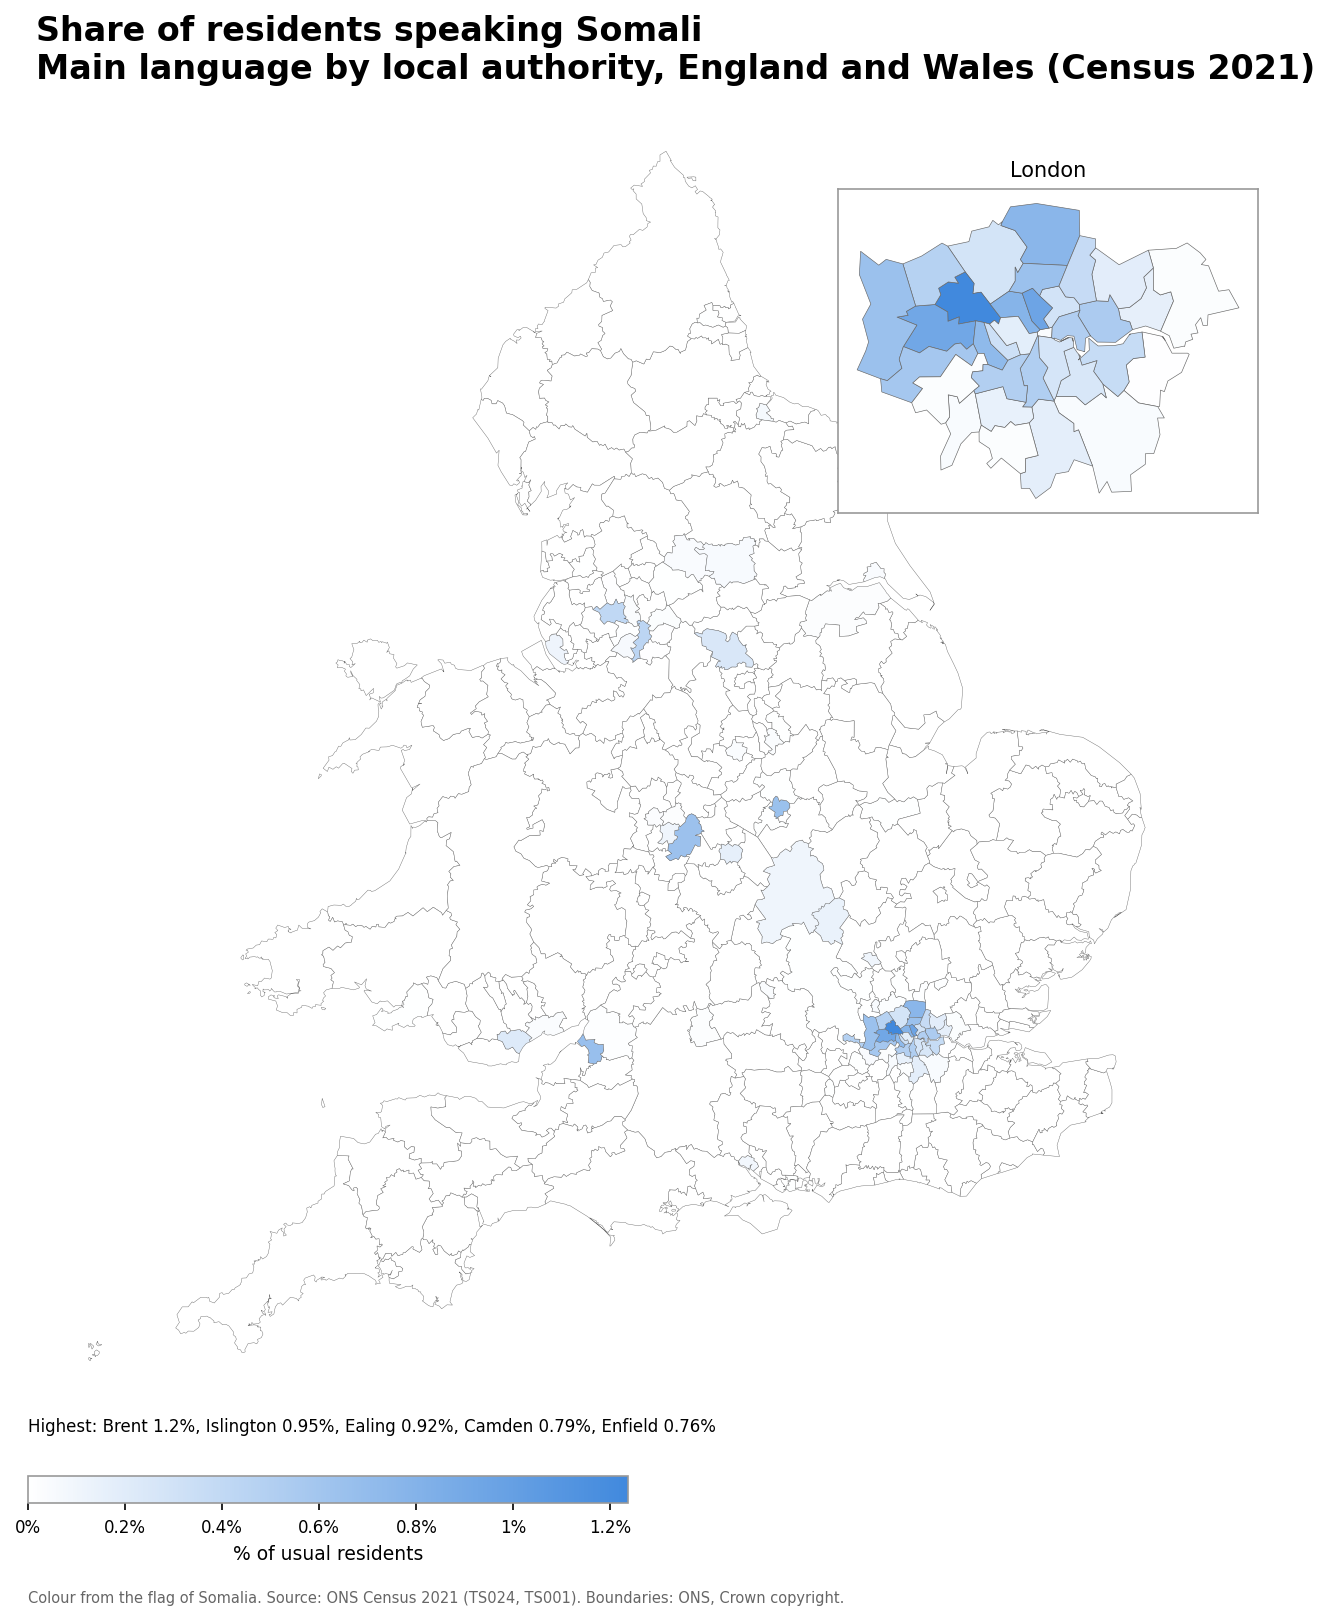
- Brent: 1.2% (4,201 speakers)
- Islington: 0.95% (2,056 speakers)
- Ealing: 0.92% (3,391 speakers)
- Camden: 0.79% (1,651 speakers)
- Enfield: 0.76% (2,511 speakers)
Number of Krio speakers
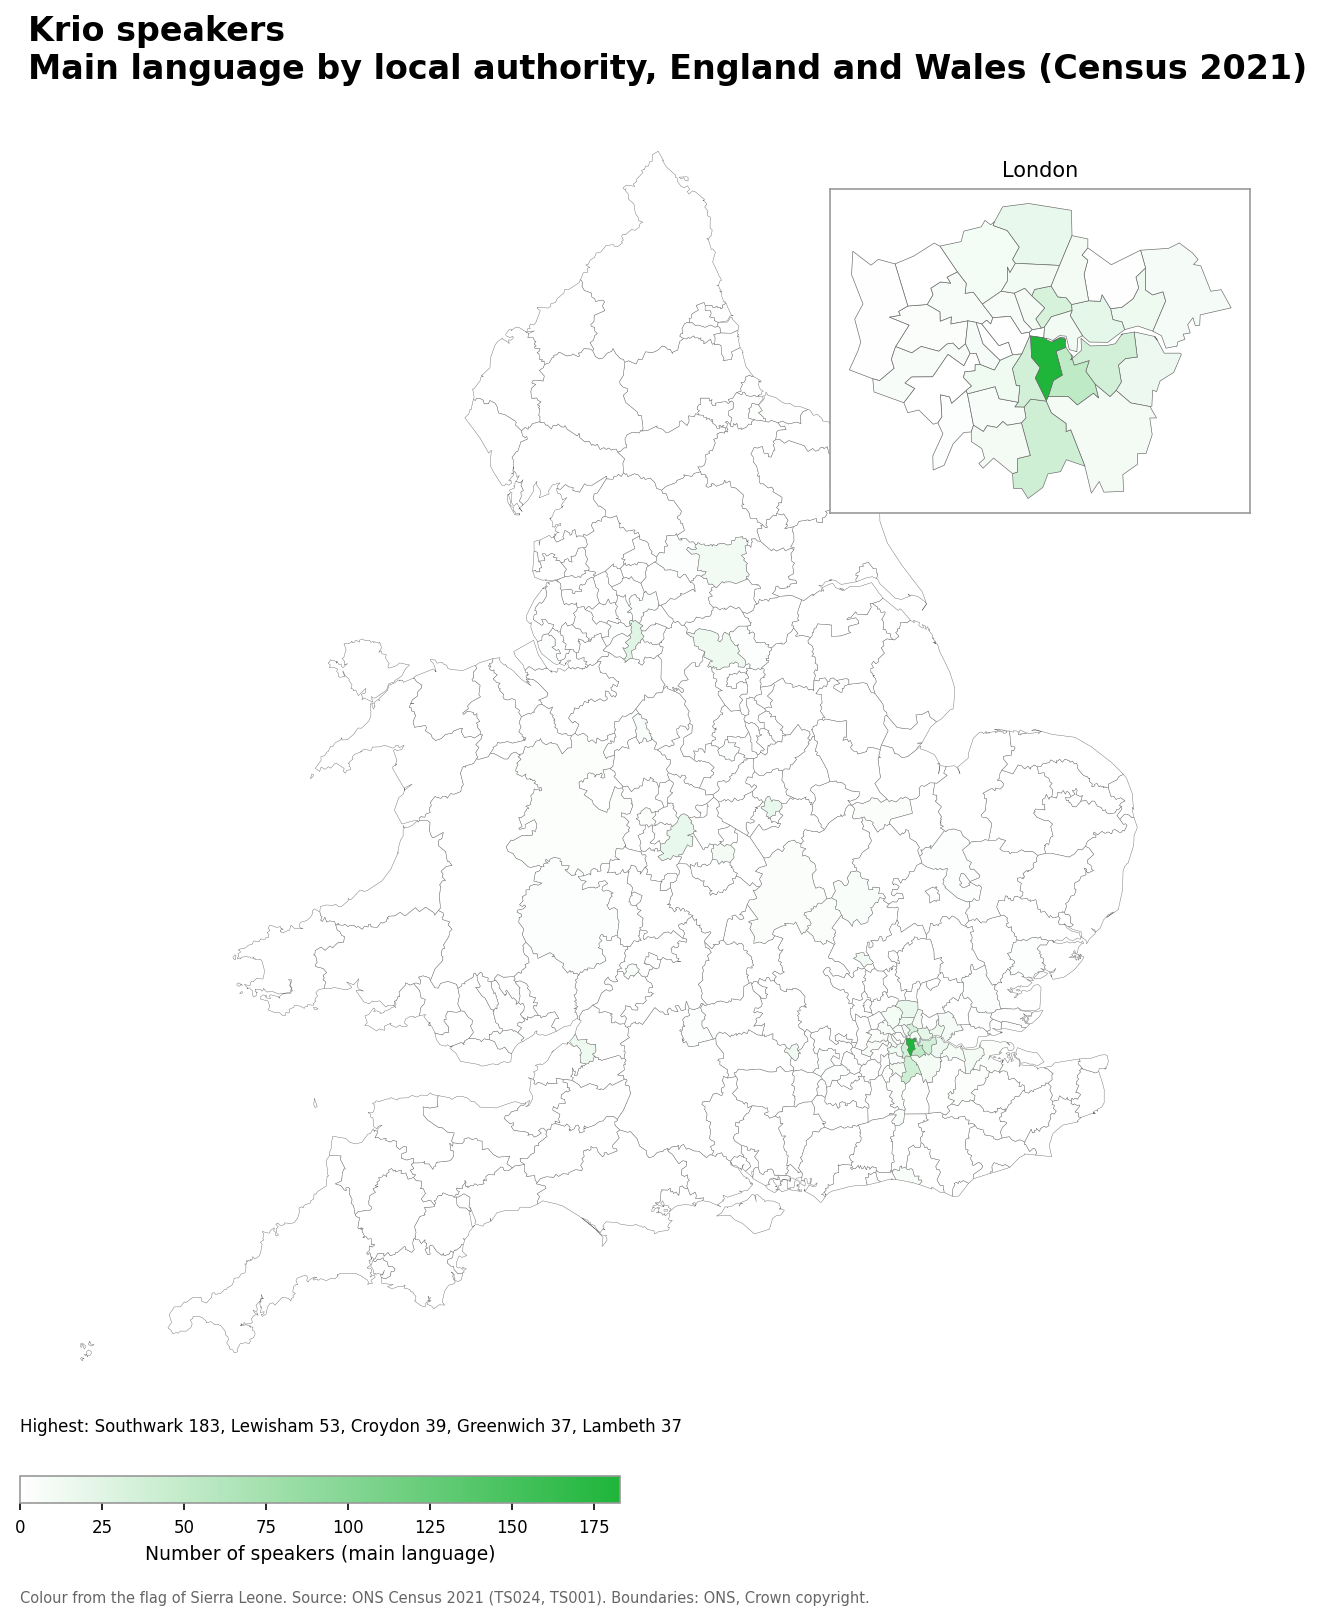
- Southwark: 183
- Lewisham: 53
- Croydon: 39
- Greenwich: 37
- Lambeth: 37
Krio speakers as a share of the population
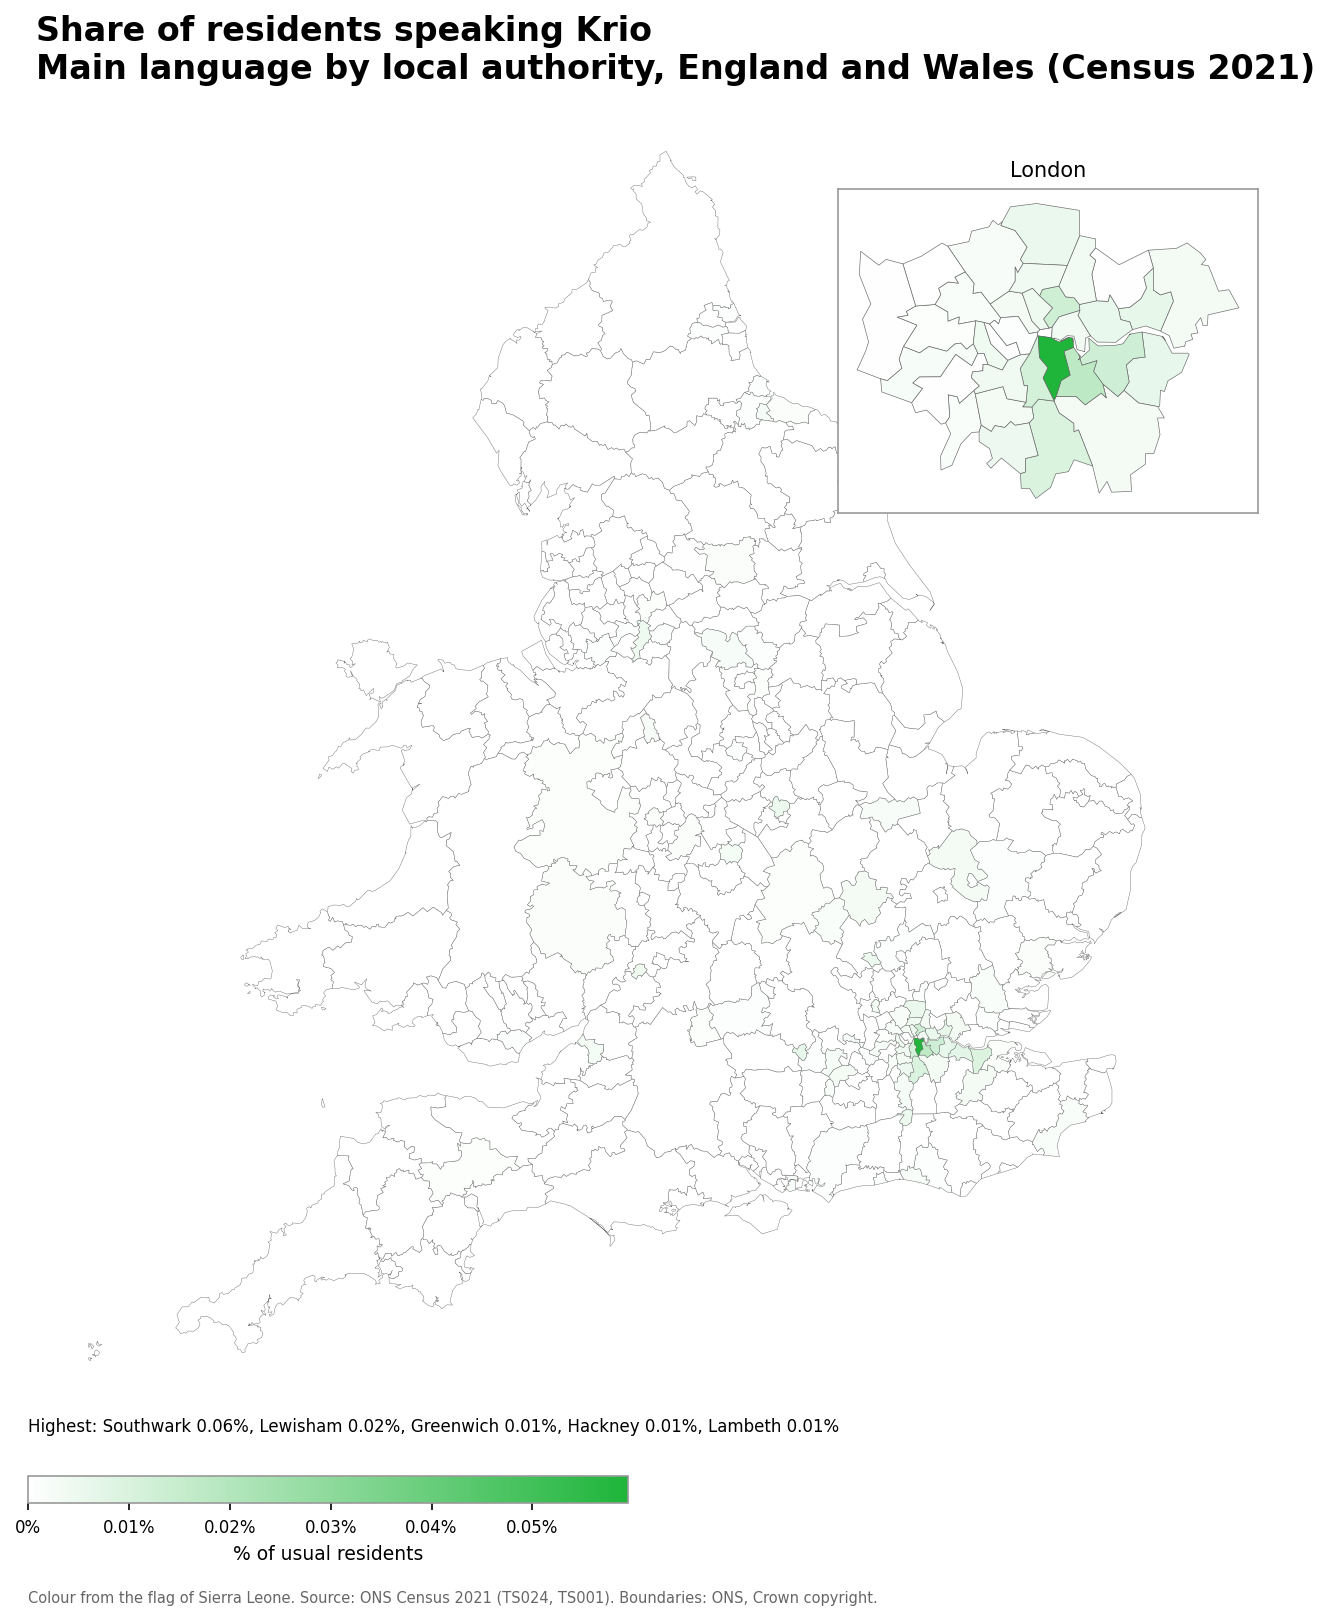
- Southwark: 0.06% (183 speakers)
- Lewisham: 0.02% (53 speakers)
- Greenwich: 0.01% (37 speakers)
- Hackney: 0.01% (33 speakers)
- Lambeth: 0.01% (37 speakers)
Number of Akan speakers
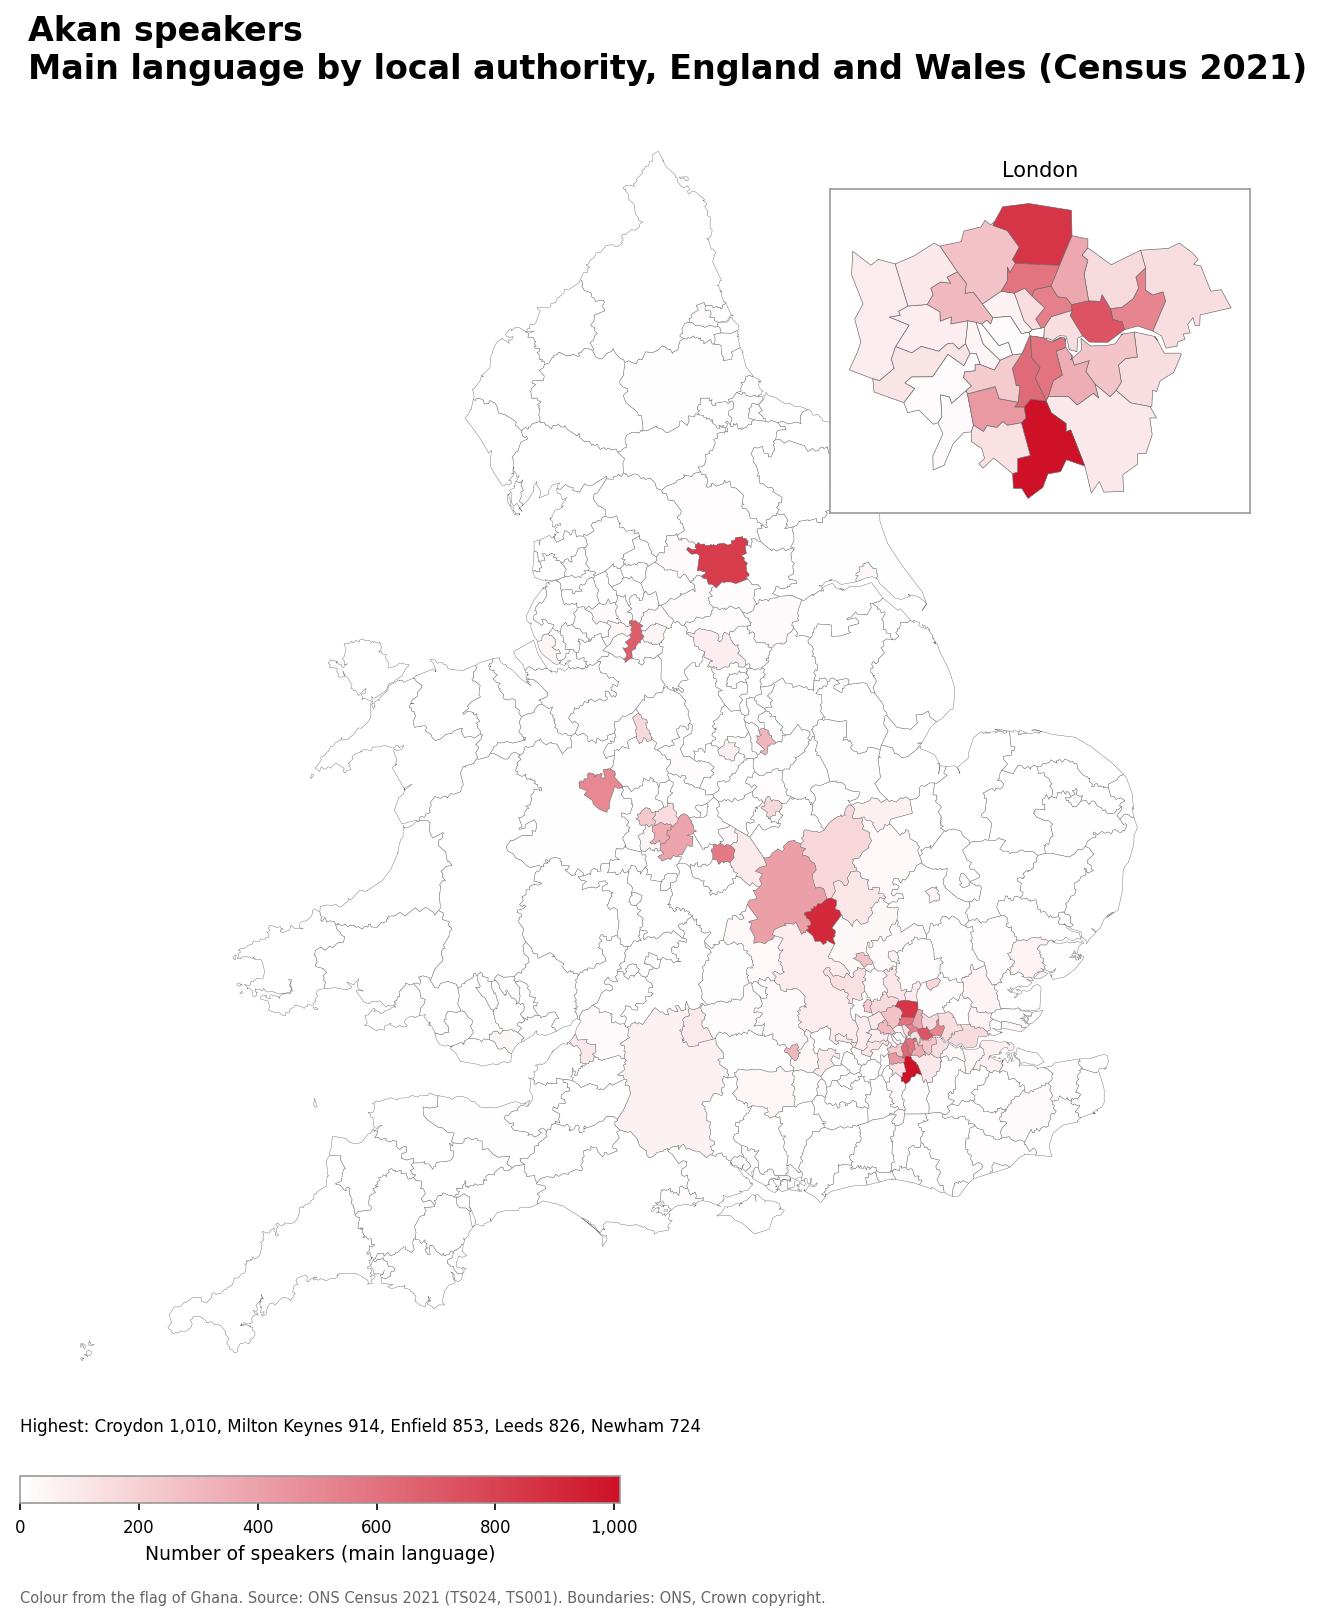
- Croydon: 1,010
- Milton Keynes: 914
- Enfield: 853
- Leeds: 826
- Newham: 724
Akan speakers as a share of the population
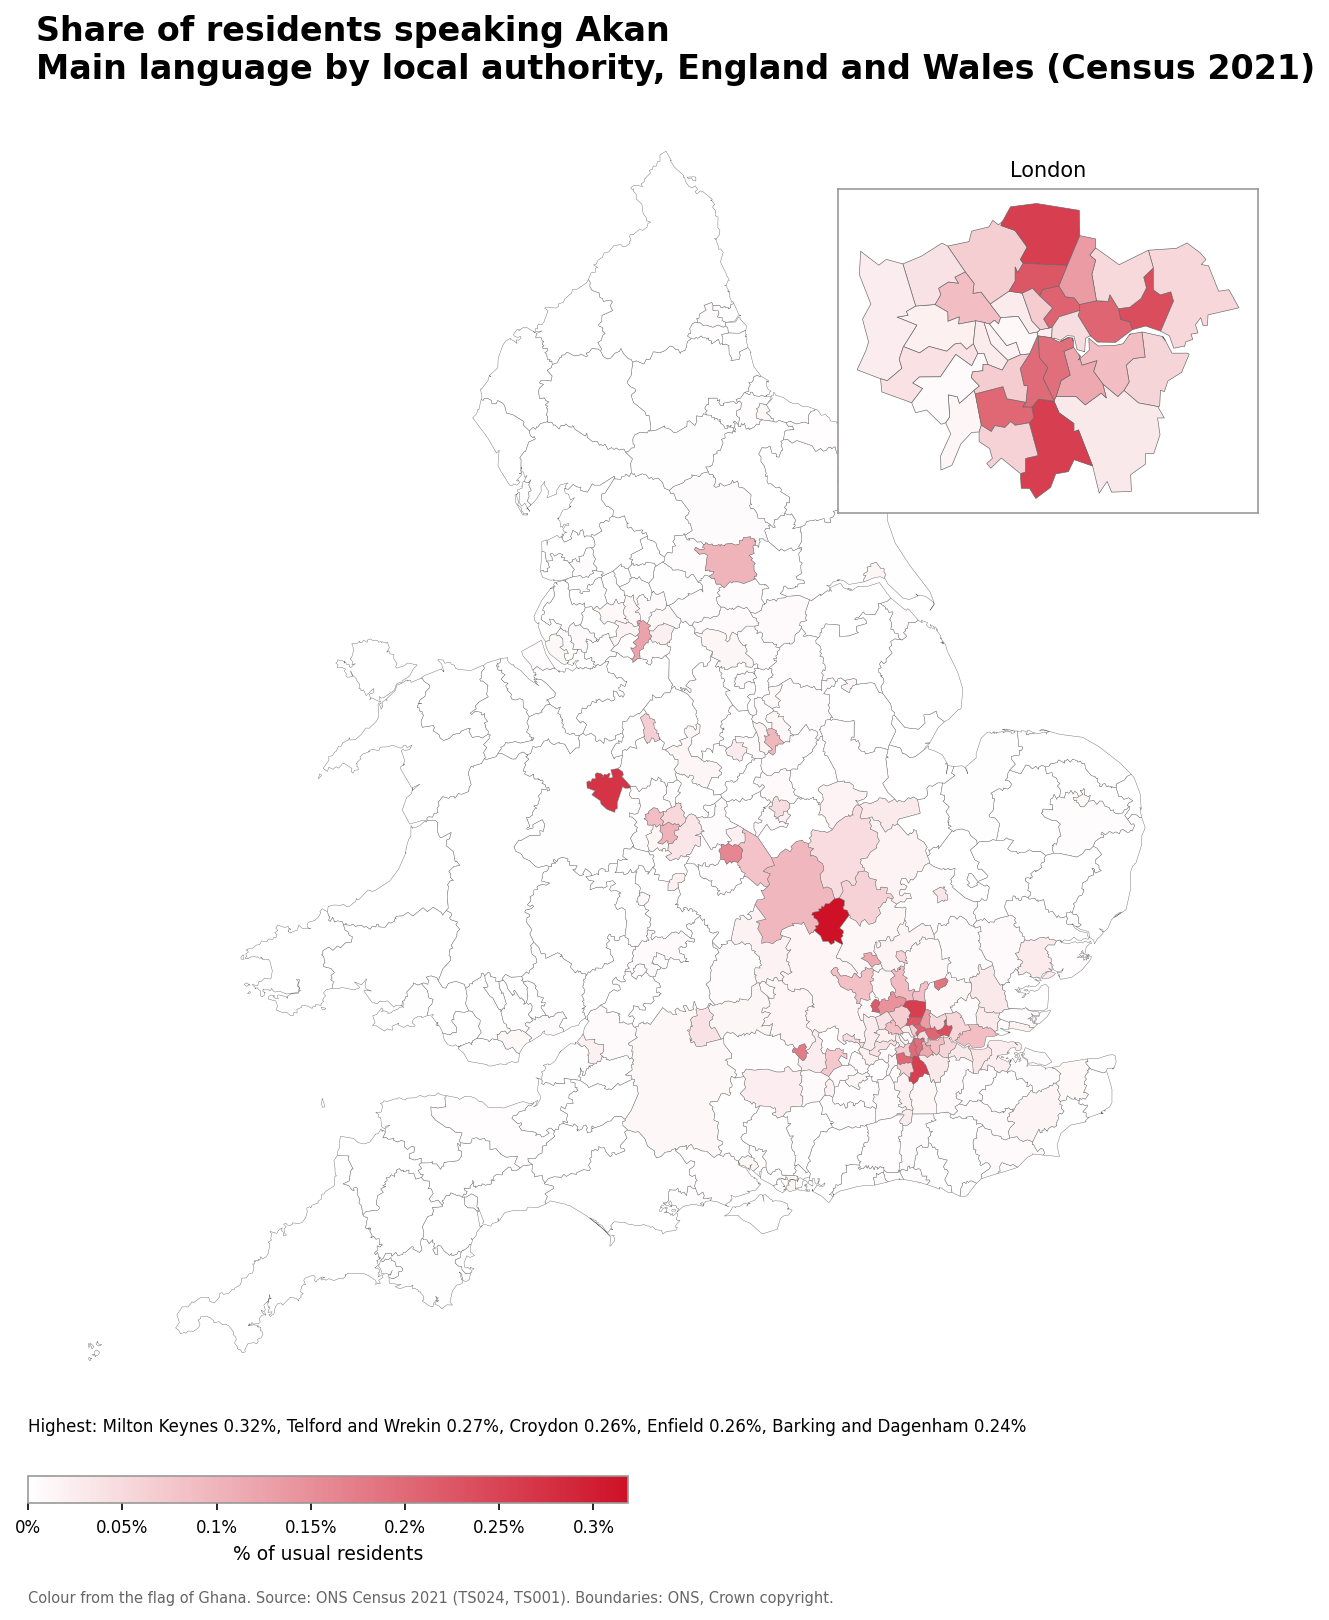
- Milton Keynes: 0.32% (914 speakers)
- Telford and Wrekin: 0.27% (503 speakers)
- Croydon: 0.26% (1,010 speakers)
- Enfield: 0.26% (853 speakers)
- Barking and Dagenham: 0.24% (522 speakers)
Number of Yoruba speakers
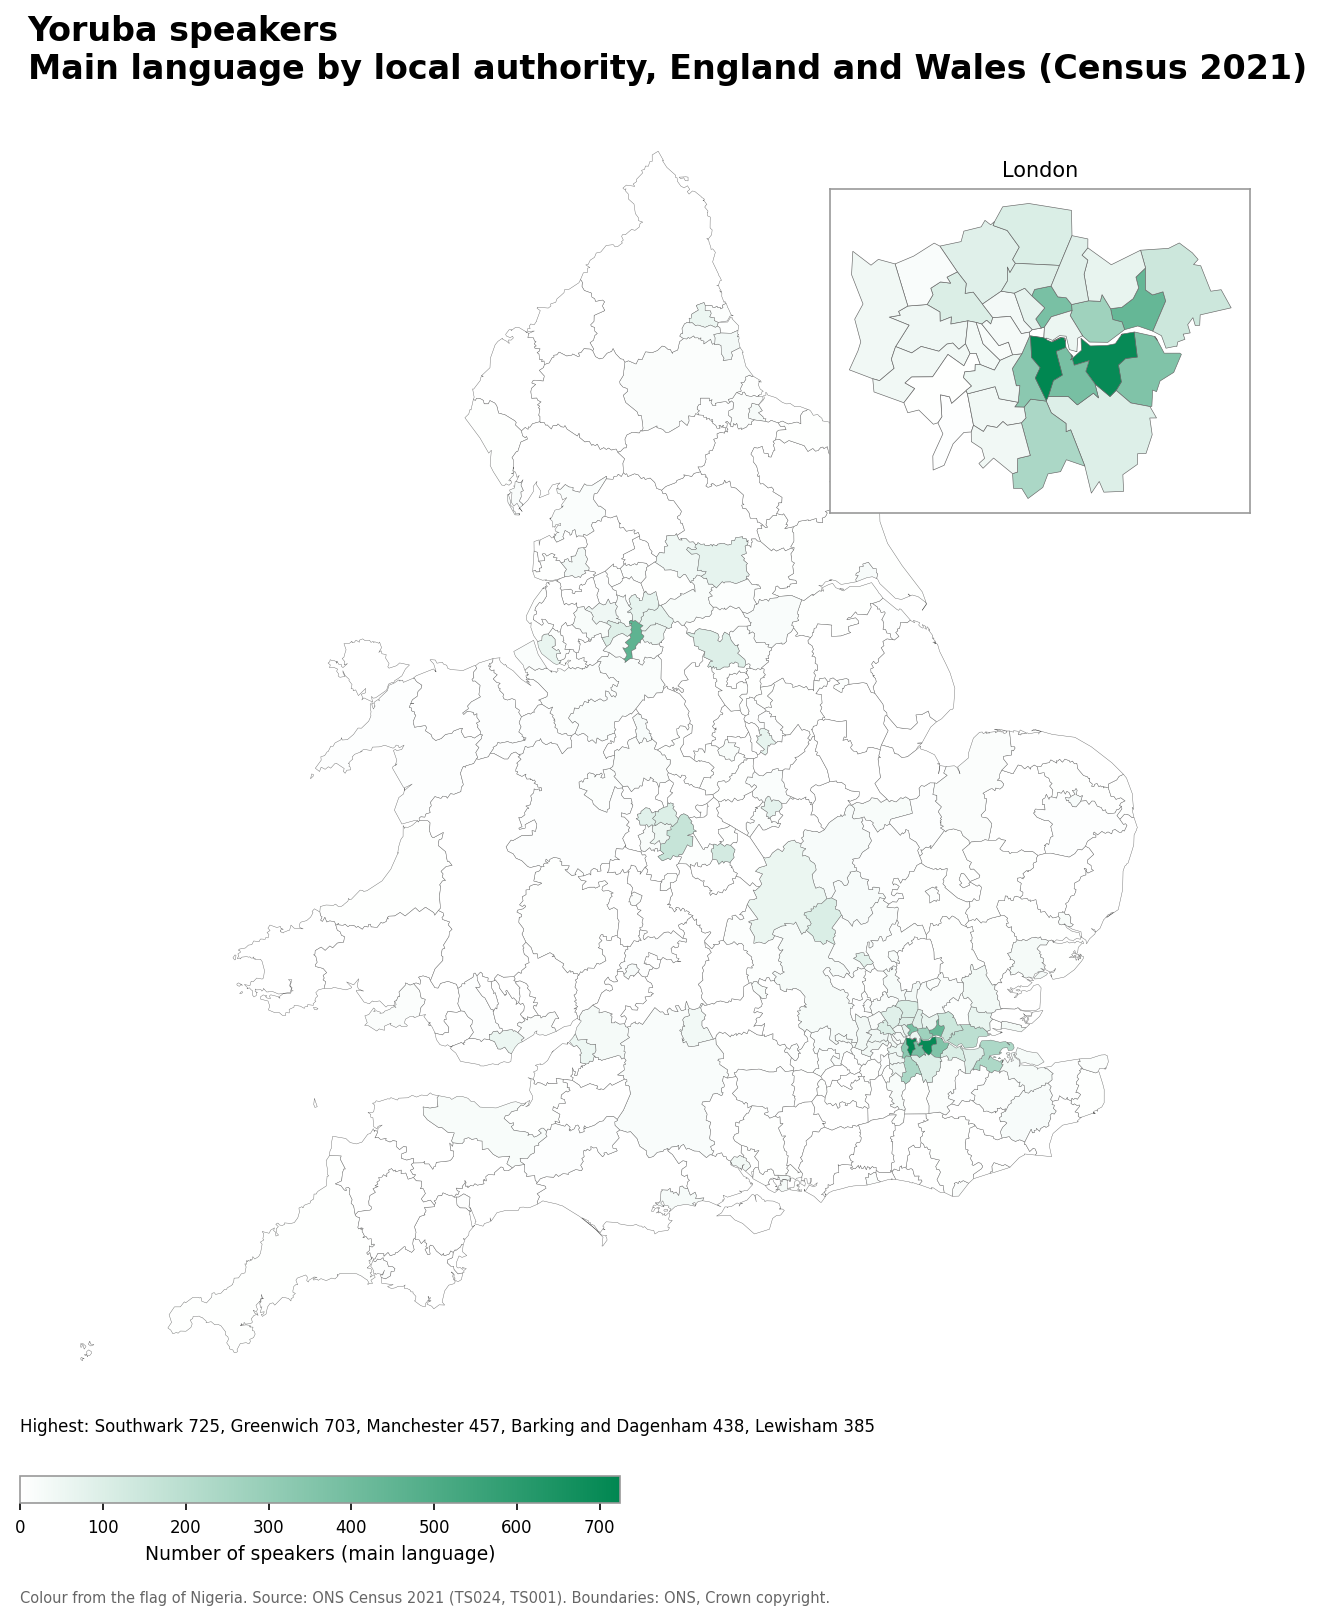
- Southwark: 725
- Greenwich: 703
- Manchester: 457
- Barking and Dagenham: 438
- Lewisham: 385
Yoruba speakers as a share of the population
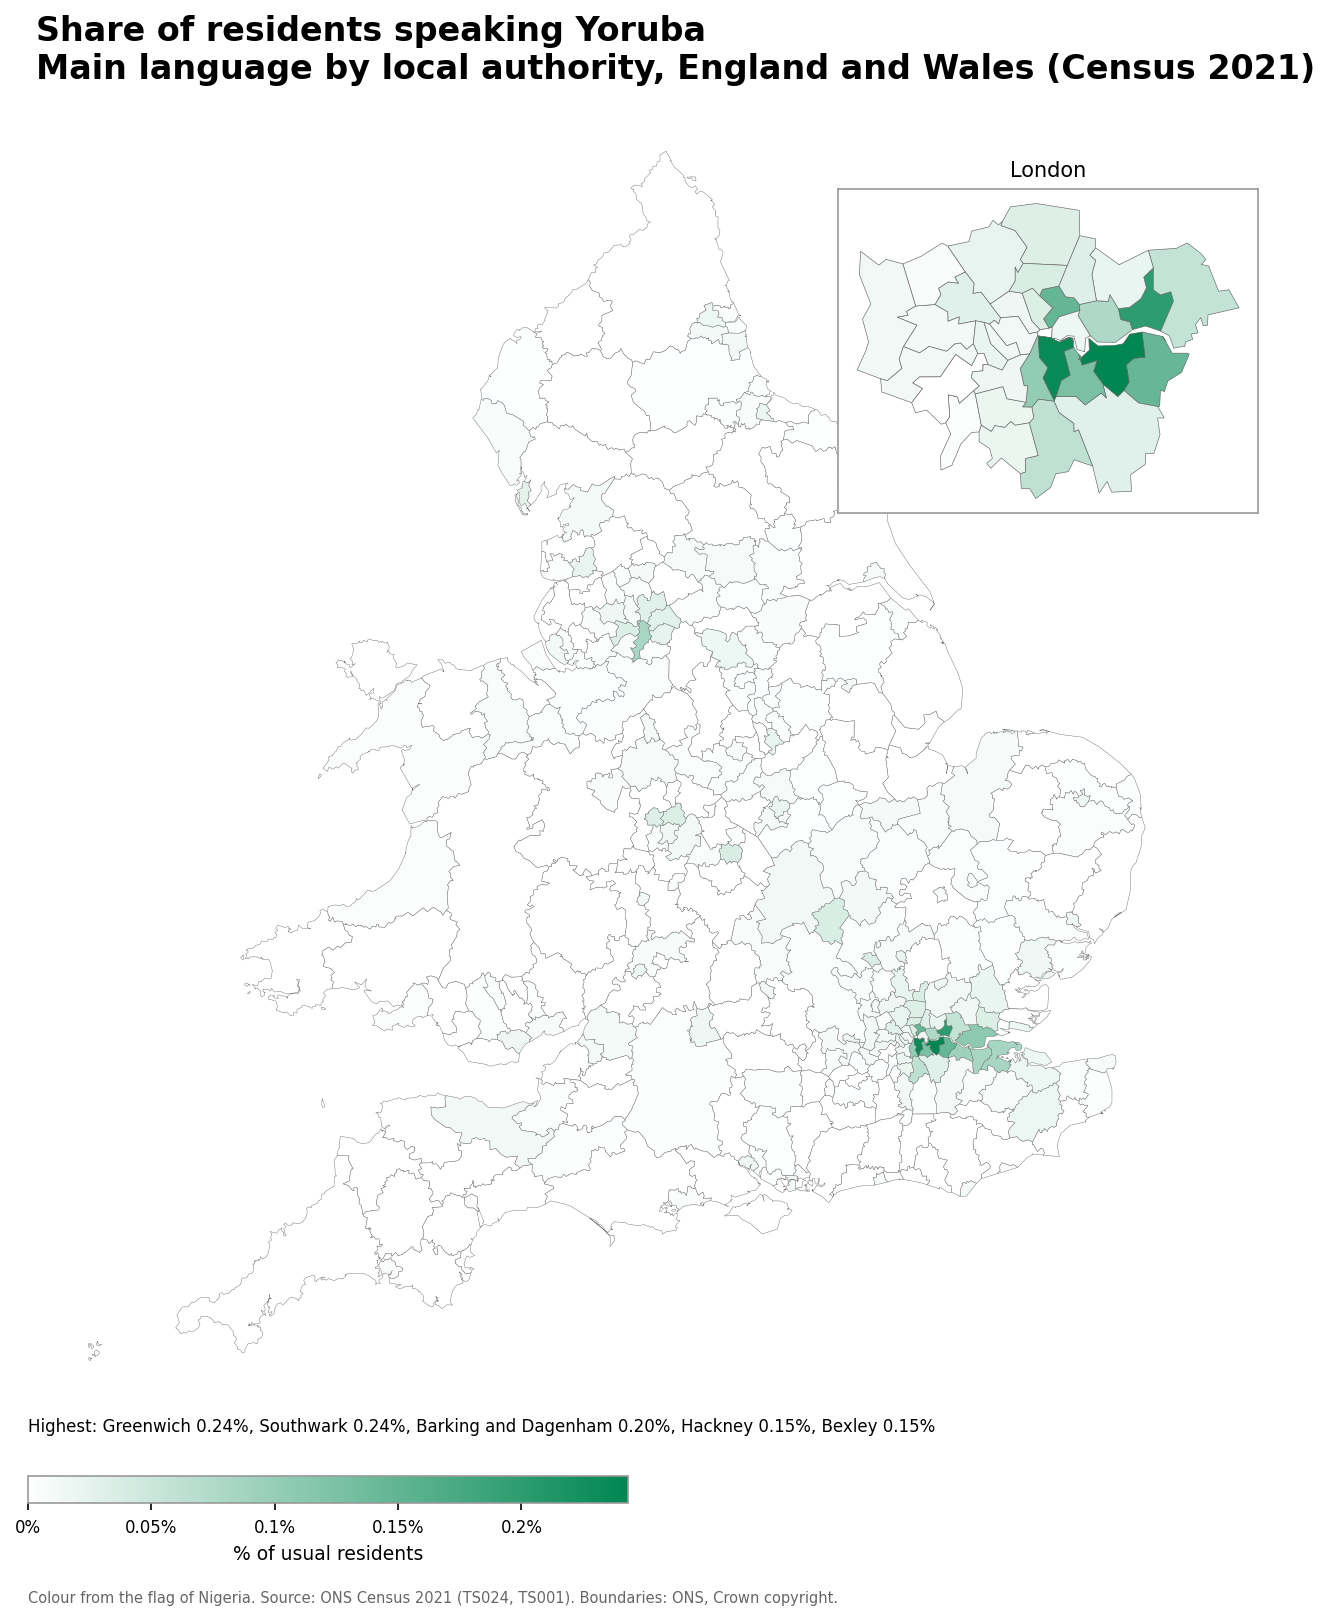
- Greenwich: 0.24% (703 speakers)
- Southwark: 0.24% (725 speakers)
- Barking and Dagenham: 0.20% (438 speakers)
- Hackney: 0.15% (382 speakers)
- Bexley: 0.15% (360 speakers)
Number of Igbo speakers
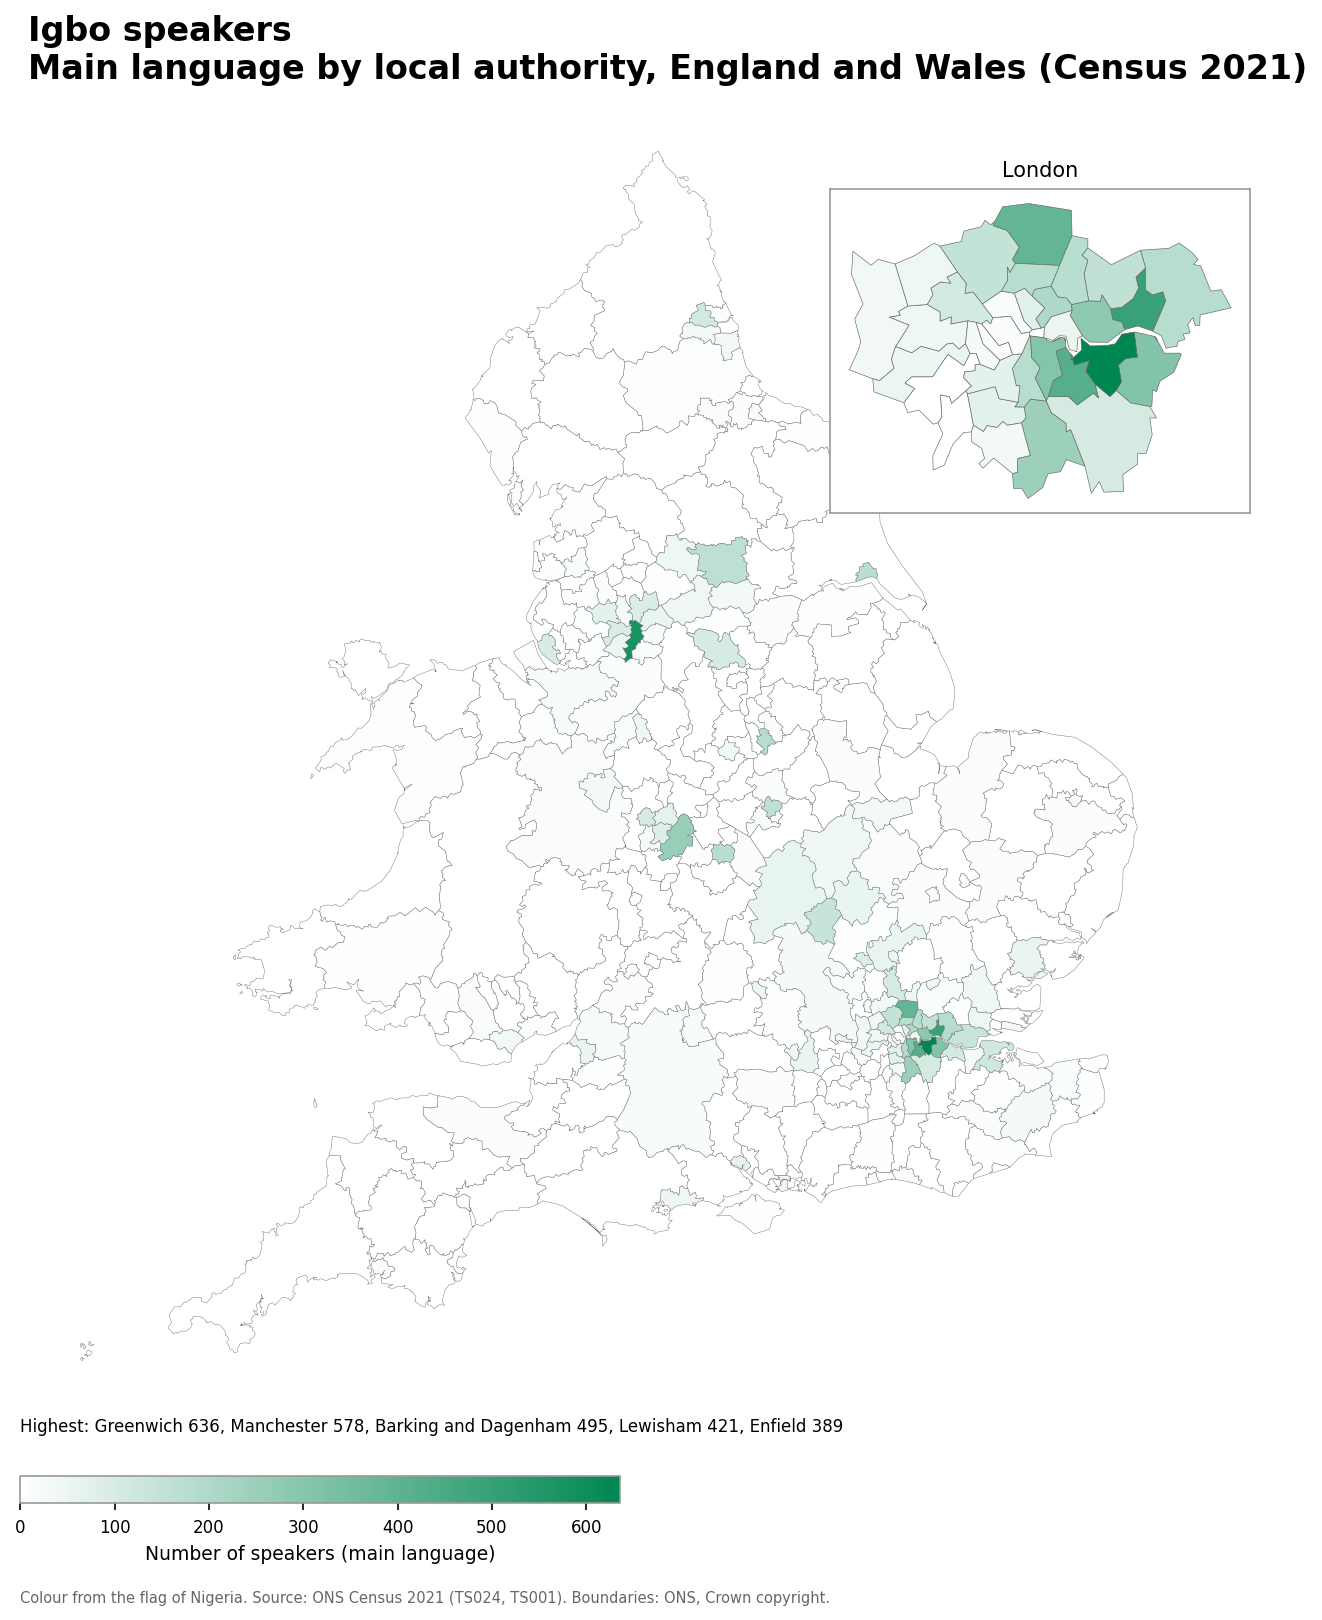
- Greenwich: 636
- Manchester: 578
- Barking and Dagenham: 495
- Lewisham: 421
- Enfield: 389
Igbo speakers as a share of the population
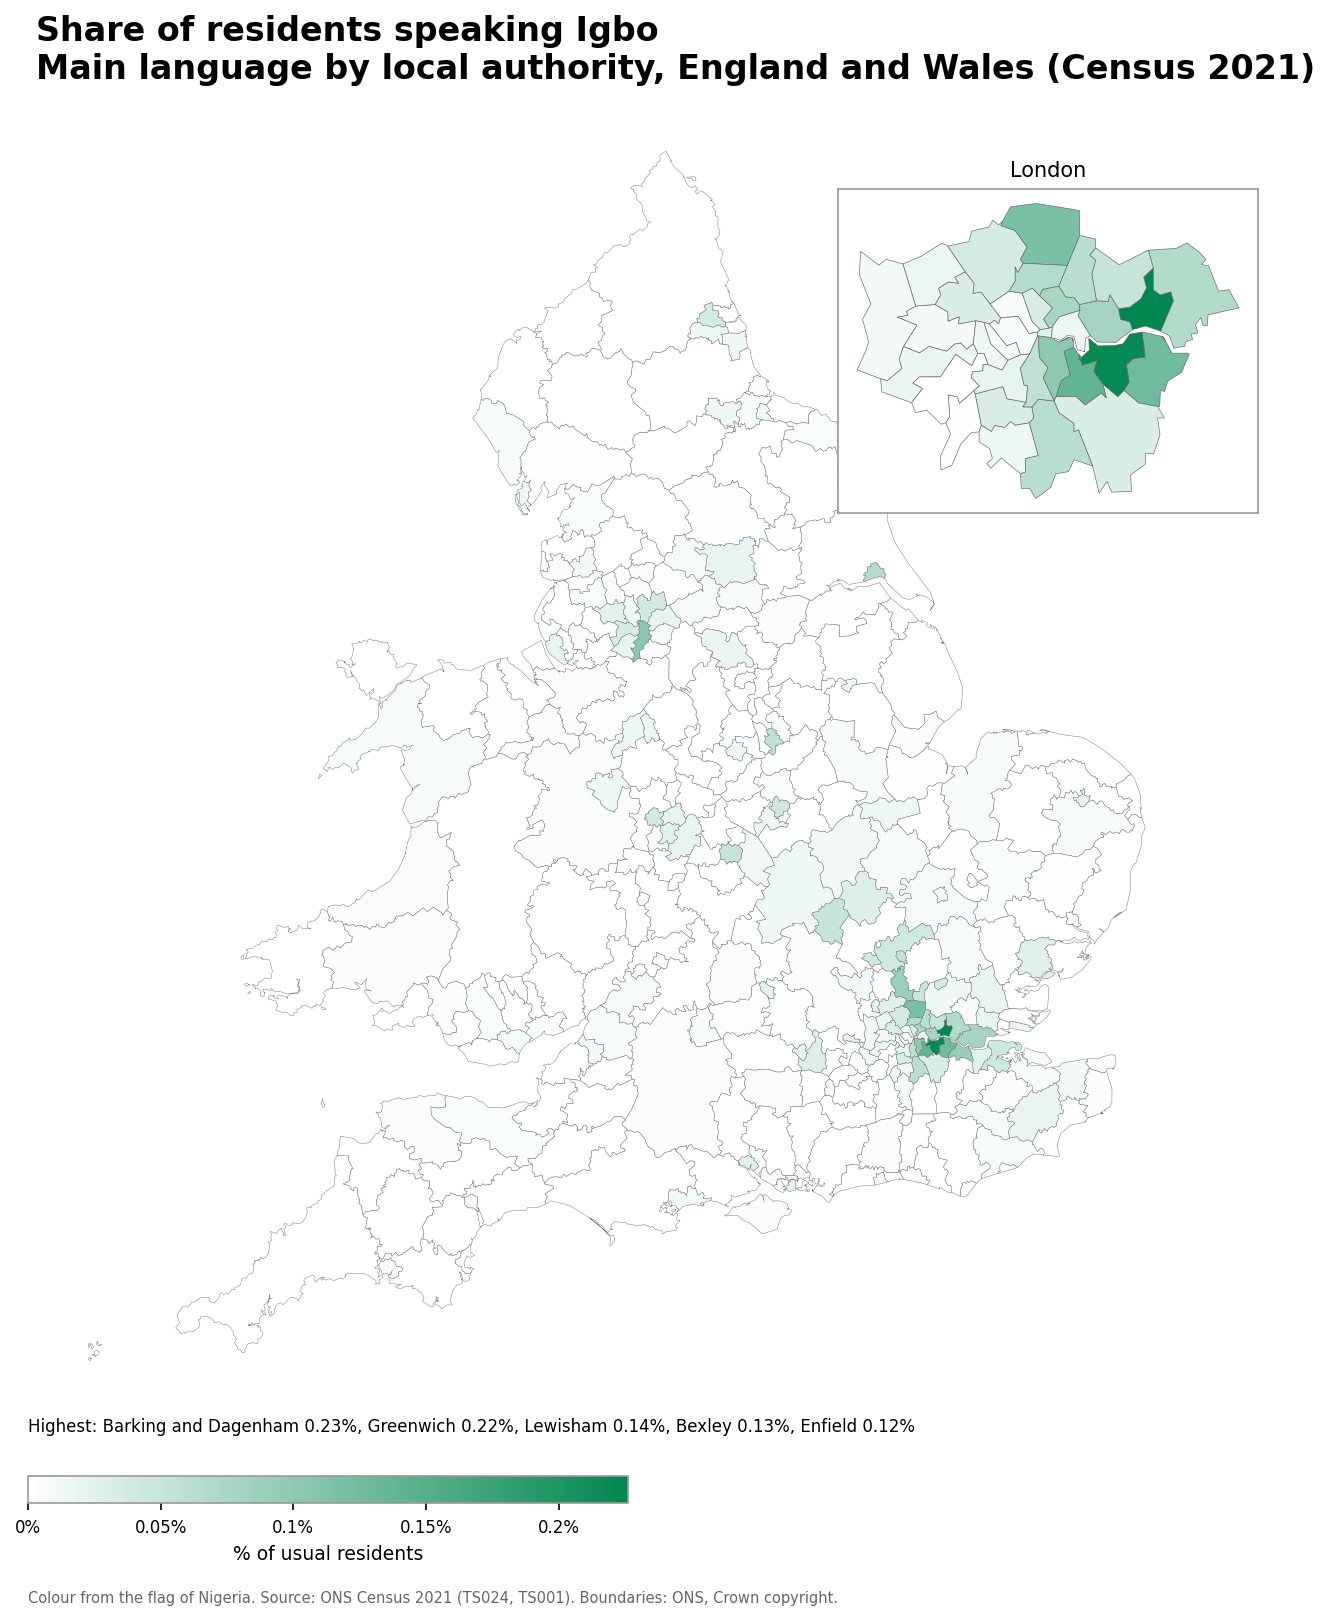
- Barking and Dagenham: 0.23% (495 speakers)
- Greenwich: 0.22% (636 speakers)
- Lewisham: 0.14% (421 speakers)
- Bexley: 0.13% (315 speakers)
- Enfield: 0.12% (389 speakers)
Number of Swahili speakers
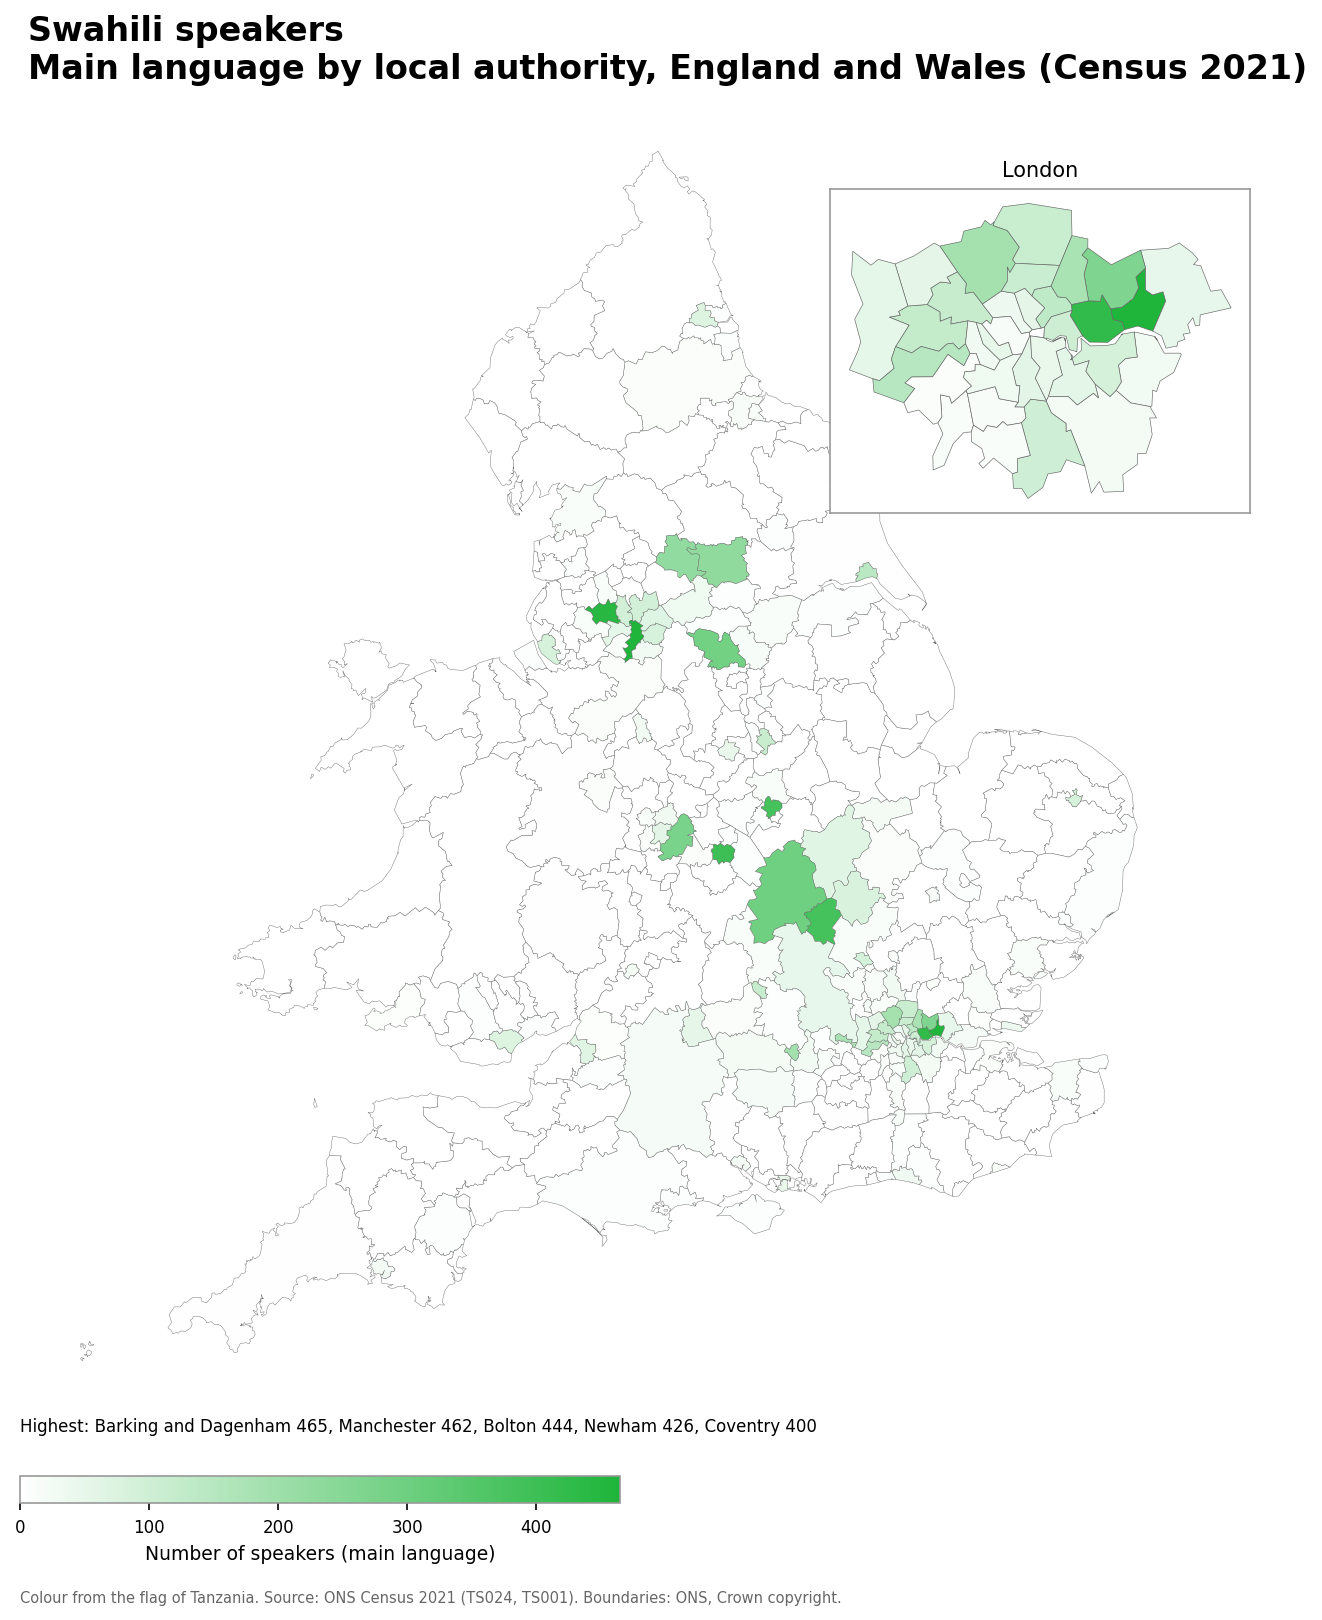
- Barking and Dagenham: 465
- Manchester: 462
- Bolton: 444
- Newham: 426
- Coventry: 400
Swahili speakers as a share of the population
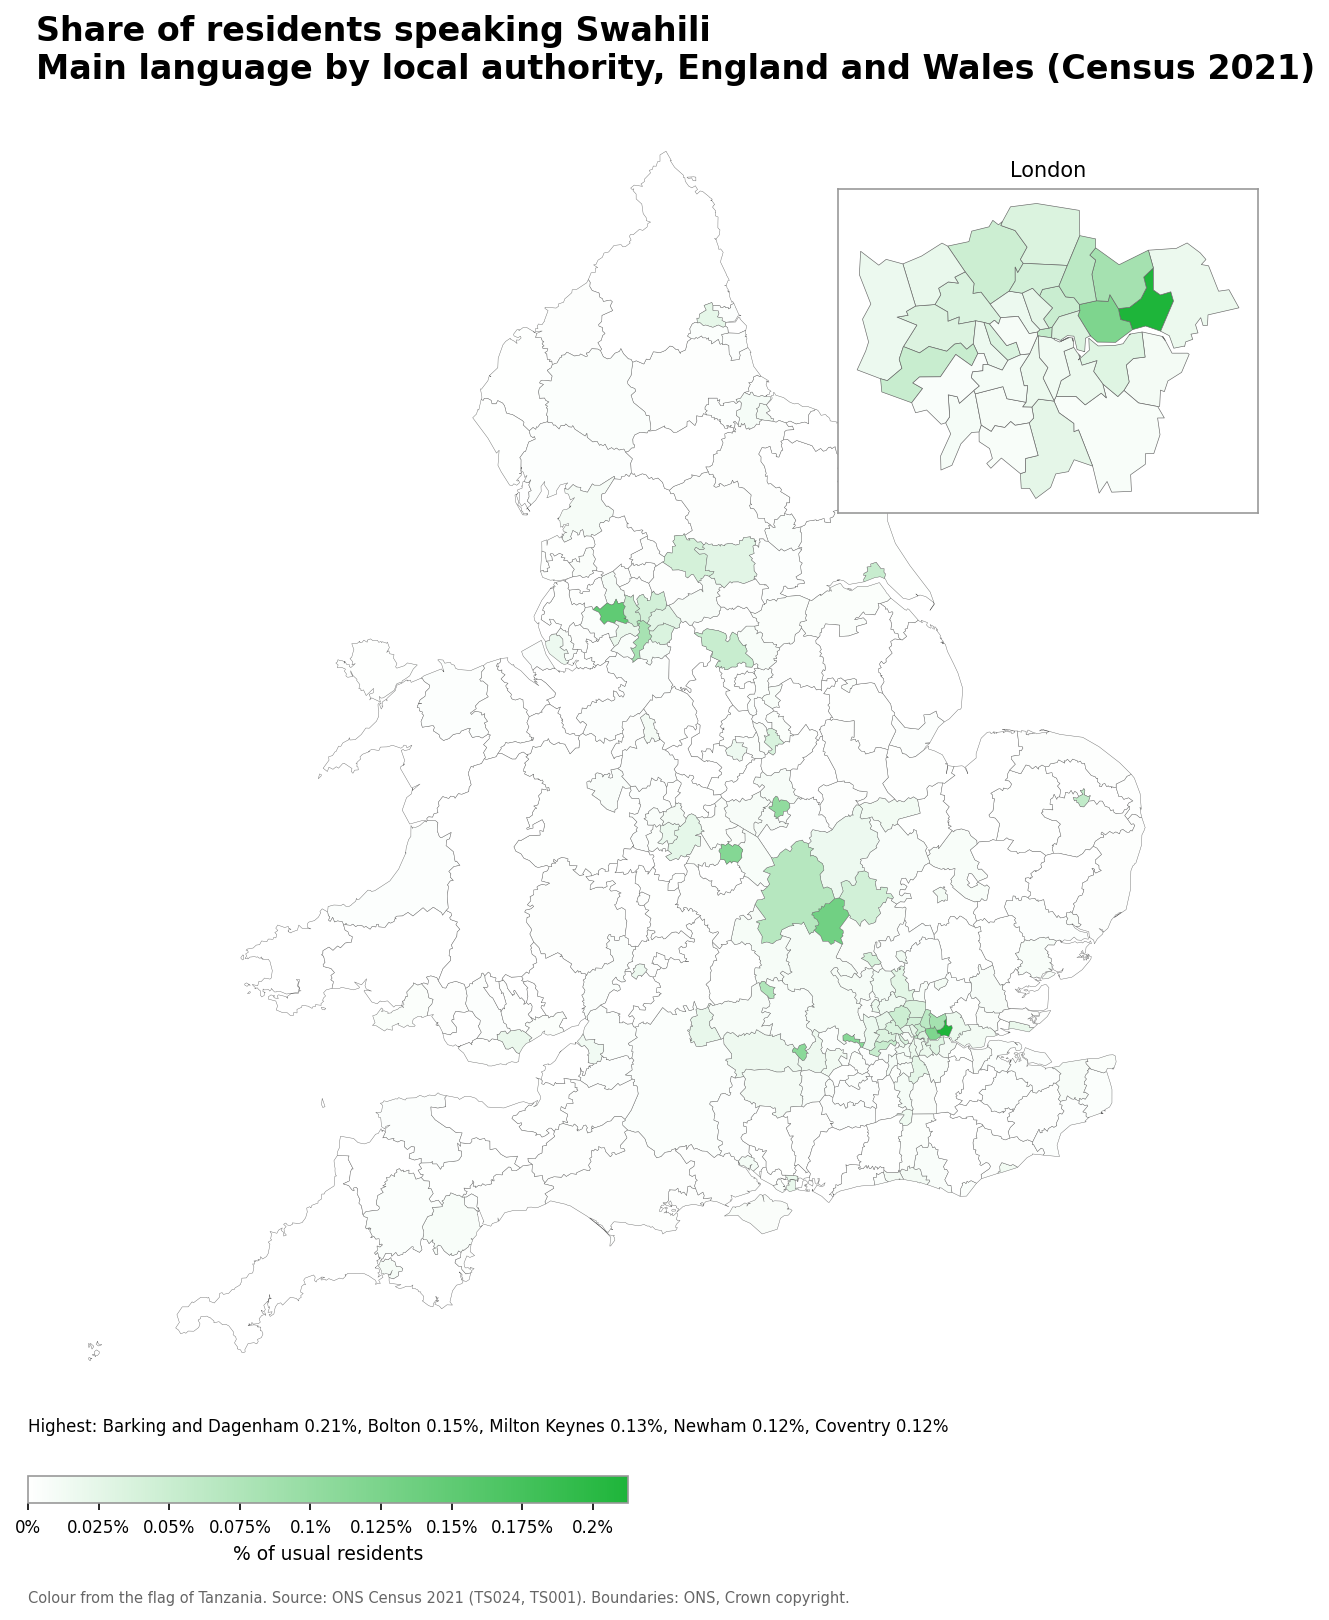
- Barking and Dagenham: 0.21% (465 speakers)
- Bolton: 0.15% (444 speakers)
- Milton Keynes: 0.13% (385 speakers)
- Newham: 0.12% (426 speakers)
- Coventry: 0.12% (400 speakers)
Number of Luganda speakers
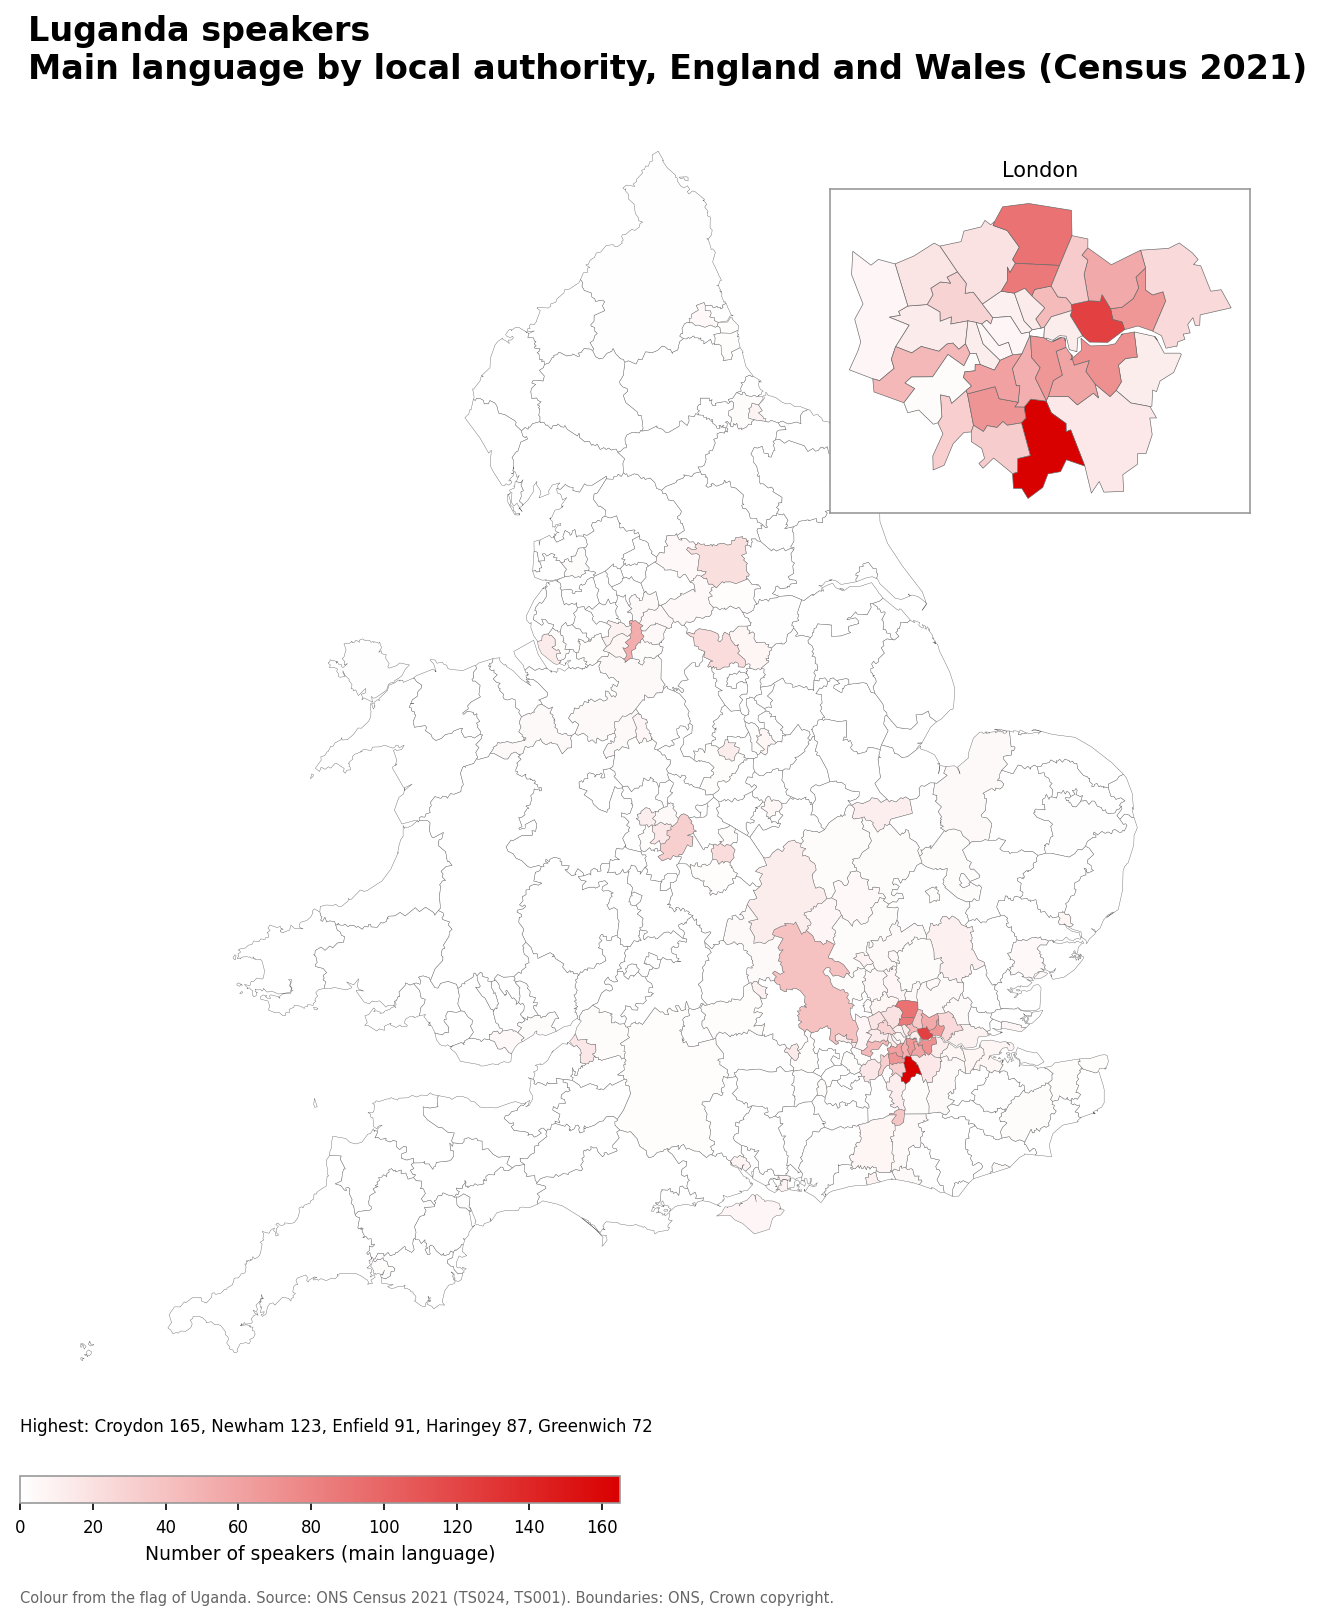
- Croydon: 165
- Newham: 123
- Enfield: 91
- Haringey: 87
- Greenwich: 72
Luganda speakers as a share of the population
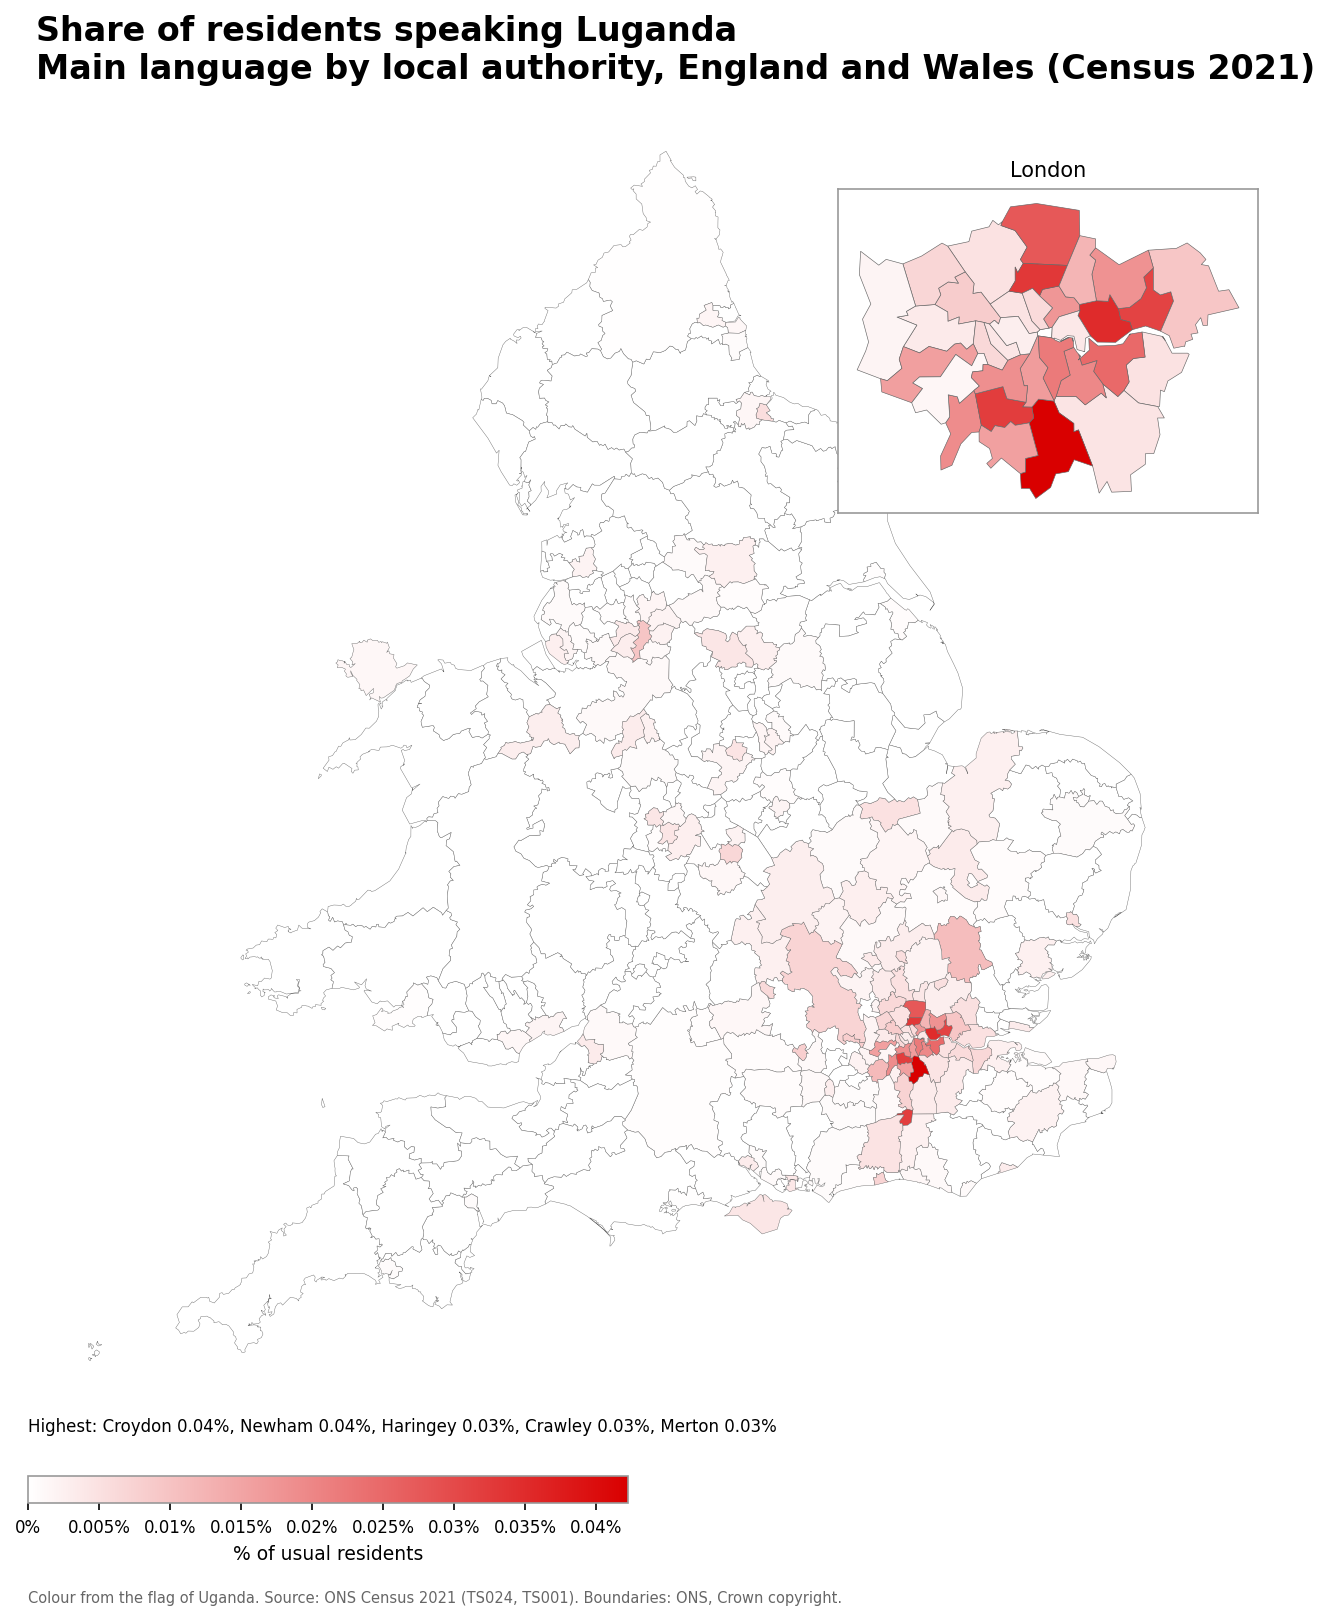
- Croydon: 0.04% (165 speakers)
- Newham: 0.04% (123 speakers)
- Haringey: 0.03% (87 speakers)
- Crawley: 0.03% (38 speakers)
- Merton: 0.03% (69 speakers)
Number of Lingala speakers
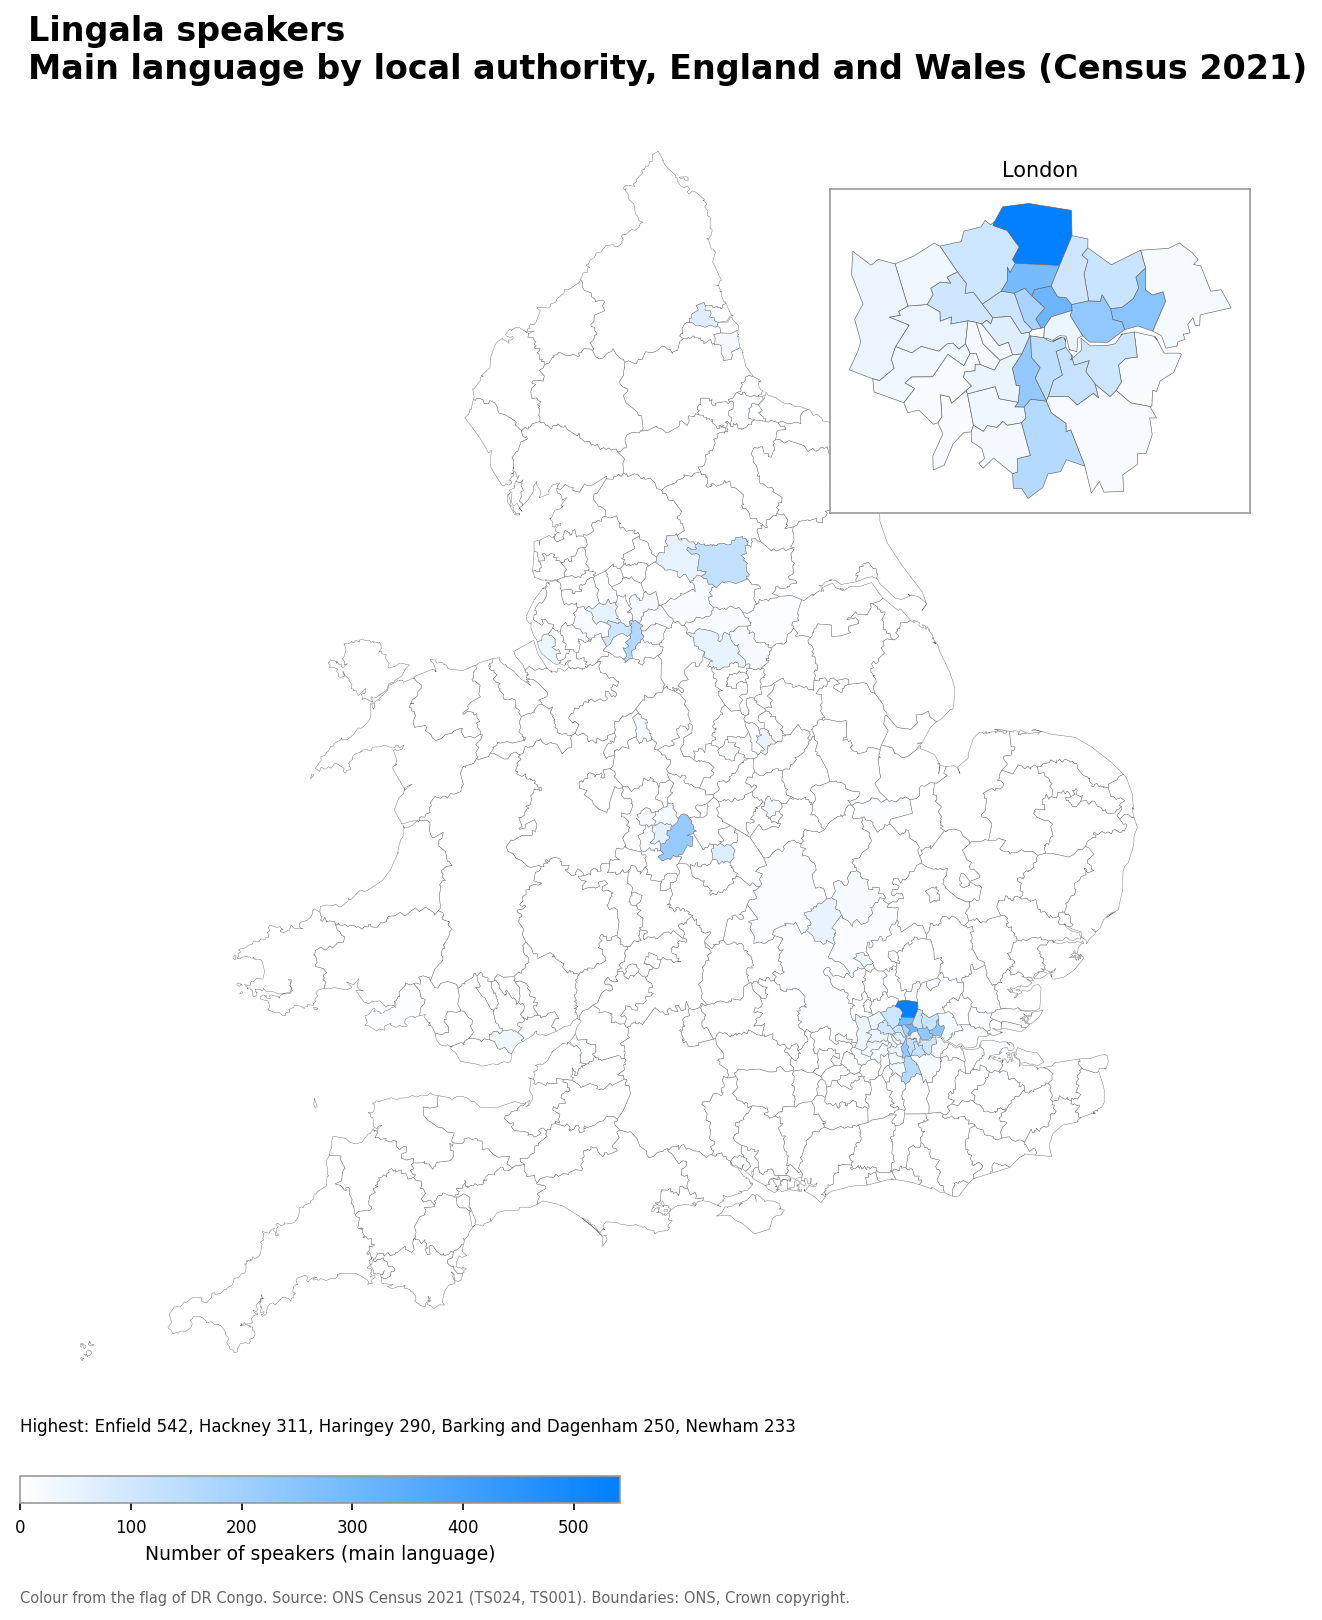
- Enfield: 542
- Hackney: 311
- Haringey: 290
- Barking and Dagenham: 250
- Newham: 233
Lingala speakers as a share of the population
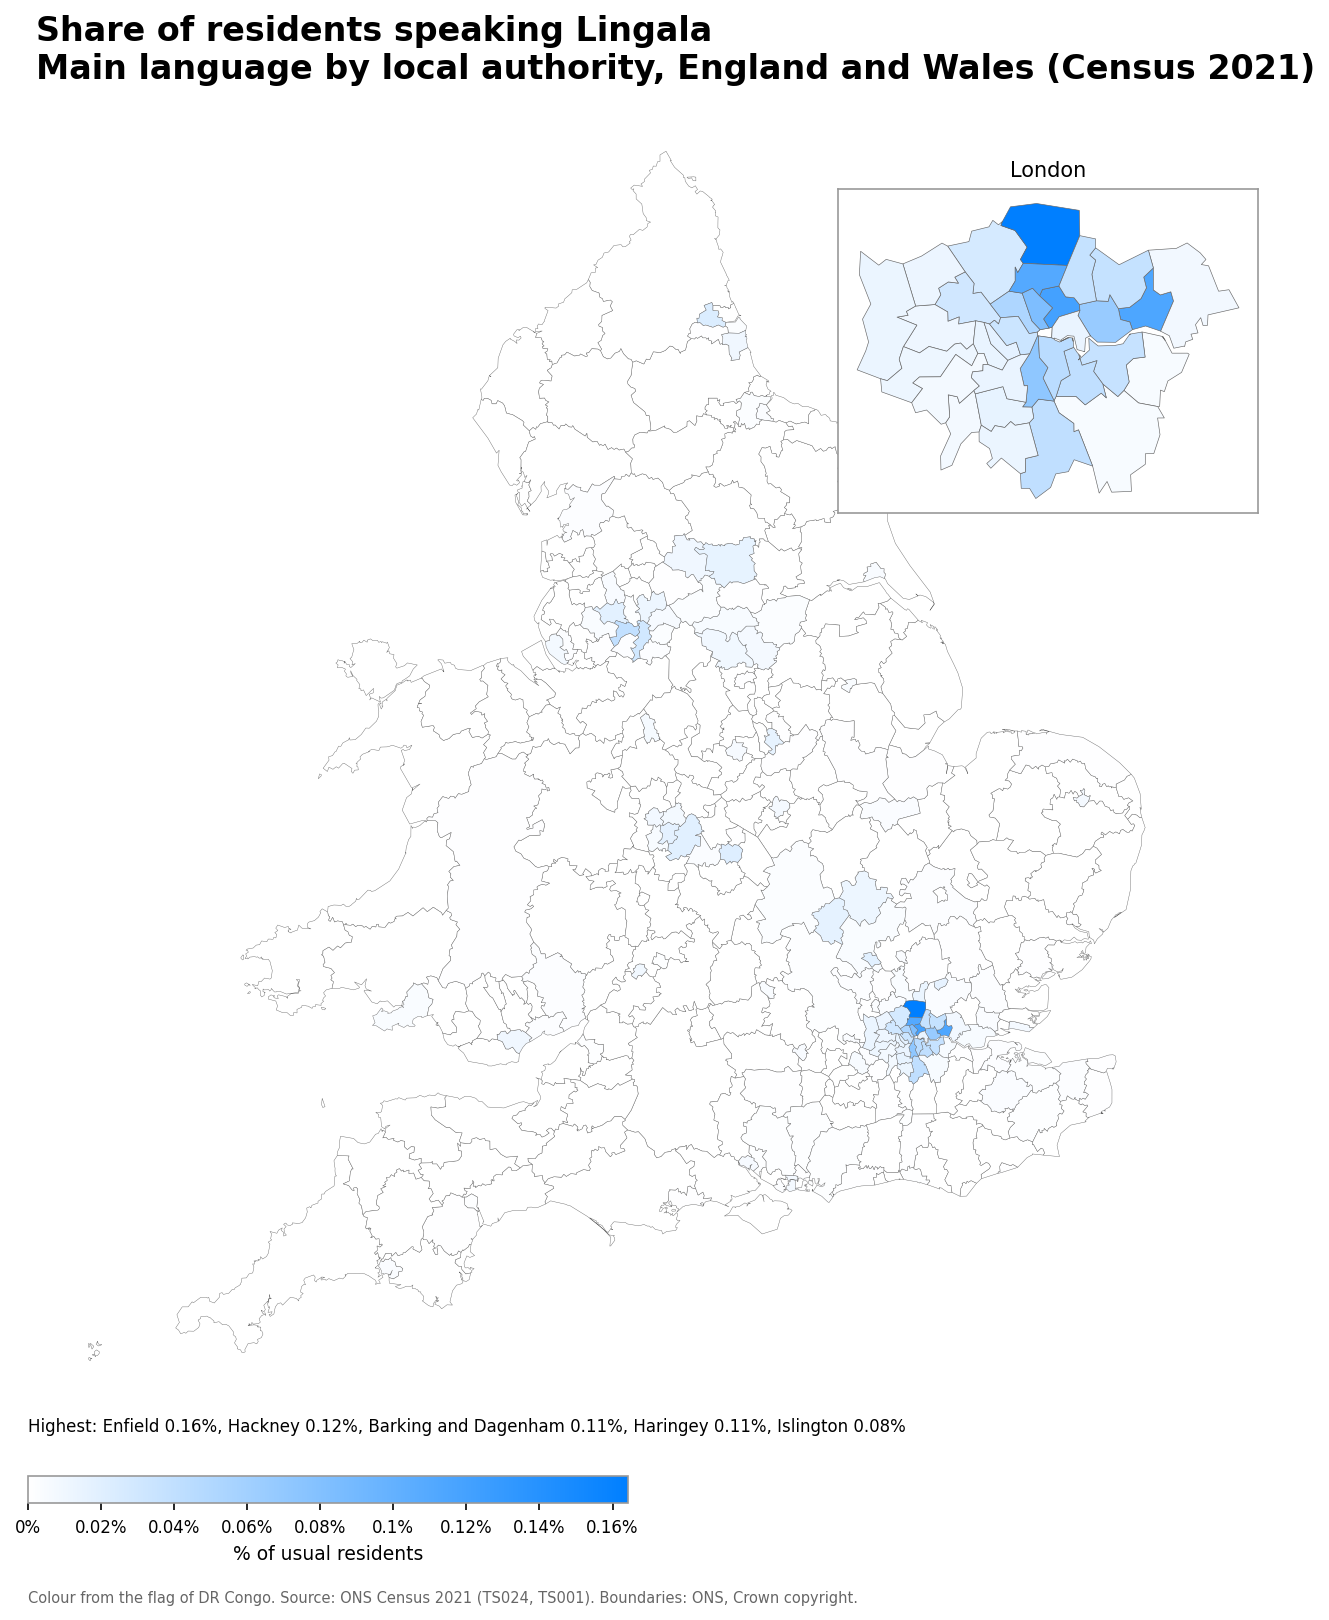
- Enfield: 0.16% (542 speakers)
- Hackney: 0.12% (311 speakers)
- Barking and Dagenham: 0.11% (250 speakers)
- Haringey: 0.11% (290 speakers)
- Islington: 0.08% (180 speakers)
Number of Shona speakers
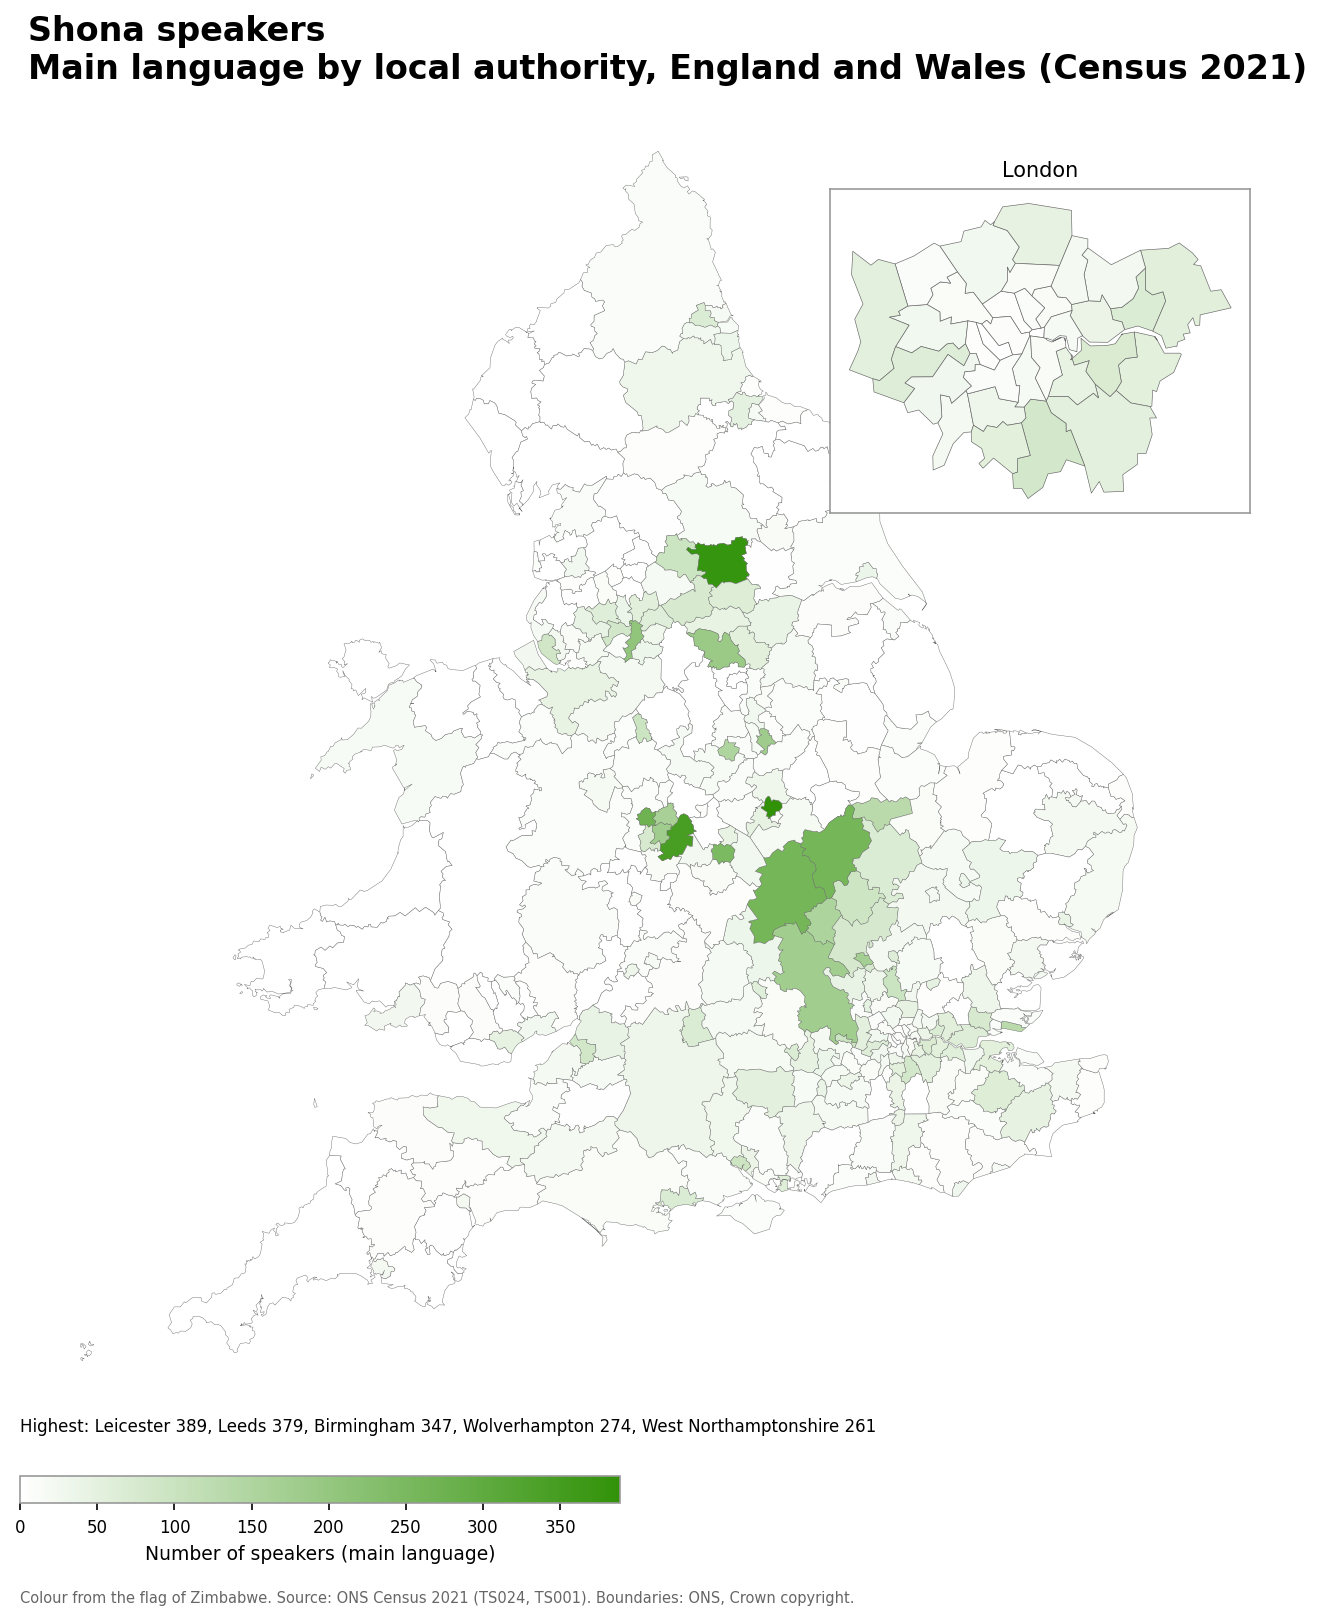
- Leicester: 389
- Leeds: 379
- Birmingham: 347
- Wolverhampton: 274
- West Northamptonshire: 261
Shona speakers as a share of the population
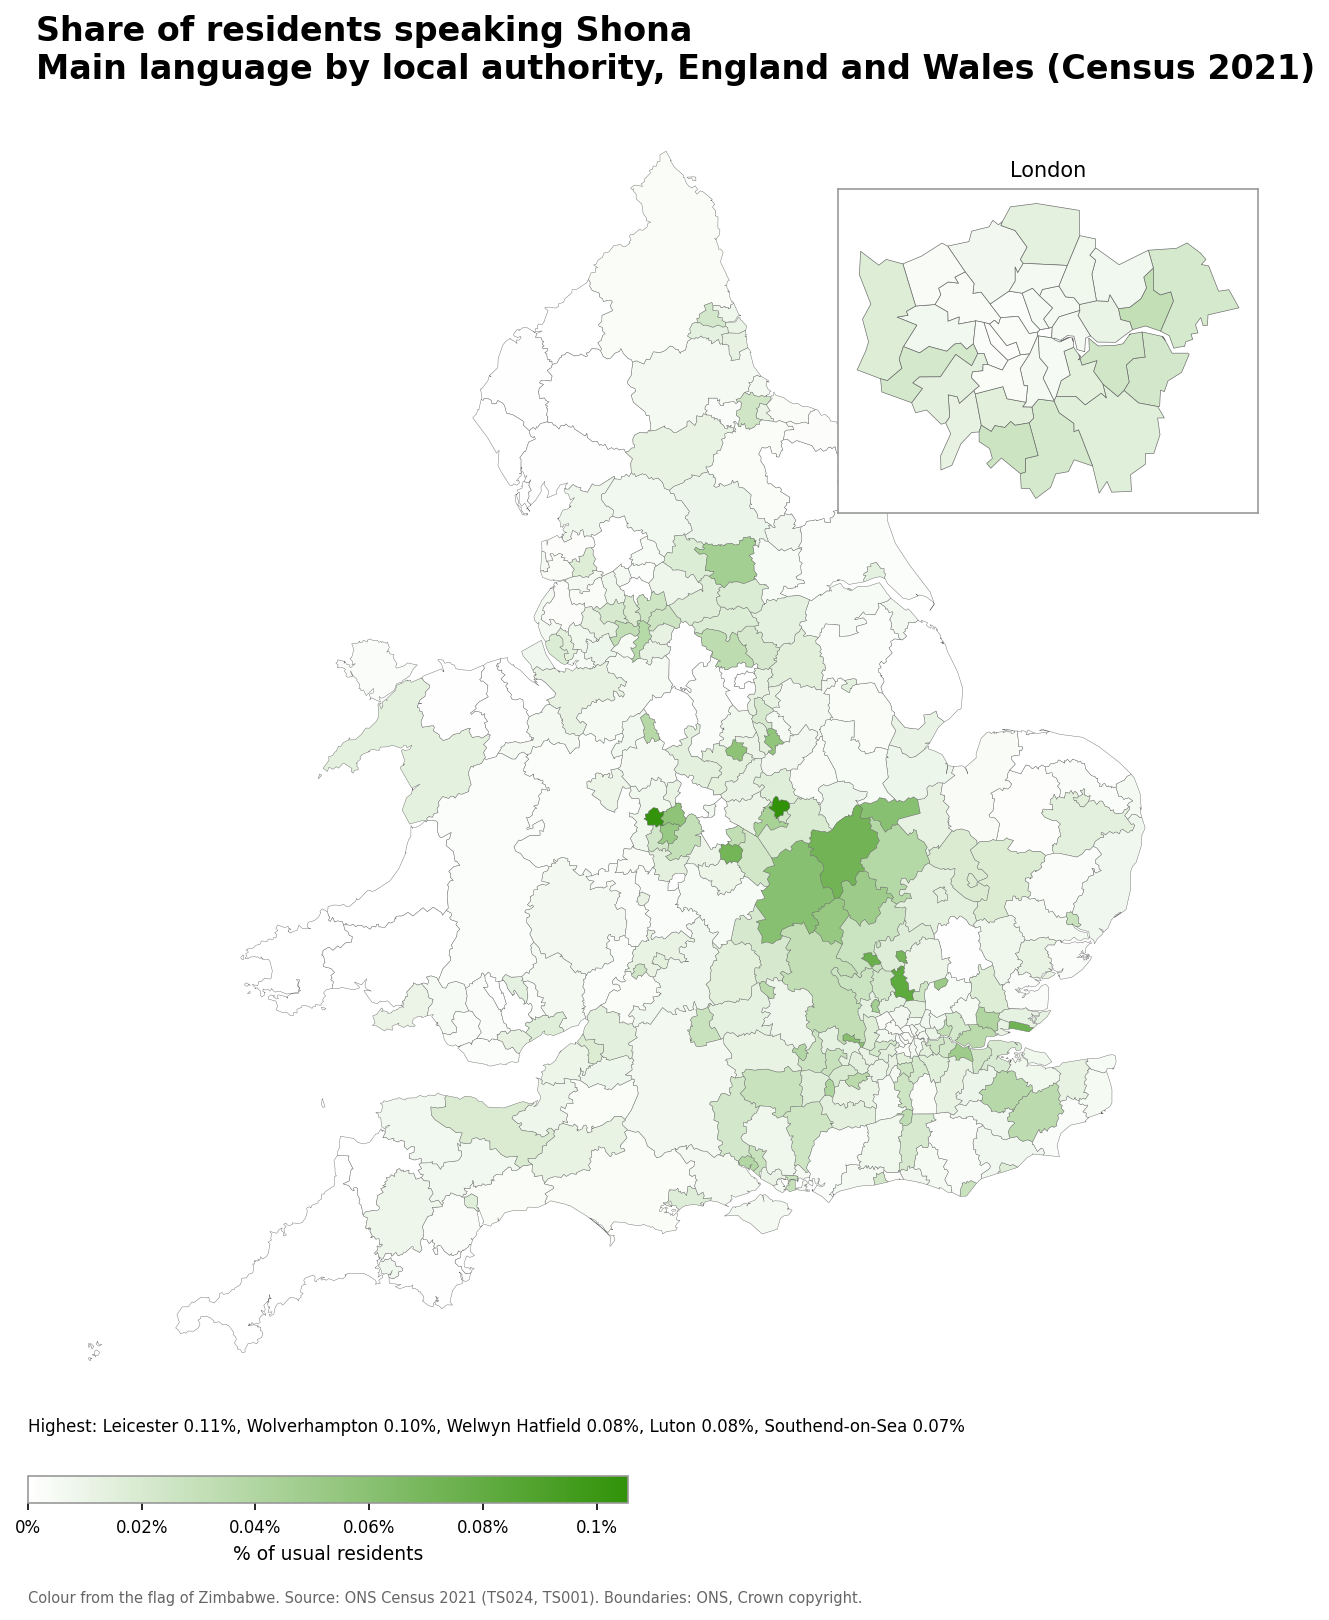
- Leicester: 0.11% (389 speakers)
- Wolverhampton: 0.10% (274 speakers)
- Welwyn Hatfield: 0.08% (99 speakers)
- Luton: 0.08% (173 speakers)
- Southend-on-Sea: 0.07% (132 speakers)
Number of Afrikaans speakers
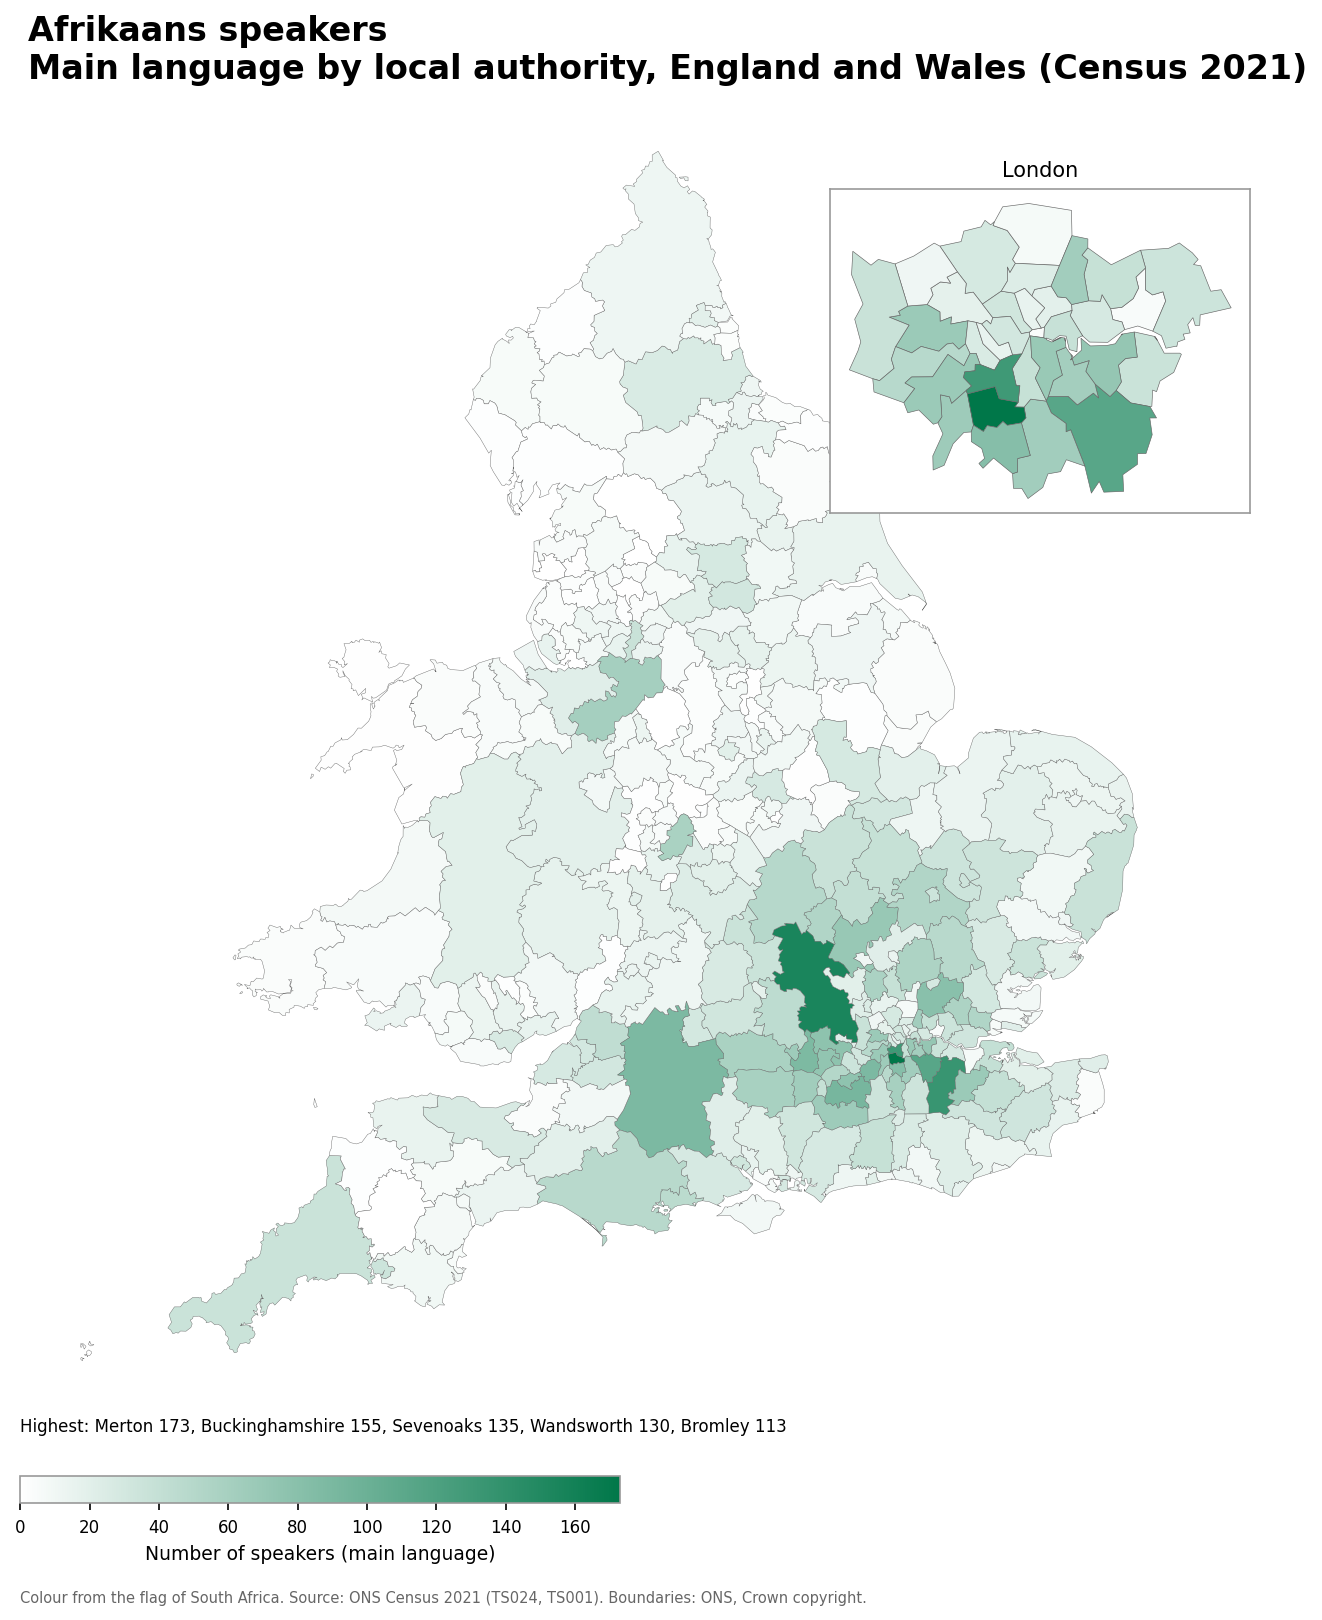
- Merton: 173
- Buckinghamshire: 155
- Sevenoaks: 135
- Wandsworth: 130
- Bromley: 113
Afrikaans speakers as a share of the population
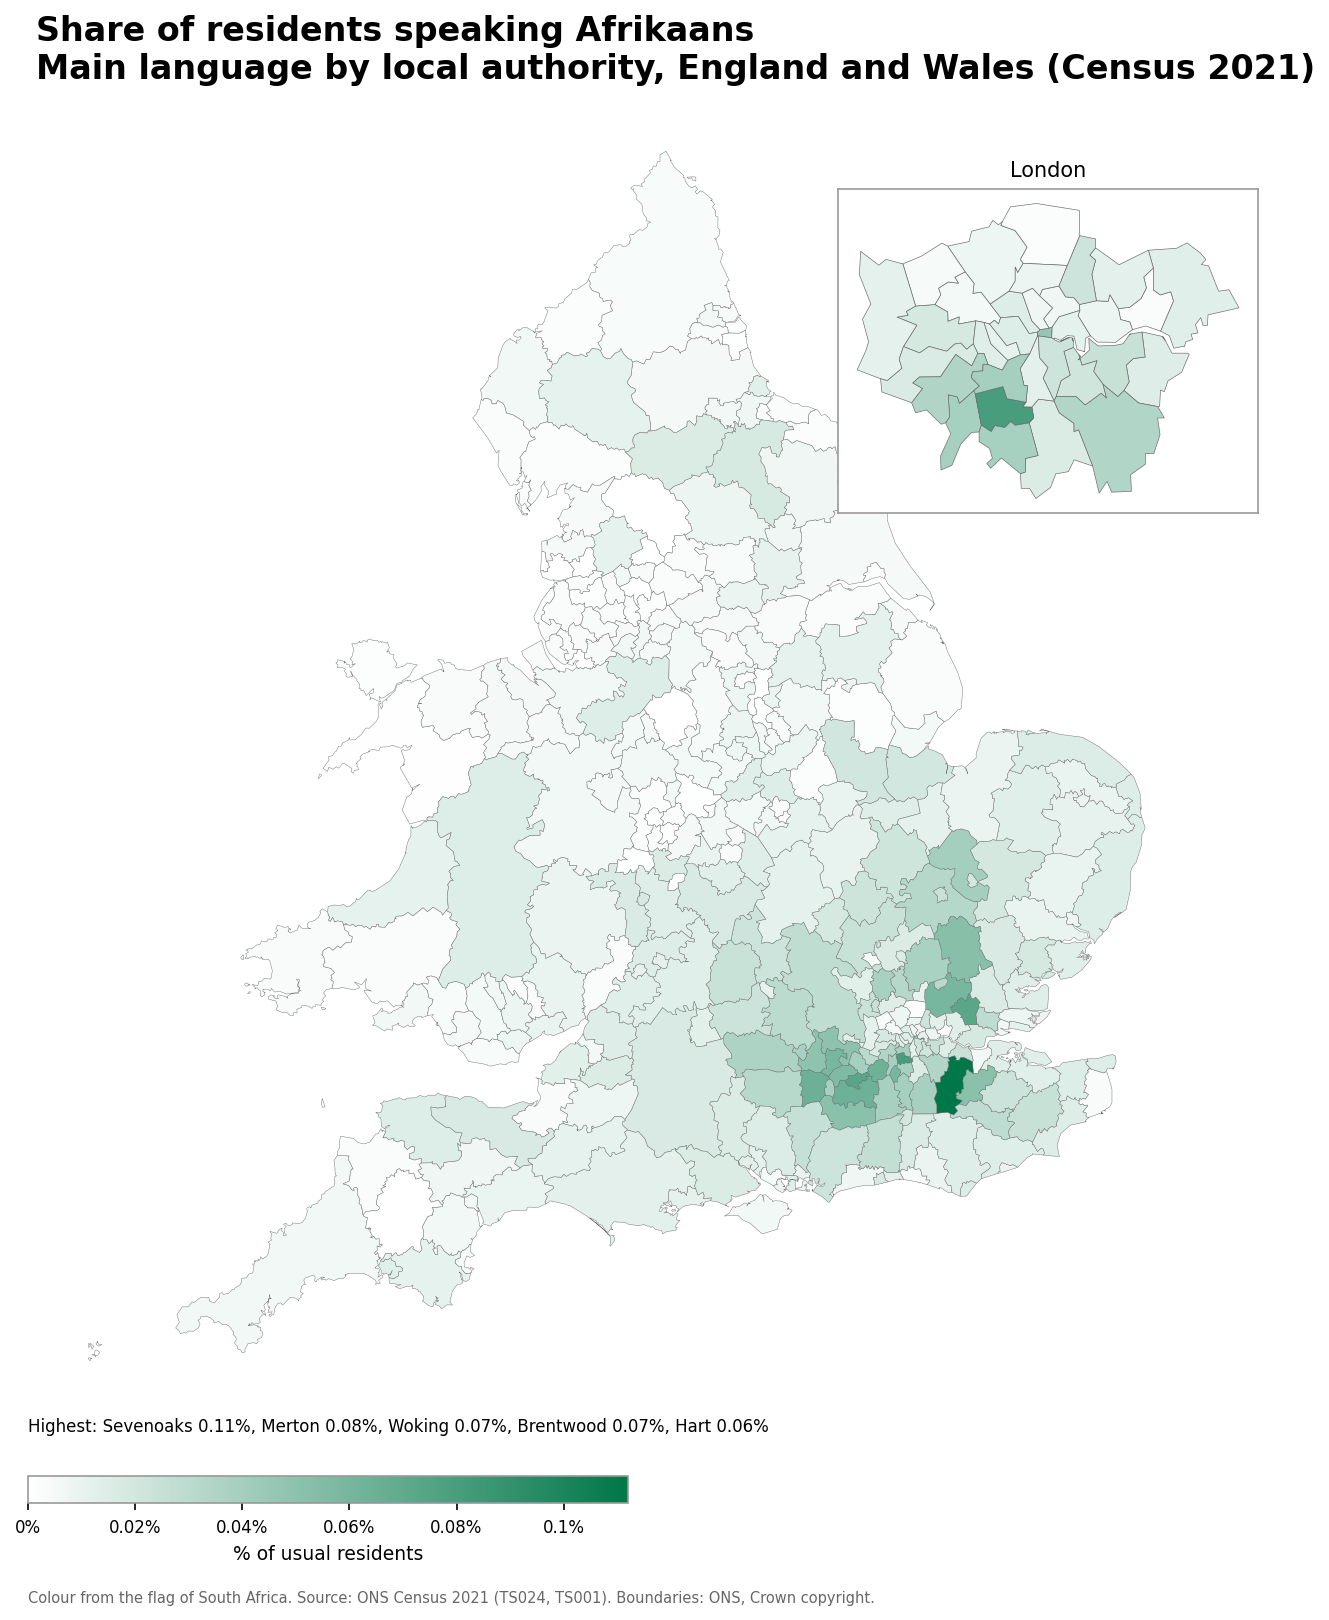
- Sevenoaks: 0.11% (135 speakers)
- Merton: 0.08% (173 speakers)
- Woking: 0.07% (76 speakers)
- Brentwood: 0.07% (56 speakers)
- Hart: 0.06% (64 speakers)
Number of English-based Caribbean Creole speakers
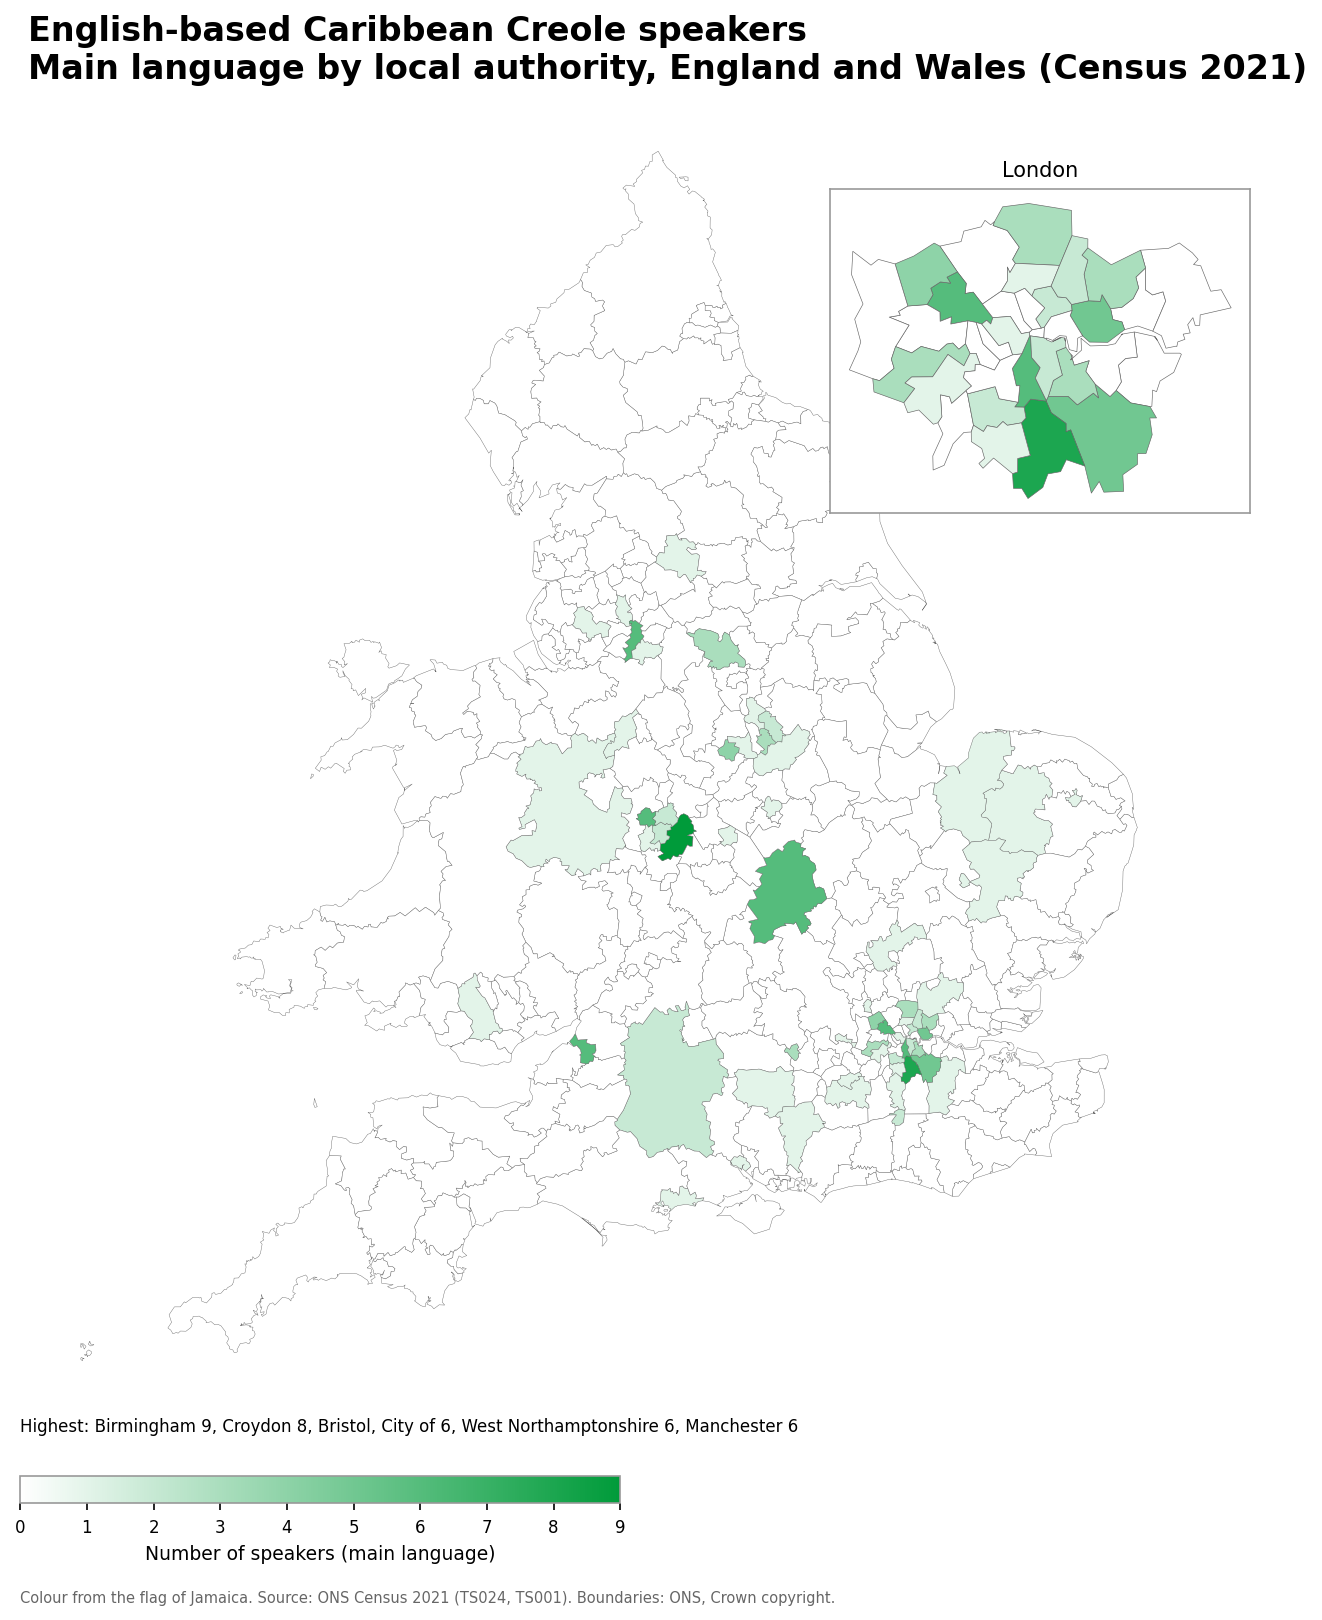
- Birmingham: 9
- Croydon: 8
- Wolverhampton: 6
- West Northamptonshire: 6
- Bristol: 6
English-based Caribbean Creole speakers as a share of the population
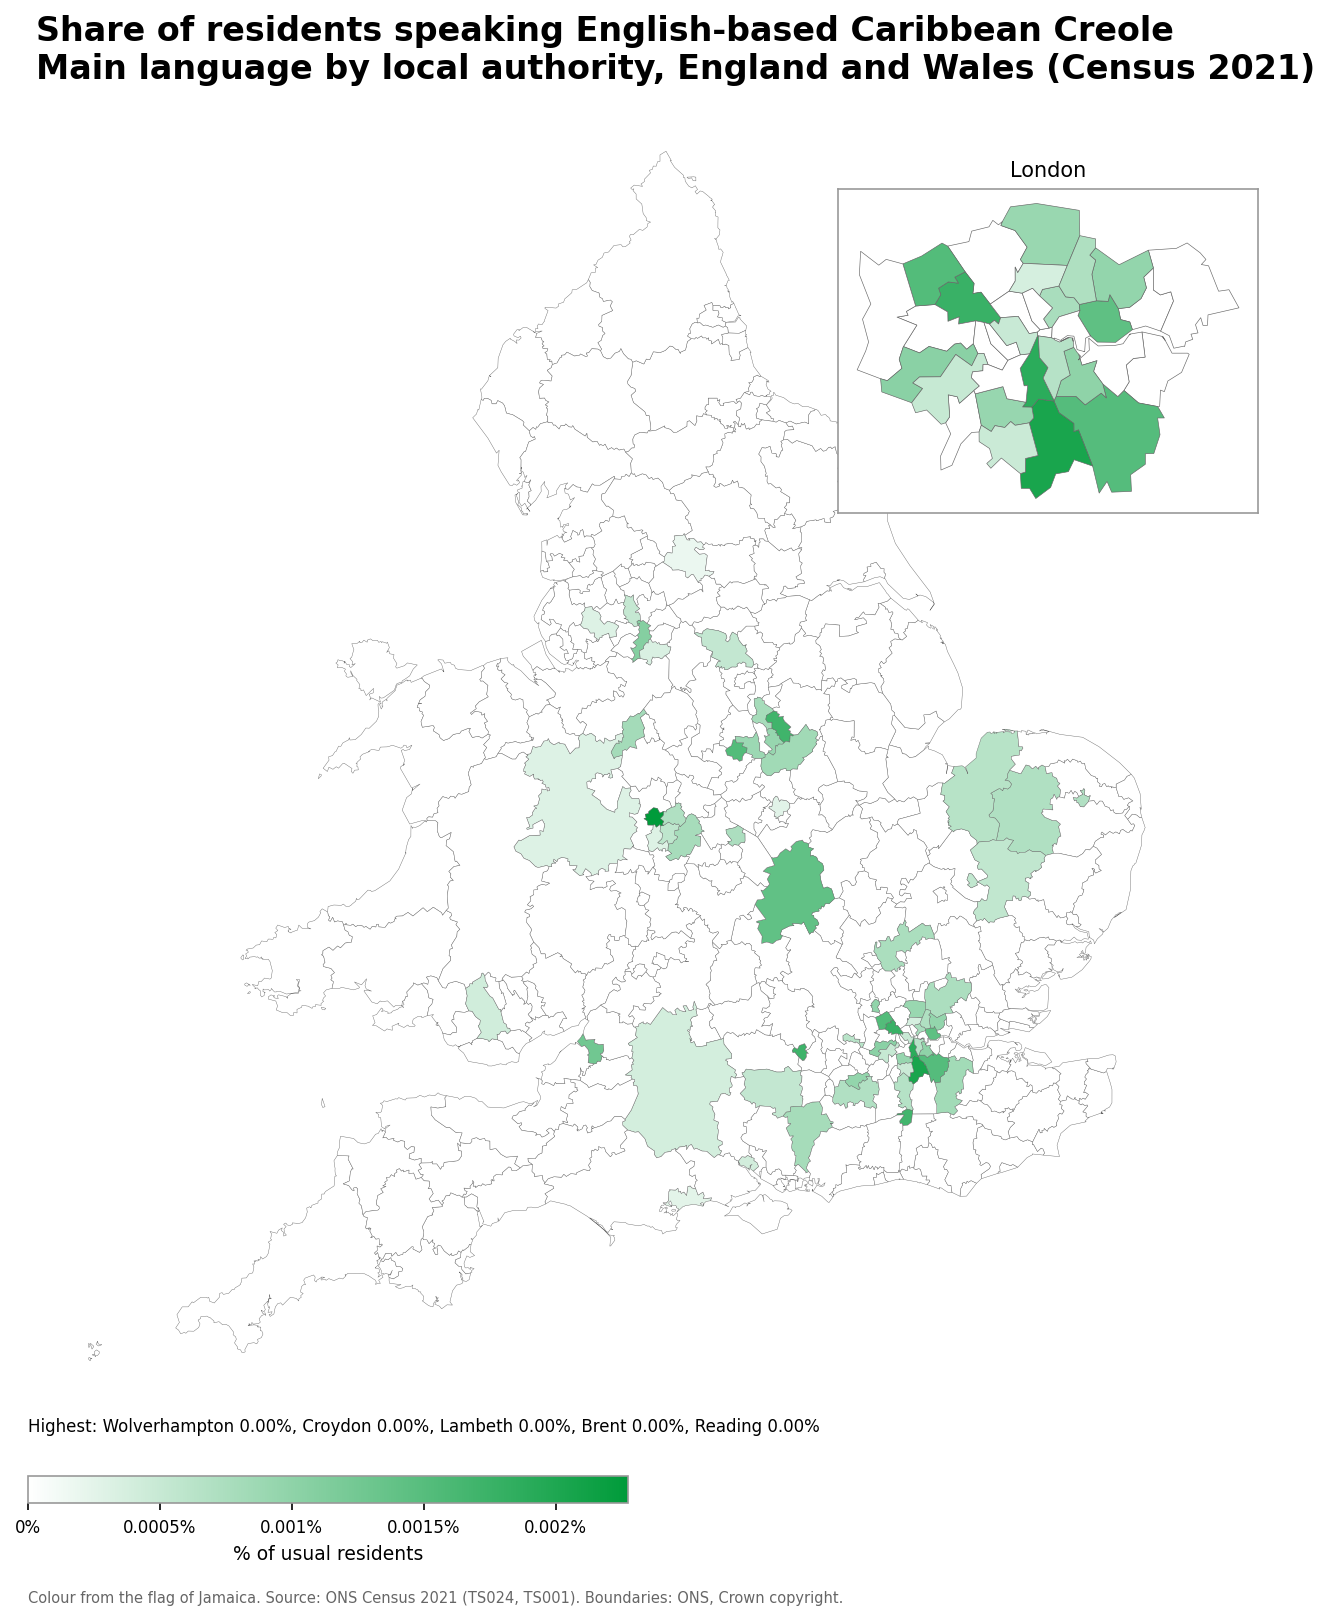
- Wolverhampton: 0.00% (6 speakers)
- Croydon: 0.00% (8 speakers)
- Lambeth: 0.00% (6 speakers)
- Brent: 0.00% (6 speakers)
- Reading: 0.00% (3 speakers)
Top 3 Foreign Languages By Local Authority
| Local Authority | population | 1st Most Spoken Language | 2nd Most Spoken Language | 3rd Most Spoken Language |
|---|---|---|---|---|
| Hartlepool | 92,338 | Polish (433) | Arabic (264) | Bengali (103) |
| Middlesbrough | 143,924 | Arabic (1,090) | Romanian (1,007) | Urdu (1,001) |
| Redcar and Cleveland | 136,531 | Arabic (290) | Polish (171) | Romanian (91) |
| Stockton-on-Tees | 196,595 | Urdu (654) | Panjabi (514) | Polish (446) |
| Darlington | 107,799 | Polish (1,341) | Romanian (624) | Bengali (250) |
| Halton | 128,478 | Polish (663) | Romanian (656) | Arabic (242) |
| Warrington | 210,974 | Polish (3,015) | Romanian (1,501) | Hungarian (696) |
| Blackburn with Darwen | 154,739 | Urdu (4,266) | Gujarati (4,088) | Panjabi (3,070) |
| Blackpool | 141,036 | Polish (1,955) | Romanian (884) | Tagalog (308) |
| Kingston upon Hull | 267,014 | Polish (8,564) | Romanian (3,245) | Lithuanian (1,517) |
| East Riding of Yorkshire | 342,215 | Polish (1,672) | Latvian (626) | Russian (575) |
| North East Lincolnshire | 156,966 | Polish (1,566) | Romanian (1,194) | Latvian (398) |
| North Lincolnshire | 169,680 | Polish (3,319) | Romanian (1,584) | Lithuanian (1,428) |
| York | 202,821 | Chinese (other) (1,538) | Polish (1,344) | Spanish (597) |
| Derby | 261,364 | Panjabi (5,528) | Polish (4,071) | Urdu (4,050) |
| Leicester | 368,572 | Gujarati (44,887) | Panjabi (9,330) | Polish (7,940) |
| Rutland | 41,049 | Polish (137) | Hungarian (39) | Spanish (38) |
| Nottingham | 323,632 | Polish (7,826) | Urdu (4,378) | Arabic (3,279) |
| Herefordshire | 187,034 | Polish (3,005) | Romanian (1,548) | Lithuanian (572) |
| Telford and Wrekin | 185,541 | Polish (3,089) | Romanian (1,756) | Panjabi (1,075) |
| Stoke-on-Trent | 258,369 | Romanian (3,417) | Urdu (2,819) | Polish (2,779) |
| Bath and North East Somerset | 193,409 | Polish (1,400) | Romanian (950) | Spanish (726) |
| Bristol | 472,465 | Polish (7,017) | Spanish (3,858) | Somali (3,152) |
| North Somerset | 216,728 | Polish (2,314) | Romanian (976) | Bulgarian (753) |
| South Gloucestershire | 290,424 | Polish (2,669) | Romanian (1,712) | Portuguese (1,029) |
| Plymouth | 264,695 | Polish (2,700) | Romanian (1,464) | Portuguese (575) |
| Torbay | 139,324 | Polish (1,141) | Romanian (348) | Tagalog (212) |
| Swindon | 233,410 | Polish (3,427) | Portuguese (3,134) | Nepalese (2,277) |
| Peterborough | 215,673 | Polish (7,507) | Lithuanian (6,720) | Portuguese (3,707) |
| Luton | 225,262 | Urdu (8,714) | Polish (7,823) | Romanian (7,455) |
| Southend-on-Sea | 180,686 | Polish (1,368) | Romanian (744) | Portuguese (536) |
| Thurrock | 176,000 | Romanian (4,893) | Polish (2,552) | Lithuanian (2,426) |
| Medway | 279,773 | Romanian (2,064) | Polish (1,802) | Panjabi (1,623) |
| Bracknell Forest | 124,607 | Nepalese (1,256) | Polish (1,132) | Romanian (989) |
| West Berkshire | 161,447 | Polish (1,253) | Romanian (806) | Portuguese (655) |
| Reading | 174,224 | Polish (4,154) | Nepalese (4,147) | Romanian (2,642) |
| Slough | 158,500 | Panjabi (9,527) | Polish (7,724) | Urdu (6,497) |
| Windsor and Maidenhead | 153,496 | Polish (1,582) | Panjabi (1,487) | Spanish (848) |
| Wokingham | 177,502 | Panjabi (1,038) | Polish (1,003) | Romanian (942) |
| Milton Keynes | 287,060 | Romanian (5,269) | Polish (4,465) | Tamil (2,776) |
| Brighton and Hove | 277,103 | Arabic (2,620) | Spanish (2,507) | Italian (2,221) |
| Portsmouth | 208,003 | Romanian (2,515) | Polish (2,287) | Bengali (1,636) |
| Southampton | 248,922 | Polish (10,436) | Romanian (3,176) | Chinese (other) (2,077) |
| Isle of Wight | 140,459 | Polish (486) | Romanian (240) | Tagalog (227) |
| County Durham | 522,068 | Polish (1,787) | Chinese (other) (1,208) | Arabic (596) |
| Cheshire East | 398,772 | Polish (5,102) | Romanian (2,234) | Slovak (721) |
| Cheshire West and Chester | 357,150 | Polish (2,843) | Romanian (992) | Portuguese (604) |
| Shropshire | 323,606 | Polish (1,385) | Bulgarian (1,270) | Romanian (966) |
| Cornwall | 570,305 | Polish (1,853) | Romanian (1,128) | Lithuanian (870) |
| Isles of Scilly | 2,054 | Polish (16) | Hungarian (6) | Bulgarian (5) |
| Wiltshire | 510,330 | Polish (4,062) | Nepalese (2,172) | Romanian (1,787) |
| Bedford | 185,225 | Polish (4,877) | Romanian (2,804) | Panjabi (2,300) |
| Central Bedfordshire | 294,252 | Polish (2,896) | Romanian (2,876) | Portuguese (482) |
| Northumberland | 320,567 | Polish (509) | Arabic (259) | Panjabi (218) |
| Bournemouth, Christchurch and Poole | 400,196 | Polish (6,563) | Portuguese (3,869) | Romanian (3,066) |
| Dorset | 379,579 | Polish (1,497) | Romanian (480) | Nepalese (384) |
| Buckinghamshire | 553,078 | Polish (5,434) | Romanian (4,378) | Panjabi (4,181) |
| North Northamptonshire | 359,522 | Polish (9,297) | Romanian (8,080) | Hungarian (1,408) |
| West Northamptonshire | 425,725 | Romanian (15,250) | Polish (7,828) | Russian (2,019) |
| Cambridge | 145,674 | Spanish (2,517) | Polish (2,379) | Italian (2,264) |
| East Cambridgeshire | 87,762 | Polish (1,142) | Romanian (485) | Lithuanian (394) |
| Fenland | 102,462 | Lithuanian (3,084) | Polish (1,762) | Russian (690) |
| Huntingdonshire | 180,833 | Polish (2,538) | Romanian (919) | Lithuanian (799) |
| South Cambridgeshire | 162,119 | Polish (1,149) | Romanian (724) | Spanish (702) |
| Allerdale | 96,155 | Polish (211) | Romanian (124) | Hungarian (64) |
| Barrow-in-Furness | 67,407 | Tagalog (116) | Polish (110) | Romanian (107) |
| Carlisle | 110,024 | Polish (1,466) | Romanian (431) | Portuguese (205) |
| Copeland | 67,076 | Polish (102) | Arabic (53) | Romanian (51) |
| Eden | 54,735 | Romanian (395) | Polish (324) | Hindi (44) |
| South Lakeland | 104,450 | Polish (714) | Romanian (449) | Hungarian (275) |
| Amber Valley | 126,206 | Polish (636) | Romanian (153) | Chinese (other) (69) |
| Bolsover | 80,273 | Polish (1,644) | Romanian (372) | Bulgarian (89) |
| Chesterfield | 103,569 | Polish (407) | Romanian (205) | Turkish (112) |
| Derbyshire Dales | 71,540 | Polish (173) | Spanish (39) | Arabic (31) |
| Erewash | 112,906 | Polish (690) | Romanian (298) | Hungarian (150) |
| High Peak | 90,932 | Polish (336) | Spanish (59) | Portuguese (49) |
| North East Derbyshire | 102,001 | Polish (235) | Romanian (79) | Hungarian (56) |
| South Derbyshire | 107,208 | Panjabi (763) | Polish (652) | Romanian (238) |
| East Devon | 150,828 | Polish (491) | Romanian (407) | Hungarian (139) |
| Exeter | 130,709 | Polish (1,652) | Romanian (916) | Chinese (other) (860) |
| Mid Devon | 82,852 | Polish (782) | Romanian (227) | Lithuanian (200) |
| North Devon | 98,611 | Polish (257) | Bulgarian (151) | Romanian (127) |
| South Hams | 88,627 | Polish (152) | Arabic (135) | Spanish (98) |
| Teignbridge | 134,803 | Polish (332) | Romanian (222) | Spanish (93) |
| Torridge | 68,114 | Polish (126) | Romanian (76) | Latvian (65) |
| West Devon | 57,096 | Polish (166) | Romanian (103) | Spanish (51) |
| Eastbourne | 101,689 | Polish (1,133) | Portuguese (948) | Romanian (684) |
| Hastings | 90,996 | Romanian (669) | Polish (412) | Russian (295) |
| Lewes | 99,905 | Polish (355) | Spanish (190) | Romanian (185) |
| Rother | 93,110 | Romanian (171) | Polish (143) | Tagalog (109) |
| Wealden | 160,151 | Polish (337) | Romanian (315) | Spanish (199) |
| Basildon | 187,571 | Romanian (2,221) | Polish (852) | Lithuanian (708) |
| Braintree | 155,268 | Polish (1,194) | Romanian (570) | Portuguese (316) |
| Brentwood | 77,047 | Romanian (377) | Polish (201) | Tamil (158) |
| Castle Point | 89,587 | Yiddish (148) | Romanian (139) | Turkish (102) |
| Chelmsford | 181,523 | Romanian (1,368) | Polish (778) | Malayalam (671) |
| Colchester | 192,715 | Romanian (2,033) | Polish (1,282) | Nepalese (766) |
| Epping Forest | 134,980 | Romanian (1,250) | Polish (704) | Turkish (646) |
| Harlow | 93,328 | Romanian (1,912) | Polish (1,569) | Lithuanian (435) |
| Maldon | 66,208 | Polish (119) | Romanian (84) | Bengali (56) |
| Rochford | 85,661 | Polish (86) | Tamil (61) | Romanian (61) |
| Tendring | 148,292 | Polish (415) | Romanian (246) | Turkish (102) |
| Uttlesford | 91,341 | Polish (449) | Romanian (273) | Portuguese (224) |
| Cheltenham | 118,836 | Polish (2,052) | Romanian (821) | Portuguese (519) |
| Cotswold | 90,832 | Romanian (302) | Polish (289) | Spanish (130) |
| Forest of Dean | 87,004 | Romanian (382) | Polish (380) | Bulgarian (61) |
| Gloucester | 132,416 | Polish (2,569) | Romanian (953) | Gujarati (546) |
| Stroud | 121,104 | Polish (564) | Romanian (165) | Portuguese (109) |
| Tewkesbury | 94,884 | Polish (849) | Nepalese (275) | Bulgarian (183) |
| Basingstoke and Deane | 185,154 | Polish (2,314) | Nepalese (1,955) | Romanian (1,099) |
| East Hampshire | 125,746 | Polish (694) | Romanian (513) | Spanish (201) |
| Eastleigh | 136,443 | Polish (908) | Romanian (399) | Panjabi (271) |
| Fareham | 114,513 | Polish (231) | Romanian (193) | Portuguese (121) |
| Gosport | 81,952 | Polish (382) | Romanian (151) | Portuguese (87) |
| Hart | 99,408 | Nepalese (576) | Polish (354) | Romanian (315) |
| Havant | 124,208 | Romanian (486) | Polish (311) | Malayalam (223) |
| New Forest | 175,785 | Polish (630) | Romanian (314) | Spanish (234) |
| Rushmoor | 99,754 | Nepalese (8,571) | Romanian (879) | Polish (796) |
| Test Valley | 130,492 | Polish (1,174) | Nepalese (431) | Romanian (396) |
| Winchester | 127,445 | Nepalese (563) | Polish (480) | Hungarian (304) |
| Broxbourne | 99,007 | Turkish (1,649) | Polish (1,346) | Romanian (1,122) |
| Dacorum | 155,081 | Romanian (2,137) | Polish (1,036) | Portuguese (459) |
| Hertsmere | 107,827 | Romanian (2,759) | Polish (787) | Gujarati (736) |
| North Hertfordshire | 133,210 | Panjabi (810) | Polish (679) | Romanian (347) |
| Three Rivers | 93,771 | Gujarati (1,378) | Romanian (1,049) | Portuguese (681) |
| Watford | 102,246 | Romanian (3,361) | Polish (1,659) | Urdu (1,486) |
| Ashford | 132,747 | Nepalese (3,187) | Polish (914) | Romanian (488) |
| Canterbury | 157,429 | Romanian (1,062) | Polish (550) | Bulgarian (443) |
| Dartford | 116,753 | Romanian (1,205) | Polish (1,118) | Tamil (1,002) |
| Dover | 116,410 | Polish (568) | Slovak (459) | Nepalese (420) |
| Gravesham | 106,900 | Panjabi (3,846) | Romanian (1,525) | Polish (1,343) |
| Maidstone | 175,782 | Nepalese (1,969) | Polish (1,901) | Romanian (1,736) |
| Sevenoaks | 120,514 | Polish (522) | Romanian (324) | Spanish (240) |
| Folkestone and Hythe | 109,758 | Nepalese (1,938) | Romanian (310) | Polish (304) |
| Swale | 151,677 | Romanian (1,065) | Polish (985) | Bulgarian (557) |
| Thanet | 140,587 | Polish (1,003) | Slovak (563) | Latvian (358) |
| Tonbridge and Malling | 132,201 | Polish (402) | Romanian (390) | Nepalese (249) |
| Tunbridge Wells | 115,311 | Polish (845) | Romanian (584) | Bulgarian (450) |
| Burnley | 94,646 | Urdu (1,560) | Panjabi (1,018) | Polish (1,016) |
| Chorley | 117,732 | Polish (804) | Romanian (173) | Arabic (144) |
| Fylde | 81,375 | Polish (265) | Russian (241) | Latvian (176) |
| Hyndburn | 82,234 | Panjabi (1,284) | Polish (1,131) | Urdu (1,075) |
| Lancaster | 142,931 | Polish (2,006) | Chinese (other) (748) | Bulgarian (431) |
| Pendle | 95,757 | Panjabi (3,549) | Urdu (3,441) | Polish (1,406) |
| Preston | 147,835 | Polish (3,292) | Gujarati (2,873) | Urdu (1,451) |
| Ribble Valley | 61,561 | Polish (245) | Spanish (41) | Panjabi (41) |
| Rossendale | 70,871 | Bengali (405) | Polish (167) | Urdu (148) |
| South Ribble | 111,035 | Polish (626) | Hungarian (151) | Romanian (147) |
| West Lancashire | 117,429 | Polish (674) | Latvian (480) | Romanian (475) |
| Wyre | 111,946 | Bulgarian (273) | Polish (130) | Chinese (other) (75) |
| Blaby | 102,926 | Panjabi (1,089) | Polish (926) | Gujarati (698) |
| Charnwood | 183,971 | Gujarati (2,949) | Polish (1,301) | Romanian (950) |
| Harborough | 97,625 | Gujarati (363) | Panjabi (335) | Polish (307) |
| Hinckley and Bosworth | 113,640 | Polish (826) | Romanian (393) | Panjabi (162) |
| Melton | 51,752 | Polish (761) | Romanian (81) | Portuguese (43) |
| North West Leicestershire | 104,705 | Polish (1,173) | Romanian (433) | Portuguese (126) |
| Oadby and Wigston | 57,747 | Panjabi (1,679) | Gujarati (1,276) | Urdu (336) |
| Boston | 70,502 | Polish (3,886) | Lithuanian (3,452) | Romanian (1,380) |
| East Lindsey | 142,296 | Polish (571) | Hungarian (160) | Romanian (132) |
| Lincoln | 103,813 | Polish (2,385) | Romanian (1,223) | Lithuanian (928) |
| North Kesteven | 118,074 | Polish (553) | Lithuanian (246) | Romanian (137) |
| South Holland | 95,122 | Polish (3,737) | Lithuanian (2,147) | Romanian (1,293) |
| South Kesteven | 143,404 | Polish (1,817) | Lithuanian (678) | Portuguese (407) |
| West Lindsey | 95,153 | Polish (317) | Lithuanian (132) | Romanian (71) |
| Breckland | 141,476 | Polish (2,640) | Portuguese (1,751) | Lithuanian (1,418) |
| Broadland | 131,721 | Polish (309) | Romanian (268) | Lithuanian (148) |
| Great Yarmouth | 99,745 | Portuguese (1,782) | Lithuanian (1,407) | Romanian (537) |
| King's Lynn and West Norfolk | 154,325 | Lithuanian (2,655) | Polish (1,014) | Russian (986) |
| North Norfolk | 102,979 | Polish (315) | Romanian (119) | Lithuanian (85) |
| Norwich | 143,922 | Polish (1,652) | Lithuanian (1,302) | Romanian (1,237) |
| South Norfolk | 141,947 | Polish (599) | Romanian (395) | Bulgarian (227) |
| Craven | 56,927 | Polish (167) | Hungarian (134) | Romanian (52) |
| Hambleton | 90,690 | Polish (437) | Romanian (92) | Russian (66) |
| Harrogate | 162,670 | Polish (1,254) | Hungarian (369) | Romanian (344) |
| Richmondshire | 49,776 | Nepalese (1,060) | Polish (95) | Romanian (43) |
| Ryedale | 54,707 | Polish (339) | Romanian (240) | Hungarian (58) |
| Scarborough | 108,735 | Polish (1,048) | Romanian (647) | Malayalam (97) |
| Selby | 91,988 | Polish (1,310) | Romanian (221) | Bulgarian (92) |
| Ashfield | 126,300 | Polish (1,218) | Romanian (561) | Lithuanian (165) |
| Bassetlaw | 117,804 | Polish (2,595) | Romanian (751) | Lithuanian (115) |
| Broxtowe | 110,940 | Hungarian (467) | Polish (425) | Chinese (other) (399) |
| Gedling | 117,263 | Polish (786) | Panjabi (292) | Urdu (222) |
| Mansfield | 110,482 | Polish (3,325) | Romanian (1,655) | Latvian (590) |
| Newark and Sherwood | 122,956 | Polish (1,617) | Romanian (877) | Lithuanian (727) |
| Rushcliffe | 119,077 | Panjabi (272) | Polish (246) | Spanish (196) |
| Cherwell | 161,016 | Polish (3,301) | Romanian (2,022) | Portuguese (1,061) |
| Oxford | 162,041 | Portuguese (2,707) | Spanish (2,214) | Polish (2,185) |
| South Oxfordshire | 149,085 | Polish (1,385) | Romanian (658) | Spanish (486) |
| Vale of White Horse | 138,913 | Polish (800) | Portuguese (560) | Spanish (499) |
| West Oxfordshire | 114,237 | Polish (885) | Romanian (471) | Portuguese (436) |
| Mendip | 116,089 | Polish (922) | Romanian (509) | Portuguese (209) |
| Sedgemoor | 125,343 | Polish (1,520) | Romanian (862) | Portuguese (599) |
| South Somerset | 172,671 | Polish (2,472) | Romanian (1,129) | Portuguese (850) |
| Cannock Chase | 100,519 | Romanian (366) | Polish (304) | Panjabi (121) |
| East Staffordshire | 124,019 | Polish (2,878) | Romanian (1,700) | Urdu (1,352) |
| Lichfield | 106,436 | Polish (466) | Romanian (234) | Panjabi (191) |
| Newcastle-under-Lyme | 123,299 | Polish (662) | Romanian (503) | Malayalam (350) |
| South Staffordshire | 110,472 | Panjabi (365) | Polish (110) | Romanian (78) |
| Stafford | 136,867 | Polish (837) | Romanian (533) | Nepalese (475) |
| Staffordshire Moorlands | 95,845 | Polish (176) | Romanian (86) | Tamil (45) |
| Tamworth | 78,647 | Romanian (1,394) | Polish (788) | Bulgarian (124) |
| Babergh | 92,338 | Polish (317) | Romanian (170) | Turkish (102) |
| Ipswich | 139,642 | Romanian (3,347) | Polish (2,161) | Portuguese (1,664) |
| Mid Suffolk | 102,699 | Polish (243) | Romanian (174) | Portuguese (94) |
| Elmbridge | 138,754 | Polish (1,014) | Spanish (614) | Portuguese (536) |
| Epsom and Ewell | 80,938 | Portuguese (934) | Polish (504) | Romanian (416) |
| Guildford | 143,649 | Spanish (930) | Polish (916) | Chinese (other) (719) |
| Mole Valley | 87,386 | Polish (431) | Spanish (243) | Romanian (232) |
| Reigate and Banstead | 150,846 | Romanian (749) | Portuguese (747) | Polish (736) |
| Runnymede | 88,079 | Polish (679) | Romanian (661) | Portuguese (592) |
| Spelthorne | 102,956 | Polish (1,592) | Romanian (991) | Panjabi (856) |
| Surrey Heath | 90,453 | Nepalese (1,022) | Polish (438) | Romanian (370) |
| Tandridge | 87,874 | Polish (264) | Romanian (166) | Spanish (132) |
| Waverley | 128,229 | Polish (398) | Romanian (375) | Urdu (354) |
| Woking | 103,943 | Romanian (1,192) | Urdu (1,028) | Portuguese (945) |
| North Warwickshire | 65,035 | Romanian (438) | Polish (241) | Panjabi (72) |
| Nuneaton and Bedworth | 134,197 | Polish (2,309) | Romanian (1,362) | Panjabi (1,281) |
| Rugby | 114,363 | Polish (3,381) | Romanian (2,037) | Portuguese (743) |
| Stratford-on-Avon | 134,725 | Polish (1,322) | Romanian (691) | Portuguese (170) |
| Warwick | 148,452 | Panjabi (2,009) | Polish (1,211) | Romanian (1,110) |
| Adur | 64,544 | Polish (262) | Arabic (201) | Portuguese (115) |
| Arun | 164,889 | Polish (3,492) | Romanian (884) | Lithuanian (764) |
| Chichester | 124,068 | Polish (915) | Romanian (440) | Portuguese (247) |
| Crawley | 118,493 | Romanian (2,368) | Polish (1,992) | Portuguese (1,543) |
| Horsham | 146,778 | Romanian (531) | Polish (469) | Spanish (319) |
| Mid Sussex | 152,566 | Romanian (627) | Polish (502) | Spanish (372) |
| Worthing | 111,338 | Polish (652) | Romanian (582) | Italian (321) |
| Bromsgrove | 99,183 | Panjabi (215) | Polish (146) | Chinese (other) (76) |
| Malvern Hills | 79,486 | Polish (321) | Chinese (other) (114) | Romanian (97) |
| Redditch | 87,036 | Polish (2,984) | Romanian (809) | Urdu (539) |
| Worcester | 103,872 | Polish (1,661) | Romanian (1,484) | Portuguese (733) |
| Wychavon | 132,492 | Polish (2,376) | Romanian (1,052) | Bulgarian (720) |
| Wyre Forest | 101,607 | Polish (626) | Romanian (479) | Bengali (193) |
| St Albans | 148,167 | Polish (852) | Bengali (755) | Spanish (663) |
| Welwyn Hatfield | 119,837 | Romanian (2,346) | Polish (1,929) | Hungarian (509) |
| East Hertfordshire | 150,158 | Polish (844) | Italian (773) | Portuguese (738) |
| Stevenage | 89,495 | Romanian (1,238) | Polish (987) | Tagalog (509) |
| East Suffolk | 246,058 | Romanian (652) | Polish (582) | Portuguese (470) |
| West Suffolk | 179,948 | Polish (2,458) | Romanian (1,177) | Portuguese (1,039) |
| Somerset West and Taunton | 157,445 | Polish (1,700) | Romanian (1,083) | Portuguese (406) |
| Bolton | 295,963 | Urdu (7,144) | Gujarati (5,716) | Panjabi (2,196) |
| Bury | 193,851 | Urdu (2,697) | Polish (1,713) | Panjabi (1,340) |
| Manchester | 551,938 | Urdu (17,572) | Arabic (10,425) | Polish (6,471) |
| Oldham | 242,089 | Bengali (5,955) | Urdu (5,598) | Panjabi (2,799) |
| Rochdale | 223,773 | Urdu (5,218) | Polish (2,628) | Panjabi (1,818) |
| Salford | 269,923 | Polish (4,813) | Portuguese (2,685) | Arabic (2,461) |
| Stockport | 294,773 | Urdu (1,565) | Persian (1,346) | Polish (1,032) |
| Tameside | 231,073 | Urdu (2,179) | Polish (2,072) | Bengali (1,657) |
| Trafford | 235,052 | Urdu (2,055) | Polish (1,305) | Arabic (1,298) |
| Wigan | 329,330 | Polish (2,059) | Romanian (1,653) | Portuguese (592) |
| Knowsley | 154,517 | Polish (1,011) | Romanian (498) | Portuguese (422) |
| Liverpool | 486,088 | Arabic (5,743) | Polish (4,809) | Chinese (other) (3,326) |
| St. Helens | 183,248 | Polish (1,077) | Romanian (633) | Hungarian (320) |
| Sefton | 279,233 | Polish (2,353) | Romanian (1,101) | Portuguese (884) |
| Wirral | 320,199 | Polish (974) | Romanian (610) | Chinese (other) (434) |
| Barnsley | 244,572 | Romanian (3,200) | Polish (2,986) | Latvian (403) |
| Doncaster | 308,106 | Polish (6,495) | Romanian (5,428) | Kurdish (699) |
| Rotherham | 265,807 | Polish (1,320) | Slovak (1,224) | Urdu (1,132) |
| Sheffield | 556,521 | Arabic (6,055) | Urdu (3,747) | Chinese (other) (3,731) |
| Newcastle upon Tyne | 300,125 | Arabic (3,399) | Bengali (2,228) | Chinese (other) (2,111) |
| North Tyneside | 208,967 | Romanian (471) | Polish (451) | Bengali (284) |
| South Tyneside | 147,776 | Bengali (693) | Polish (317) | Arabic (262) |
| Sunderland | 274,171 | Polish (864) | Bengali (813) | Romanian (402) |
| Birmingham | 1,144,919 | Urdu (25,131) | Panjabi (17,765) | Bengali (13,903) |
| Coventry | 345,324 | Polish (7,719) | Panjabi (7,498) | Romanian (7,145) |
| Dudley | 323,488 | Urdu (2,420) | Panjabi (2,156) | Polish (1,528) |
| Sandwell | 341,832 | Panjabi (20,984) | Polish (5,685) | Bengali (3,313) |
| Solihull | 216,240 | Panjabi (1,163) | Polish (719) | Gujarati (665) |
| Walsall | 284,124 | Panjabi (7,437) | Polish (3,234) | Urdu (2,975) |
| Wolverhampton | 263,727 | Panjabi (16,538) | Romanian (3,543) | Polish (3,039) |
| Bradford | 546,412 | Urdu (15,270) | Panjabi (13,558) | Polish (5,992) |
| Calderdale | 206,631 | Panjabi (2,130) | Urdu (1,499) | Polish (1,484) |
| Kirklees | 433,216 | Urdu (6,857) | Panjabi (6,656) | Gujarati (3,346) |
| Leeds | 811,953 | Polish (8,271) | Arabic (4,807) | Romanian (4,697) |
| Wakefield | 353,370 | Polish (7,900) | Urdu (1,040) | Romanian (973) |
| Gateshead | 196,151 | Polish (1,150) | Arabic (894) | Kurdish (693) |
| City of London | 8,583 | Spanish (243) | French (169) | Italian (168) |
| Barking and Dagenham | 218,869 | Romanian (9,988) | Bengali (6,475) | Lithuanian (4,427) |
| Barnet | 389,344 | Romanian (11,164) | Persian (8,442) | Polish (5,542) |
| Bexley | 246,472 | Romanian (2,258) | Panjabi (2,175) | Polish (1,505) |
| Brent | 339,816 | Gujarati (21,513) | Romanian (15,570) | Arabic (10,618) |
| Bromley | 329,991 | Portuguese (1,880) | Polish (1,862) | Romanian (1,772) |
| Camden | 210,136 | French (4,538) | Bengali (4,080) | Spanish (3,521) |
| Croydon | 390,719 | Polish (6,262) | Tamil (5,215) | Portuguese (4,876) |
| Ealing | 367,115 | Panjabi (17,286) | Polish (15,449) | Arabic (8,775) |
| Enfield | 329,984 | Turkish (18,765) | Romanian (5,734) | Bulgarian (5,569) |
| Greenwich | 289,068 | Nepalese (5,854) | Romanian (4,629) | Spanish (2,990) |
| Hackney | 259,146 | Turkish (8,008) | Spanish (4,984) | French (3,315) |
| Hammersmith and Fulham | 183,157 | French (4,462) | Spanish (4,389) | Italian (4,003) |
| Haringey | 264,238 | Turkish (9,581) | Spanish (8,011) | Polish (5,921) |
| Harrow | 261,203 | Romanian (18,987) | Gujarati (17,298) | Tamil (8,696) |
| Havering | 262,052 | Romanian (5,742) | Lithuanian (2,203) | Panjabi (1,393) |
| Hillingdon | 305,909 | Panjabi (13,677) | Romanian (5,284) | Polish (5,016) |
| Hounslow | 288,181 | Panjabi (13,059) | Polish (9,219) | Romanian (5,436) |
| Islington | 216,589 | Spanish (4,645) | French (3,770) | Italian (3,711) |
| Kensington and Chelsea | 143,375 | French (4,711) | Spanish (3,630) | Italian (3,452) |
| Kingston upon Thames | 168,063 | Tamil (2,593) | Korean (2,113) | Arabic (1,766) |
| Lambeth | 317,654 | Spanish (12,319) | Portuguese (9,009) | Italian (4,031) |
| Lewisham | 300,553 | Spanish (6,818) | Tamil (3,370) | Portuguese (3,130) |
| Merton | 215,187 | Polish (5,761) | Tamil (5,271) | Portuguese (3,157) |
| Newham | 351,036 | Bengali (21,407) | Romanian (17,694) | Urdu (7,438) |
| Redbridge | 310,260 | Romanian (12,828) | Bengali (9,802) | Panjabi (8,481) |
| Richmond upon Thames | 195,278 | Spanish (1,791) | Polish (1,628) | Turkish (1,446) |
| Southwark | 307,637 | Spanish (12,998) | Italian (4,254) | Portuguese (3,642) |
| Sutton | 209,639 | Tamil (4,383) | Polish (2,640) | Urdu (1,872) |
| Tower Hamlets | 310,306 | Bengali (32,772) | Italian (6,643) | Spanish (5,022) |
| Waltham Forest | 278,425 | Romanian (10,573) | Urdu (4,786) | Bulgarian (4,397) |
| Wandsworth | 327,506 | Spanish (6,002) | Italian (5,168) | Urdu (4,576) |
| Westminster | 204,236 | Arabic (7,446) | French (4,876) | Spanish (4,832) |
| Isle of Anglesey | 68,878 | Polish (91) | Turkish (58) | Arabic (49) |
| Gwynedd | 117,393 | Polish (344) | Arabic (289) | Chinese (other) (273) |
| Conwy | 114,741 | Polish (450) | Chinese (other) (126) | Spanish (115) |
| Denbighshire | 95,818 | Polish (294) | Tagalog (147) | Chinese (other) (122) |
| Flintshire | 154,962 | Polish (2,136) | Romanian (793) | Bulgarian (487) |
| Wrexham | 135,117 | Polish (3,266) | Portuguese (700) | Bulgarian (556) |
| Ceredigion | 71,475 | Polish (741) | Chinese (other) (134) | Romanian (109) |
| Pembrokeshire | 123,360 | Polish (311) | Romanian (152) | Chinese (other) (74) |
| Carmarthenshire | 187,897 | Polish (2,145) | Romanian (282) | Arabic (197) |
| Swansea | 238,490 | Polish (1,863) | Arabic (1,109) | Bengali (803) |
| Neath Port Talbot | 142,289 | Polish (294) | Romanian (194) | Bengali (150) |
| Bridgend | 145,488 | Polish (686) | Romanian (234) | Chinese (other) (123) |
| Vale of Glamorgan | 131,939 | Polish (196) | Spanish (142) | Malayalam (132) |
| Cardiff | 362,310 | Arabic (4,945) | Polish (2,566) | Bengali (2,115) |
| Rhondda Cynon Taf | 237,651 | Polish (662) | Portuguese (221) | Romanian (218) |
| Caerphilly | 175,952 | Polish (484) | Romanian (130) | Hungarian (102) |
| Blaenau Gwent | 66,904 | Polish (552) | Romanian (71) | Turkish (56) |
| Torfaen | 92,276 | Nepalese (250) | Polish (196) | Romanian (65) |
| Monmouthshire | 92,957 | Polish (243) | Romanian (98) | Chinese (other) (88) |
| Newport | 159,587 | Polish (1,503) | Romanian (797) | Bengali (796) |
| Powys | 133,169 | Polish (748) | Nepalese (368) | Romanian (150) |
| Merthyr Tydfil | 58,839 | Polish (1,092) | Portuguese (275) | Bulgarian (135) |


Leave a Reply