
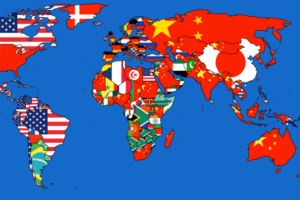
The map above shows every single coalition country to lose a solider in Afghanistan helping the US fight its war on terror in the country between 2001 and 2021.
The US invoked NATO’s Article 5 for the first and only time in its history as direct result of the 9/11 terrorist attacks against the United States.
Here are the total number of deaths per country, along with deaths relative to the country’s population:
| Country | Deaths | Population (2010) | Deaths per million |
|---|---|---|---|
| USA | 2,461 | 309 million | 7.96 |
| UK | 457 | 63 million | 7.25 |
| Canada | 159 | 34 million | 4.68 |
| France | 90 | 63 million | 1.43 |
| Germany | 62 | 82 million | 0.76 |
| Italy | 53 | 60 million | 0.88 |
| Poland | 44 | 38 million | 1.16 |
| Denmark | 43 | 5.5 million | 7.82 |
| Australia | 41 | 22 million | 1.86 |
| Spain | 35 | 46 million | 0.76 |
| Georgia | 32 | 4.4 million | 7.27 |
| Romania | 27 | 21.3 million | 1.27 |
| Netherlands | 25 | 16.6 million | 1.51 |
| Turkey | 15 | 73.7 million | 0.2 |
| Czech Republic | 14 | 10.5 million | 1.33 |
| New Zealand | 10 | 4.4 million | 2.27 |
| Norway | 10 | 4.9 million | 2.04 |
| Estonia | 9 | 1.3 million | 6.92 |
| Hungary | 7 | 10 million | 0.7 |
| Sweden | 5 | 9.4 million | 0.53 |
| Latvia | 4 | 2.2 million | 1.82 |
| Slovakia | 3 | 5.4 million | 0.56 |
| Finland | 2 | 5.4 million | 0.37 |
| Jordan | 2 | 6.1 million | 0.33 |
| Portugal | 2 | 10.6 million | 0.19 |
| South Korea | 2 | 49.5 million | 0.04 |
| Albania | 2 | 2.8 million | 0.71 |
| Belgium | 1 | 11 million | 0.09 |
| Bulgaria | 1 | 7.5 million | 0.13 |
| Croatia | 1 | 4.4 million | 0.23 |
| Lithuania | 1 | 3.2 million | 0.31 |
| Montenegro | 1 | 0.62 million | 1.61 |
And here’s a map showing relative coalition deaths by country:

In total there were 3,621 coalition deaths in Afghanistan, which includes deaths “In and Around Afghanistan,” but not deaths on soldiers on their to and from Afghanistan.
If those were included there would be an additional 59 US deaths, 62 Spanish deaths and 1 additional Canadian death for a total of 122 extra dead, not included in the table above.
Of course this pales in comparison to the civilian loss of life. The Costs of War Project:
“Estimated that 243,000 people died as a direct result of this war.
These figures do not include deaths caused by disease, loss of access to food, water, infrastructure, and/or other indirect consequences of the war.”
Additionally,
Since invading Afghanistan in 2001, the United States has spent $2.313 trillion on the war, which includes operations in both Afghanistan and Pakistan.
Note that this total does not include funds that the United States government is obligated to spend on lifetime care for American veterans of this war, nor does it include future interest payments on money borrowed to fund the war.
Given that the Taliban is now back in power in Afghanistan, it’s difficult not to argue that it was all a huge waste of lives and money.
Just food for thought the next time the US asks the rest of the world for help.
Also see: Map Of Countries That Lost Soldiers Helping US Forces In Iraq Between 2003 & 2011


karl says
you might want to check your percentages. 7 is not .07% of 10,000,000