
The tiers typically range from Tier 1 to Tier 5 or 6, with cities in higher tiers being more economically advanced and internationalized, while lower-tier cities tend to be smaller and less developed.
Breakdown of Tiers and Examples of Cities:
- Tier 1:
Tier 1 cities are the most developed and economically advanced. These cities are major hubs for international business, finance, technology, and culture. They have the highest GDP per capita and are key players in China’s economy. - Tier 2:
Tier 2 cities are also economically developed but do not have the same international status as Tier 1 cities. They are important regional economic centers with a rapidly growing middle class and infrastructure. - Tier 3:
Tier 3 cities are smaller but still economically significant. These cities are often provincial capitals or large urban centers that are experiencing rapid development, with increasing foreign investments and urbanization. - Tier 4:
Tier 4 cities are generally less developed and have smaller populations than Tier 3 cities. They may be emerging economic centers with growth potential but lack the infrastructure and economic dynamism of higher-tier cities. - Tier 5:
Tier 5 cities are the smallest and least developed in this classification. They often serve as local administrative centers or regional trade hubs, and are still building infrastructure and economic growth.
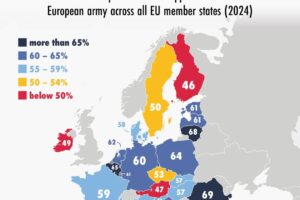
The GDP per capita (PPP) as shown in the map also indicates the wealth levels in different tiers, with Tier 1 cities having a GDP per capita comparable to Portugal ($44,566), Tier 2 cities similar to Chile ($31,693), and Tier 3 cities around the level of Serbia (~$25,176). The lower-tier cities show significantly less economic output, comparable to countries like St. Vincent and the Grenadines, Algeria, and Belize.
And here’s a summary of the population breakdown by the 6 city tiers in China:
- Tier 1:
- Represents 6% of the population.
- These cities are major economic and cultural centers with very large populations, typically 15 to 35 million or more in each city.
- Tier 2:
- Represents 14% of the population.
- These are significant regional hubs, with populations usually in the range of 5 to 15 million people.
- Tier 3:
- Represents 16% of the population.
- Cities in this tier have moderately large populations, typically ranging between 2 to 10 million people.
- Tier 4:
- Represents 26% of the population.
- These cities have smaller but still substantial populations, often between 1 and 5 million people.
- Tier 5:
- Represents 22% of the population.
- These cities generally have populations of 500,000 to 2 million people.
- Tier 6:
- Represents 16% of the population.
- These cities are the smallest in terms of population, often with fewer than 500,000 residents.
Key Takeaways:
- The majority of the population is concentrated in lower-tier cities (Tiers 4-6), which account for about 64% of the total population.
- Tier 1 and Tier 2 cities, despite their importance and higher levels of development, only house around 20% of the population.


Leave a Reply