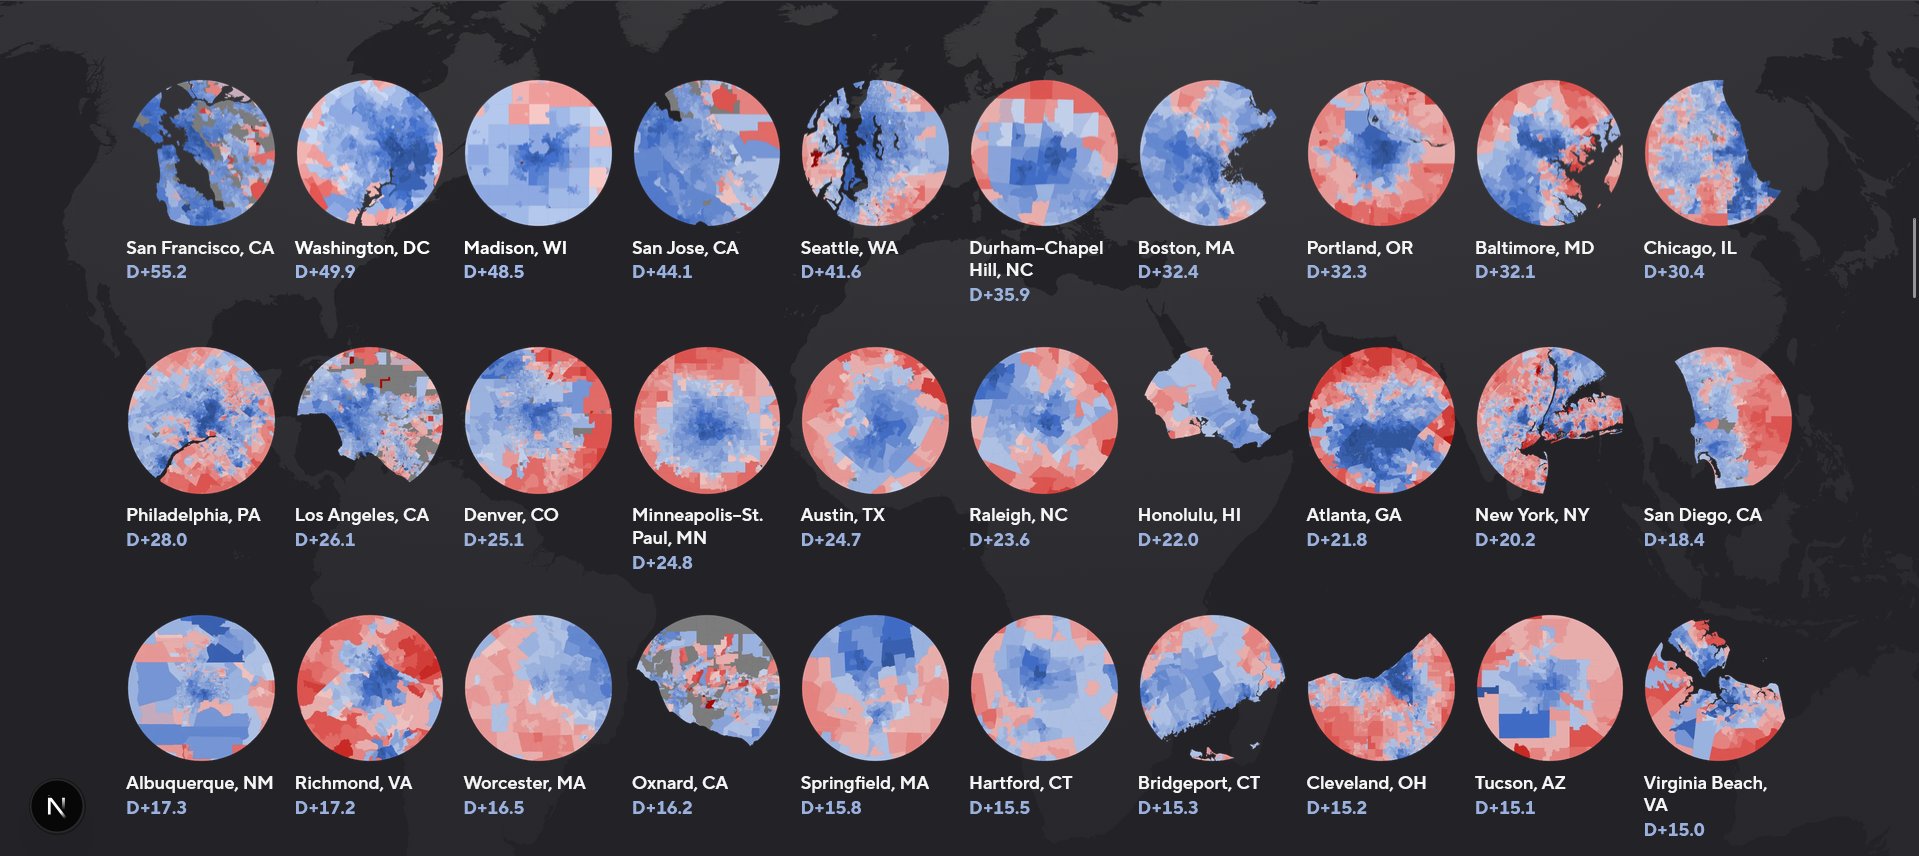
The two maps here come from Josh Metcalf at VoteHub and show the 30 most Democratic and 30 most Republican major metro areas from the top 100 in the United States.
The data is based on the 2024 presidential results within CBSA boundaries.
The 30 Most Democratic Cities are:
- San Francisco, CA – D+55.2
- Washington, DC – D+49.9
- Madison, WI – D+48.5
- San Jose, CA – D+44.1
- Seattle, WA – D+41.6
- Durham–Chapel Hill, NC – D+35.9
- Boston, MA – D+32.4
- Portland, OR – D+32.3
- Baltimore, MD – D+32.1
- Chicago, IL – D+30.4
- Philadelphia, PA – D+28.0
- Los Angeles, CA – D+26.1
- Denver, CO – D+25.1
- Minneapolis–St. Paul, MN – D+24.8
- Austin, TX – D+24.7
- Raleigh, NC – D+23.6
- Honolulu, HI – D+22.0
- Atlanta, GA – D+21.8
- New York, NY – D+20.2
- San Diego, CA – D+18.4
- Albuquerque, NM – D+17.3
- Richmond, VA – D+17.2
- Worcester, MA – D+16.5
- Oxnard, CA – D+16.2
- Springfield, MA – D+15.8
- Hartford, CT – D+15.5
- Bridgeport, CT – D+15.3
- Cleveland, OH – D+15.2
- Tucson, AZ – D+15.1
- Virginia Beach, VA – D+15.0
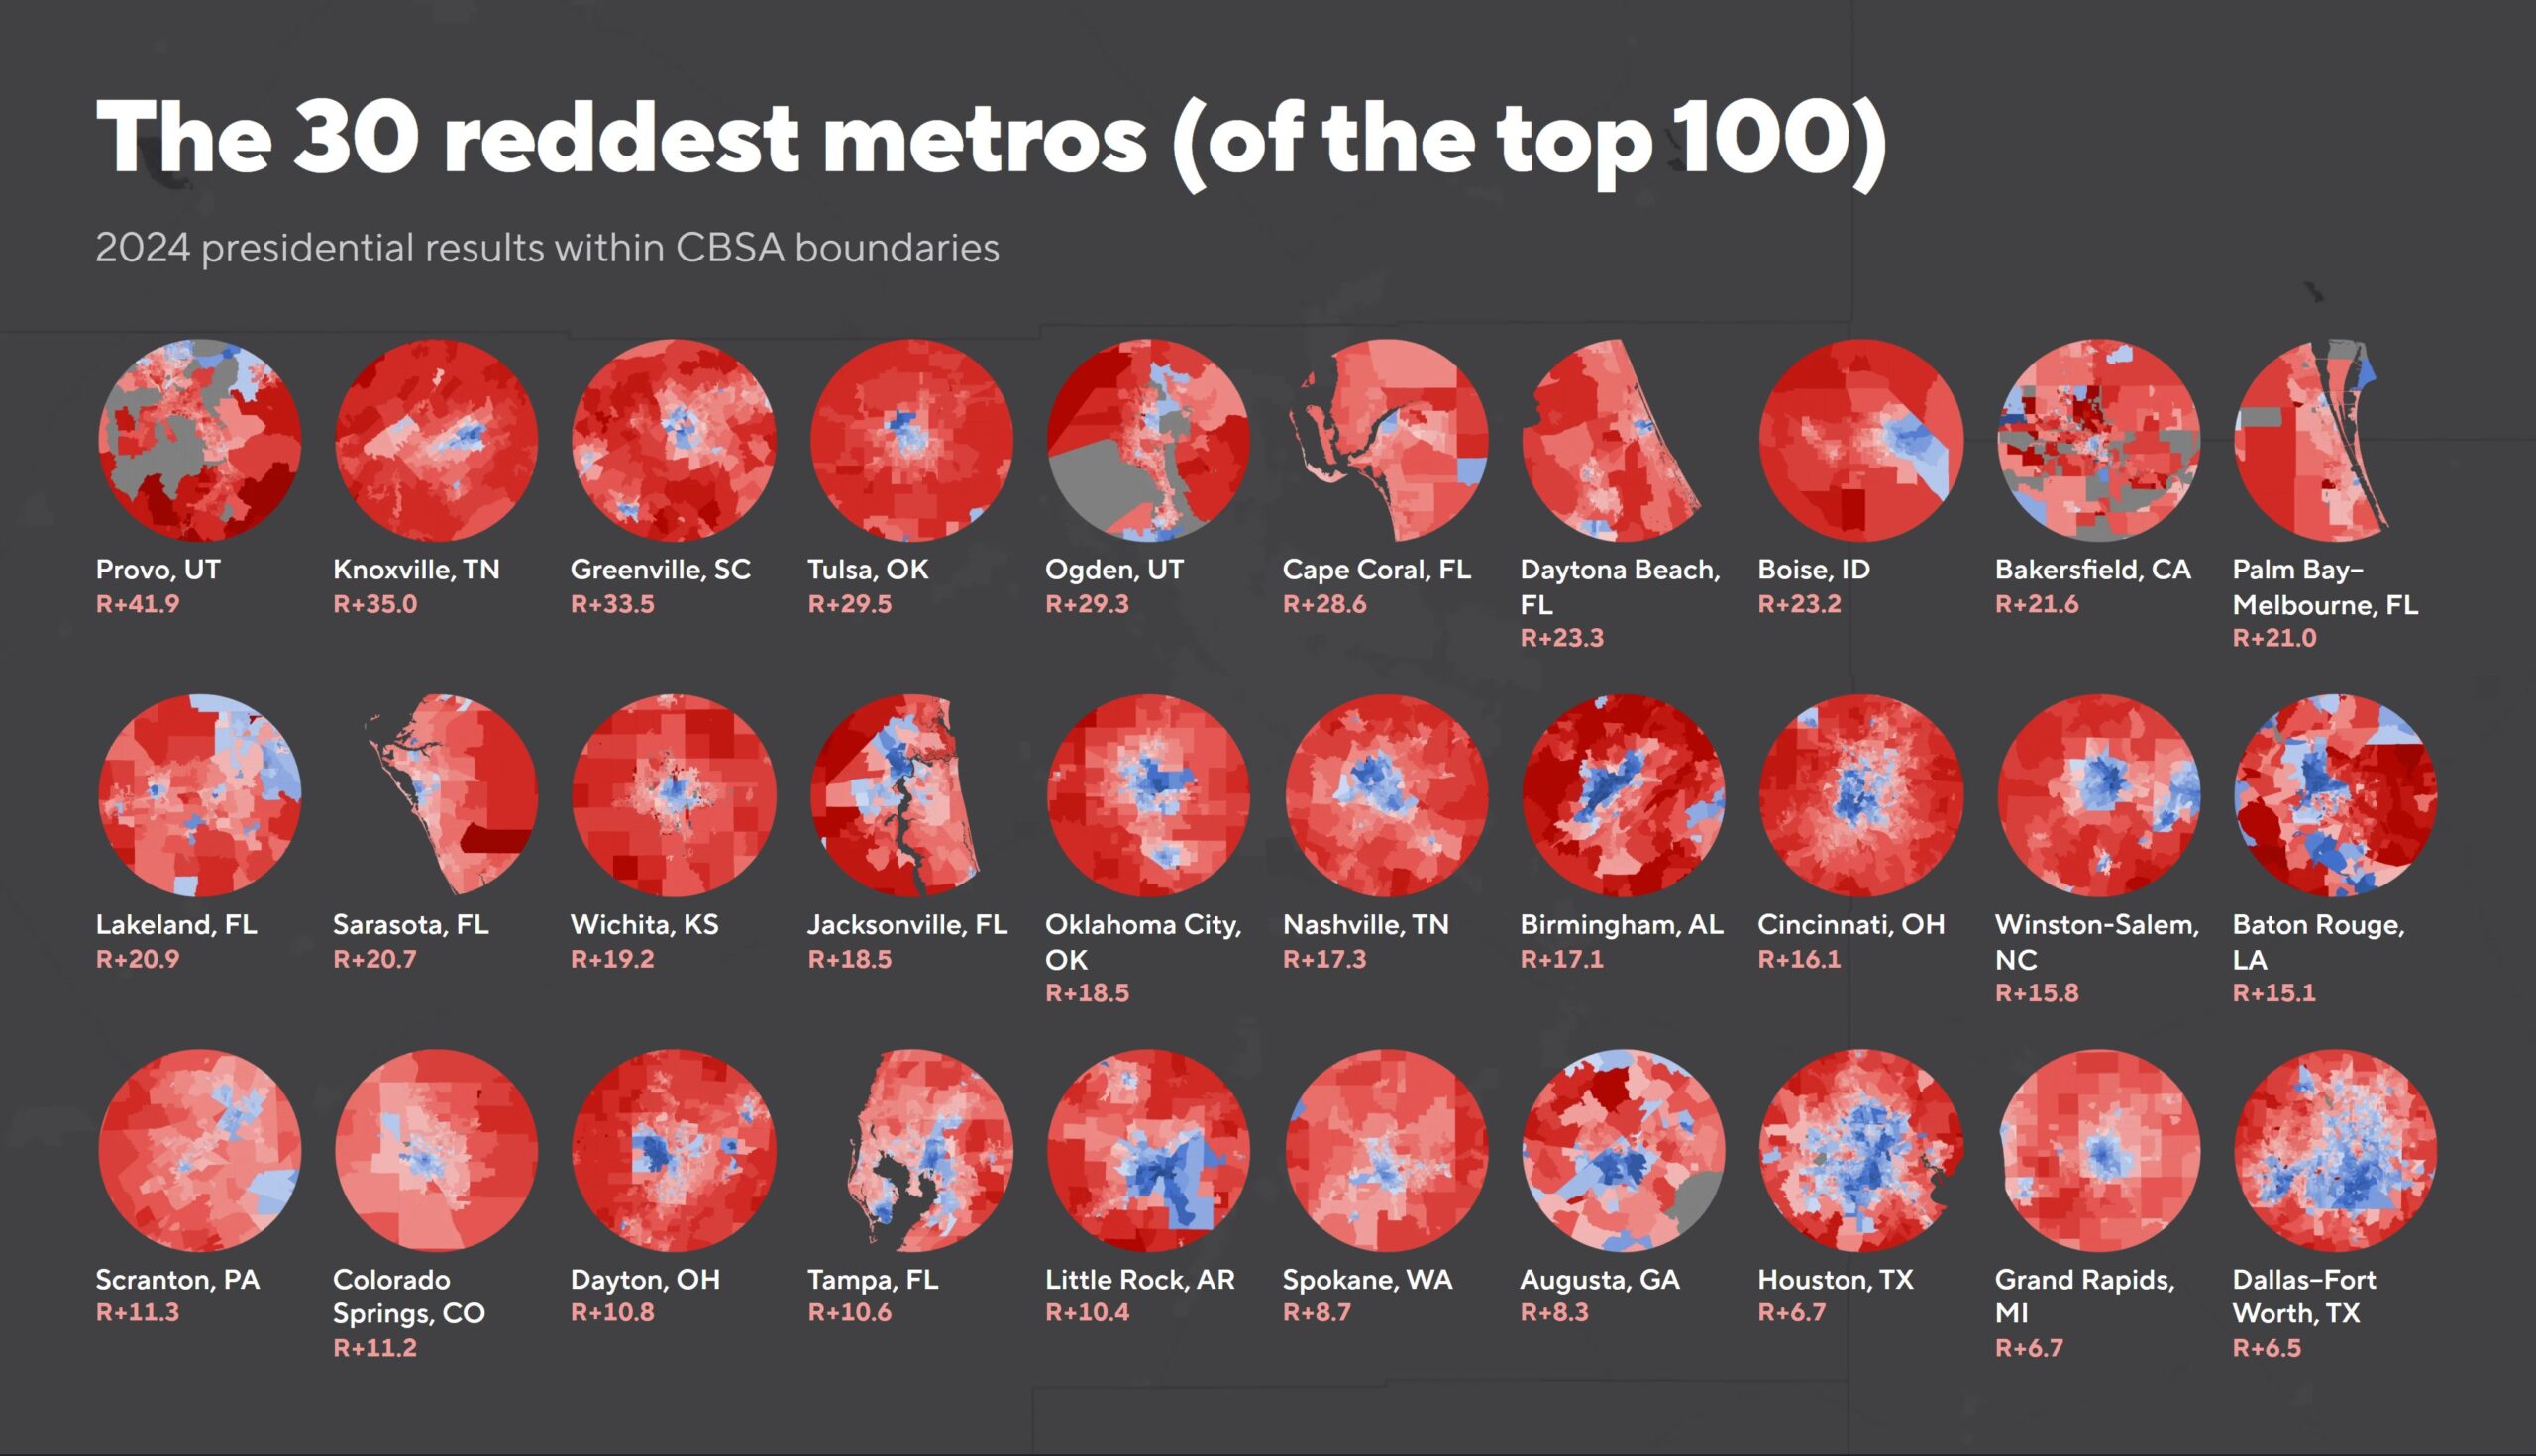
The 30 Most Republican Cities are:
- Provo, UT – R+41.9
- Knoxville, TN – R+35.0
- Greenville, SC – R+33.5
- Tulsa, OK – R+29.5
- Ogden, UT – R+29.3
- Cape Coral, FL – R+28.6
- Daytona Beach, FL – R+23.3
- Boise, ID – R+23.2
- Bakersfield, CA – R+21.6
- Palm Bay–Melbourne, FL – R+21.0
- Lakeland, FL – R+20.9
- Sarasota, FL – R+20.7
- Wichita, KS – R+19.2
- Jacksonville, FL – R+18.5
- Oklahoma City, OK – R+18.5
- Nashville, TN – R+17.3
- Birmingham, AL – R+17.1
- Cincinnati, OH – R+16.1
- Winston-Salem, NC – R+15.8
- Baton Rouge, LA – R+15.1
- Scranton, PA – R+11.3
- Colorado Springs, CO – R+11.2
- Dayton, OH – R+10.8
- Tampa, FL – R+10.6
- Little Rock, AR – R+10.4
- Spokane, WA – R+8.7
- Augusta, GA – R+8.3
- Houston, TX – R+6.7
- Grand Rapids, MI – R+6.7
- Dallas–Fort Worth, TX – R+6.5
Which one surprises you the most?







Leave a Reply