The map above shows Illinois and Pennsylvania side by side at exactly the same scale, using equal-area projections, so their true relative sizes are preserved.
Illinois vs Pennsylvania Geography
Land area
- Illinois has a land area of 55,513 square miles (143,778 km²), while Pennsylvania has 44,742 square miles (115,882 km²).
- Illinois' land area is 1.2 times (24%) larger than Pennsylvania's.
Total area
- Illinois: 57,913 square miles (149,995 km²) vs Pennsylvania: 46,054 square miles (119,279 km²), including inland and coastal water.
- Illinois' total area is 1.3 times (26%) larger than Pennsylvania's.
Length
- Illinois is 390 miles (628 km) long from north to south; Pennsylvania is 284 miles (458 km).
- Illinois' north-south length is 1.4 times (37%) longer than Pennsylvania's.
Width
- Illinois spans 283 miles (456 km) east to west; Pennsylvania spans 307 miles (495 km).
- Pennsylvania's east-west width is 1.1 times (8%) wider than Illinois'.
Highest point
- Illinois's highest point is Charles Mound at 1,232 feet (376 m); Pennsylvania's is Mount Davis at 3,210 feet (978 m).
- Mount Davis is 1,978 feet higher than Charles Mound.
Lowest point
- Illinois's lowest point is Mississippi River at 292 feet; Pennsylvania's is Delaware River at 0 feet.
- Pennsylvania's lowest point is 292 feet lower.
Illinois vs Pennsylvania Population and History
Population
- Illinois has a population of 12,710,158 (2024), while Pennsylvania has 13,078,751 (2024).
- Illinois and Pennsylvania have about the same population.
Population density
- Illinois: 229.0 people per square mile vs Pennsylvania: 292.3.
- Pennsylvania's population density is 1.3 times (28%) higher than Illinois'.
Biggest city
- Illinois's biggest city is Chicago with 2,721,308 people; Pennsylvania's is Philadelphia with 1,573,916.
- Chicago's population is 1.7 times (73%) larger than Philadelphia's.
Largest metro area
- Illinois's largest metropolitan area is Chicago-Naperville-Elgin, IL-IN metro area (9,408,576 people) vs Pennsylvania's Philadelphia-Camden-Wilmington, PA-NJ-DE-MD metro area (6,330,422).
- Chicago-Naperville-Elgin, IL-IN metro area's population is 1.5 times (49%) larger than Philadelphia-Camden-Wilmington, PA-NJ-DE-MD metro area's.
History
- Illinois: Admitted to the Union on December 3, 1818, as the 21st state.
- Pennsylvania: Admitted to the Union on December 12, 1787, as the 2nd state.
- In its current form, Pennsylvania is the older of the two by 31 years.
Illinois vs Pennsylvania Economy
GDP
- Illinois's GDP is $1,148.1 billion (2024) vs Pennsylvania's $1,007.9 billion.
- Illinois' economic output is 1.1 times (14%) larger than Pennsylvania's.
GDP per capita
- Illinois: $90,330 per person vs Pennsylvania: $77,062.
- Illinois' GDP per capita is 1.2 times (17%) higher than Pennsylvania's.
Average income
- Illinois: $74,522 vs Pennsylvania: $70,678 average income per person (per capita personal income).
- Illinois' average income is 1.1 times (5%) higher than Pennsylvania's.
Illinois vs Pennsylvania Counties
Number of counties
- Illinois has 102 counties, while Pennsylvania has 67.
- Illinois' county count is 1.5 times (52%) higher than Pennsylvania's.
Biggest county by area
- Illinois's largest county is McLean County at 1,183 square miles; Pennsylvania's is Lycoming County at 1,229 square miles.
- McLean County and Lycoming County have about the same land area.
Smallest county by area
- Illinois: Putnam County (160 sq mi) vs Pennsylvania: Montour County (130 sq mi).
- Putnam County's land area is 1.2 times (23%) larger than Montour County's.
Most populous county
- Illinois: Cook County (5,182,617 people) vs Pennsylvania: Philadelphia County (1,573,916 people).
- Cook County's population is 3.3 times (229%) larger than Philadelphia County's.
Least populous county
- Illinois: Hardin County (3,550 people) vs Pennsylvania: Cameron County (4,348 people).
- Cameron County's population is 1.2 times (22%) larger than Hardin County's.
Richest county
- Illinois: Cumberland County ($104,890 per capita income) vs Pennsylvania: Chester County ($110,883).
- Chester County's income is 1.1 times (6%) richer than Cumberland County's.
Poorest county
- Illinois: Lawrence County ($43,606 per capita income) vs Pennsylvania: Forest County ($30,234).
- Lawrence County's income is 1.4 times (44%) richer than Forest County's.
Illinois vs Pennsylvania Taxes
State income tax
- Illinois has a top income tax rate of 4.95%, while Pennsylvania has a top income tax rate of 3.07%.
- Illinois's top rate is 1.88 percentage points higher.
Property tax
- Illinois: 1.92% effective rate vs Pennsylvania: 1.16% of home value per year.
- Illinois's rate is 0.76 percentage points higher.
Sales tax
- Illinois: 8.98% combined state and average local rate vs Pennsylvania: 6.34%.
- Illinois's combined rate is 2.64 percentage points higher.
Official Websites
Illinois official website · Pennsylvania official website
Download the Illinois vs Pennsylvania Size Comparison Map for free
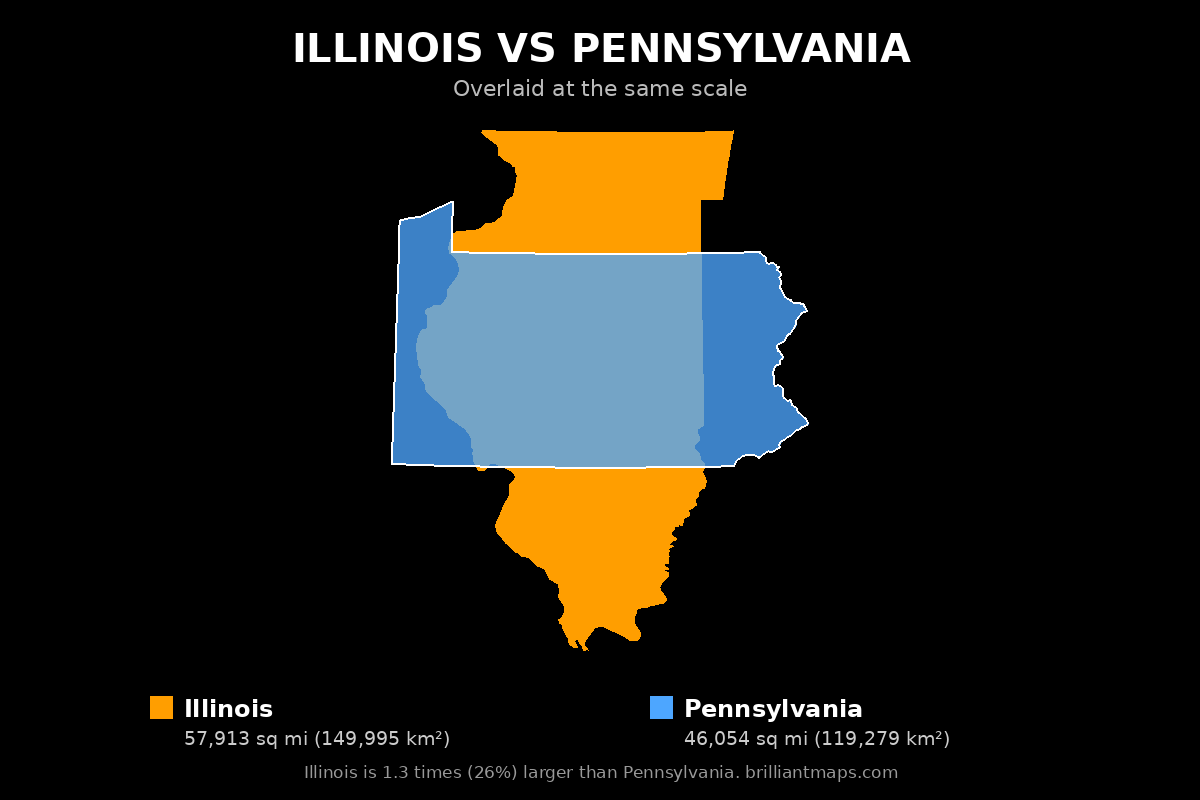
To download the map, right-click the image above (or press and hold on a phone or tablet) and choose Save image as. The map is free to use anywhere, including on your own website or in print, as long as you credit it with a link back to this page or to BrilliantMaps.com.
More Size Comparisons
All Illinois size comparisons · All Pennsylvania size comparisons
Area, elevation and boundary figures come from official national statistics and US Census Bureau and Natural Earth boundary data; US state population, economic, county and tax figures come from the US Census Bureau, the Bureau of Economic Analysis and the Tax Foundation. Figures are rounded and for general reference.