Brilliant Maps

Making Sense Of The World, One Map At A Time

  • BOOK!
  • Newsletter
  • Board Games
  • Posters
  • Scratch Maps

Population Changes In Europe From 1990 to 2020

Last Updated: March 20, 2025 1 Comment

Click To Get My 10 Best Brilliant Maps For Free:

Population Changes In Europe From 1990 to 2020

Map created by Milos Popovic
The map above was created by Data Analyst Milos Popovic and shows how Europe’s population has changed between 1990 and 2020. Green = growth and pink = decline.

Here’s a full explanation from Milos:

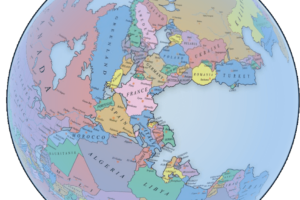
Are you ready for my new map of Europe’s population changes from 1990 to 2020? 😲

I used the latest GHSL population grid at 3 arcsec resolution to reveal how the old continent has evolved in the past 30 years. 🌎 Can you see the trends? 🤔

– Urban areas are thriving! 🚀 More and more people are choosing to live in the big cities and enjoy the opportunities of modern life. 🚘🛒🥂

– Eastern and south eastern Europe are struggling! 😔 Many countries in these regions have faced economic and social difficulties, leading to emigration and depopulation. ✈️👋

– Western Europe is expanding! 🌿 This part of Europe has welcomed more immigrants, tourists, and investors, making it more diverse and prosperous. 🌈💸

Isn’t this fascinating? 🤗 I love making these maps and sharing them with you. 👏 If you want to learn how I do it, check out my video and discover my secrets! 🔥👇

What do you think explains all the changes?

Filed Under: Europe

Click To Get My 10 Best Brilliant Maps For Free:


Other Popular Maps

  • Hypothetical Top Level Domain Names Of Europe In 1199 AD

    Hypothetical Top Level Domain Names Of Europe In 1199 AD

  • Why Are There Two Congos? Republic of the Congo vs Democratic Republic of the Congo

    Why Are There Two Congos? Republic of the Congo vs Democratic Republic of the Congo

  • The “Natural” Borders Of France

    The “Natural” Borders Of France

  • Most Common Country of Origin of New Immigrants To The United States

    Most Common Country of Origin of New Immigrants To The United States

  • The Loss of The Cornish Language 1350 – 1750

    The Loss of The Cornish Language 1350 – 1750

  • How Whites Voted In The 2016 US Presidential Election by State & County

    How Whites Voted In The 2016 US Presidential Election by State & County

  • America’s Drunkest & Driest Counties Based On Excessive Drinking

    America’s Drunkest & Driest Counties Based On Excessive Drinking

  • Map of Pizza Consumption Per Person Per Year

    Map of Pizza Consumption Per Person Per Year

Comments

  1. Marjaana says

    September 2, 2025 at 11:02 am

    Just a thought re the alphabet and special symbols: often Finland’s Swedes are left out and in this case Finland also uses the å, although only in the Swedish language.
    Cheers!

    Reply

Leave a Reply Cancel reply

Your email address will not be published. Required fields are marked *

This site uses Akismet to reduce spam. Learn how your comment data is processed.


Product Reviews · World Atlas · Settlers of Catan · Risk · Game of Thrones · Coloring Books
Globes · Monopoly · Star Wars · Game of Life · Pandemic · Ticket To Ride · Drinks Cabinets
US Locations · UK Locations· Fleet Management
Copyright © 2026 · Privacy Policy · Fair Use, Attribution & Copyright · Contact Us
Follow Us: Newsletter · Facebook · Youtube · Twitter · Threads · BlueSky · LinkedIn · Instagram · Pinterest · Flipboard