
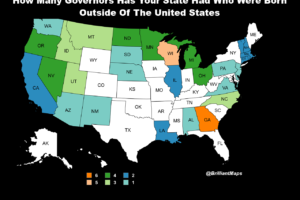
The map above provides a detailed geographic overview of income inequality across the Nordic Region, illustrating differences in both income levels and distribution patterns.
Some regional variations, such as border effects, are attributed to incomplete income data from neighboring countries.
The text explains a map that analyzes income inequality across the Nordic Region using two metrics: Household Disposable Income (HDI) and the Gini Index.
- HDI: Measures the capacity of households or individuals to afford goods and services. Comparing average HDIs helps identify inequality between municipalities.
- Gini Index: Measures income distribution within municipalities. A higher Gini Index indicates more unequal distribution.
By combining these metrics, the map categorizes municipalities into four types of income distribution, providing insights into both intra- and inter-municipality inequality across the region.
Four Categories of Municipalities
- Yellow (High income, High Inequality)
- Municipalities with HDI and Gini Index both above the Nordic average.
- Includes most wealthy municipalities, especially in capital regions:
- Stockholm (e.g., Danderyd, Täby)
- Copenhagen (e.g., Gentofte, Hørsholm)
- Helsinki (e.g., Kauniainen)
- Also includes some areas in southern Sweden and Denmark with slightly above-average HDIs.
- Blue (High income, Low Inequality)
- Municipalities with HDI above the Nordic average and Gini Index below the average.
- Primarily found in Norway, known for higher HDI and more equitable income distribution.
- Green (Lower income, Low Inequality)
- Municipalities with both HDI and Gini Index below the Nordic average.
- Predominantly rural areas in:
- Finland
- Northern Sweden
- Eastern Norway
- Red (Lower income, High Inequality)
- Municipalities with HDI below the Nordic average and Gini Index above the average.
- Found mainly in:
- Rural Sweden and Finland
- Lolland in Denmark
- Iceland (based on national statistics, though Icelandic data is not fully comparable to municipal averages).
Here are the countries wealth in GDP per capita from the IMF based on Purchasing Power Parity (PPP) Dollars which reflect differences in living costs along with income:
Note this was not one of the two measures used in the map above, but is makes a very simple comparisons between countries easier:
- Norway: $106,540
- United States: $89,680
- Denmark: $85,790
- Iceland: $80,320
- Sweden: $74,140
- Australia: $71,310
- Finland: $67,070
- Canada: $64,570
- United Kingdom: $64,340
- New Zealand: $54,040
- Greenland: No Data


Leave a Reply