Brilliant Maps

Making Sense Of The World, One Map At A Time

  • BOOK!
  • Newsletter
  • Games & Quizes
  • Map Based Polls
  • Map Tools

US States & Counties Ranked by GDP, GDP per Capita and Average Income

Click To Get My 10 Best Brilliant Maps For Free:

Which US states and counties produce the most, and where are incomes highest? The tables below rank all 50 states plus the District of Columbia, and every county-level area, by GDP, GDP per capita and average income, using the Bureau of Economic Analysis 2024 figures. Average income here means per capita personal income: total personal income divided by population. Click any column heading to sort. Below the tables you will find a map for every state showing its richest and poorest county by per capita income.
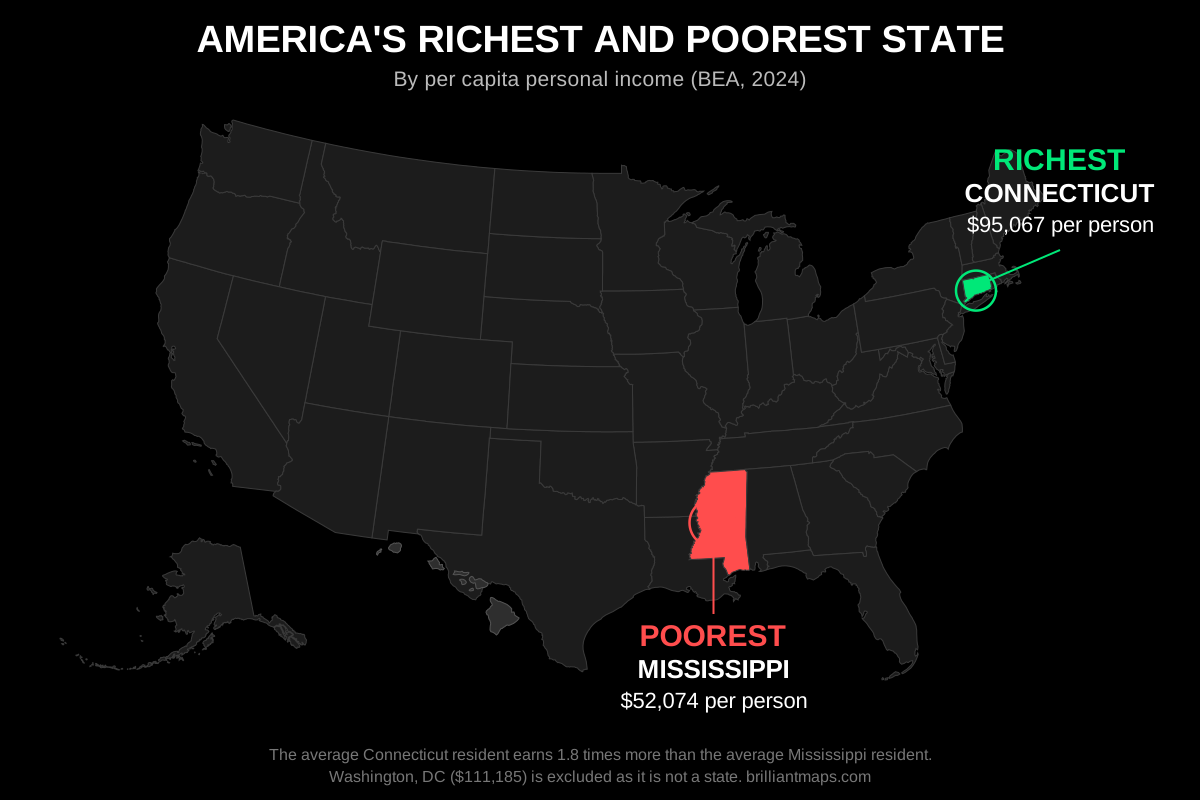
Map of the United States highlighting the richest and poorest state by per capita personal income

All 50 States Ranked by GDP, GDP per Capita and Average Income

GDP is in millions of current dollars. GDP per capita is state GDP divided by population. Average income is per capita personal income. All figures are BEA 2024. The District of Columbia is included for reference.

#StateGDP ($ million)GDP per CapitaAverage Income

All US Counties Ranked by GDP, GDP per Capita and Average Income

The BEA publishes economic data for 3,115 county-level areas. In Virginia it combines 29 small independent cities with their surrounding counties, and in Hawaii it combines Kalawao with Maui, so those appear as combined areas. Use the search box to filter by county or state name.

#CountyStateGDP ($ million)GDP per CapitaAverage Income

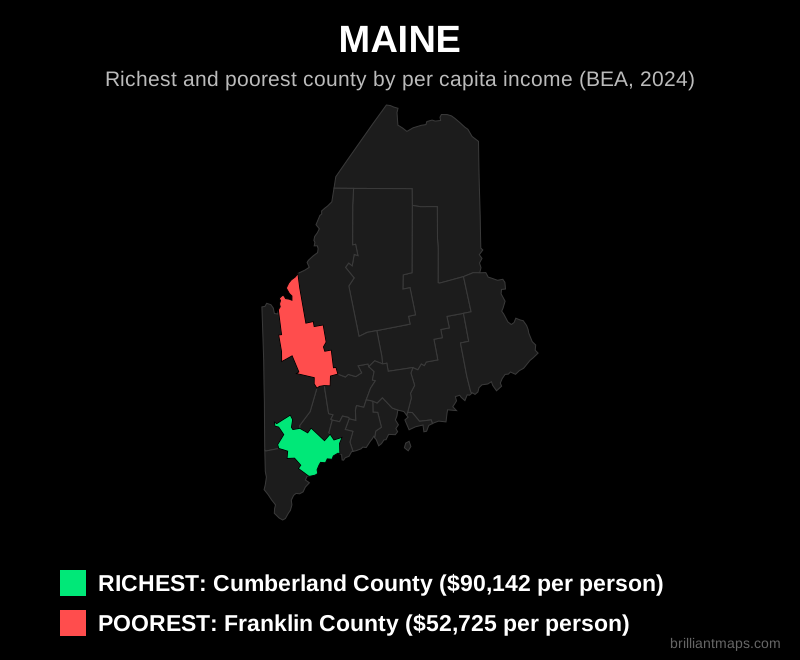
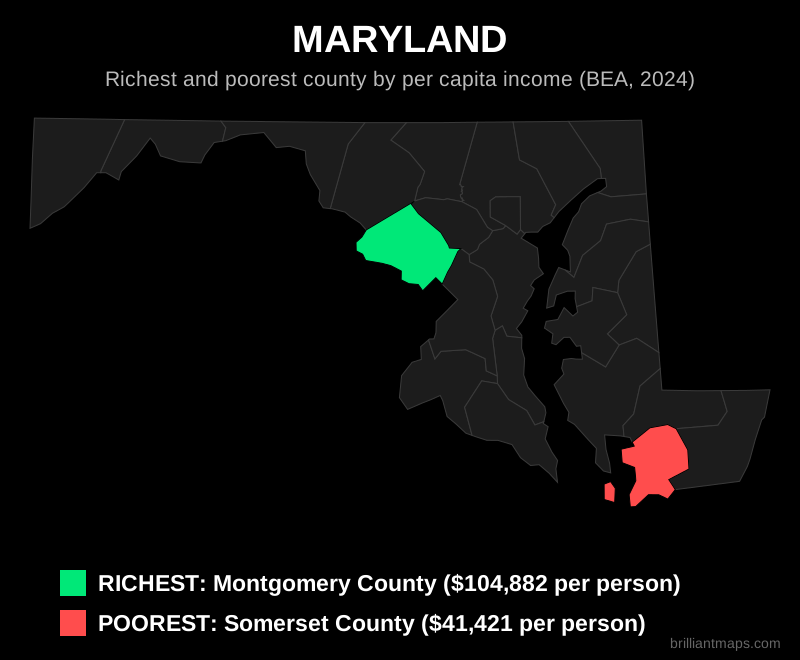
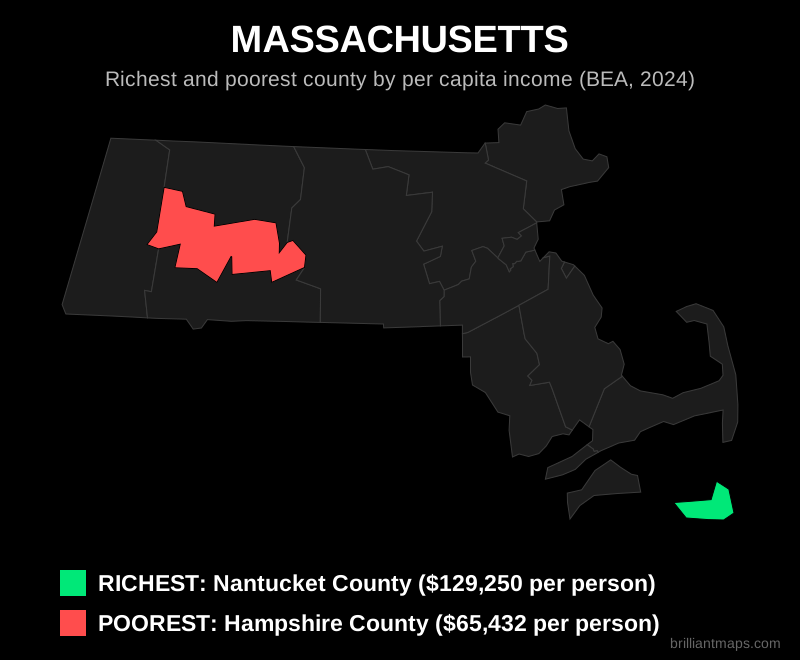
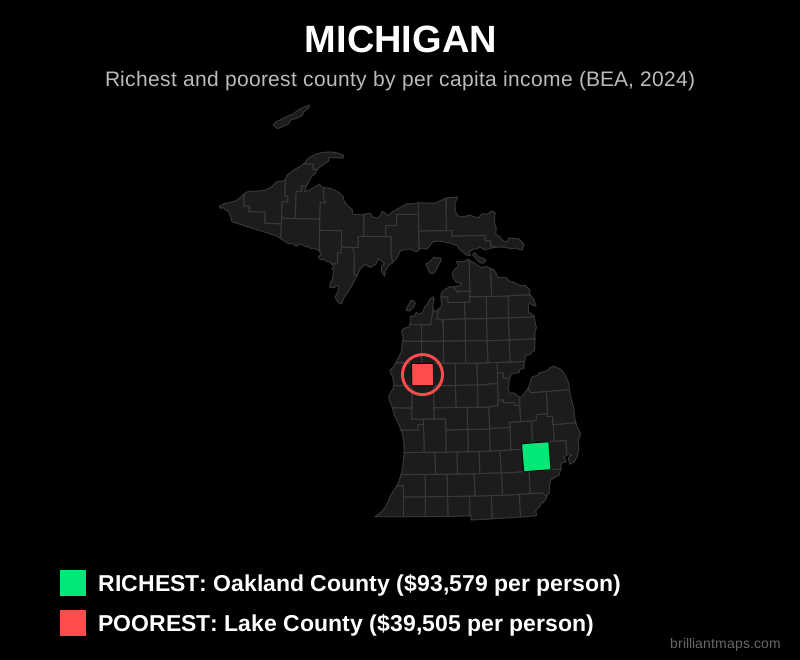
The Richest and Poorest County in Every State

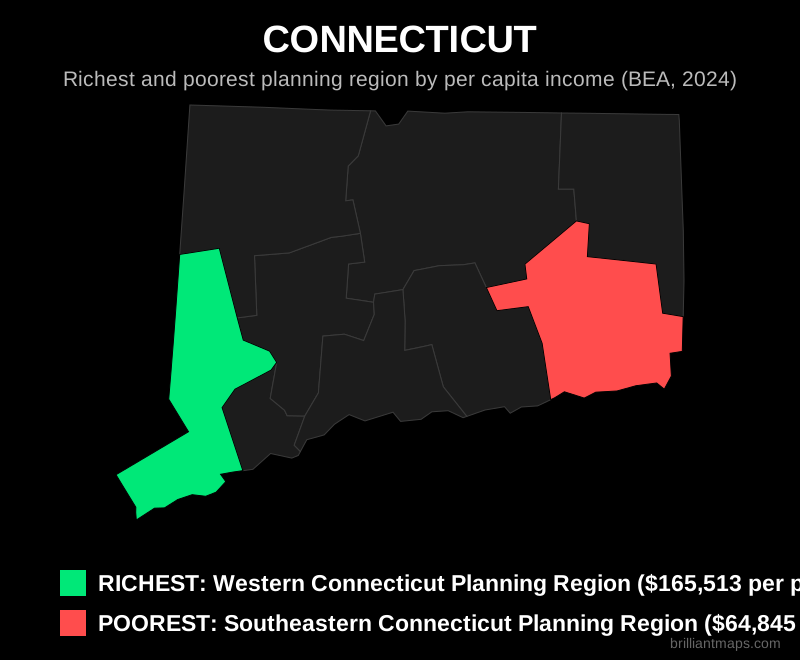
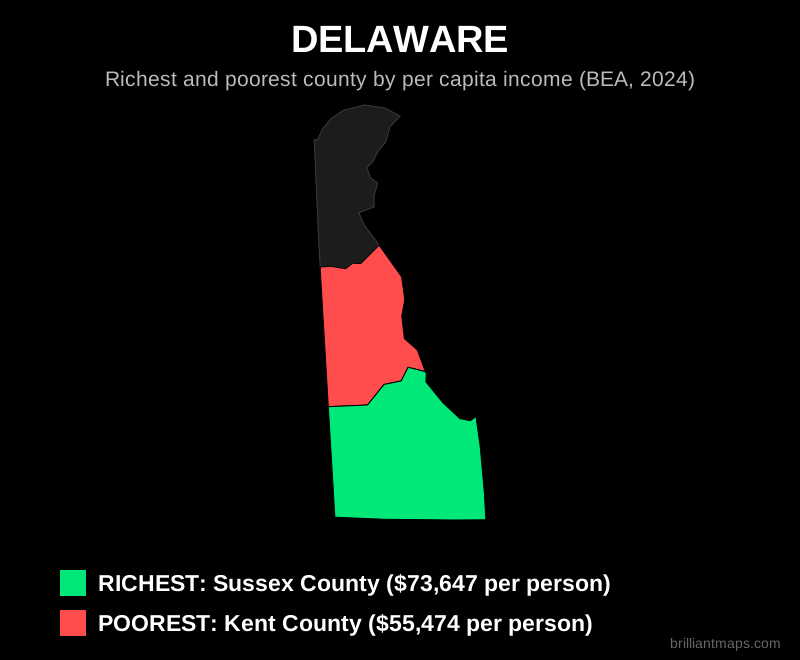
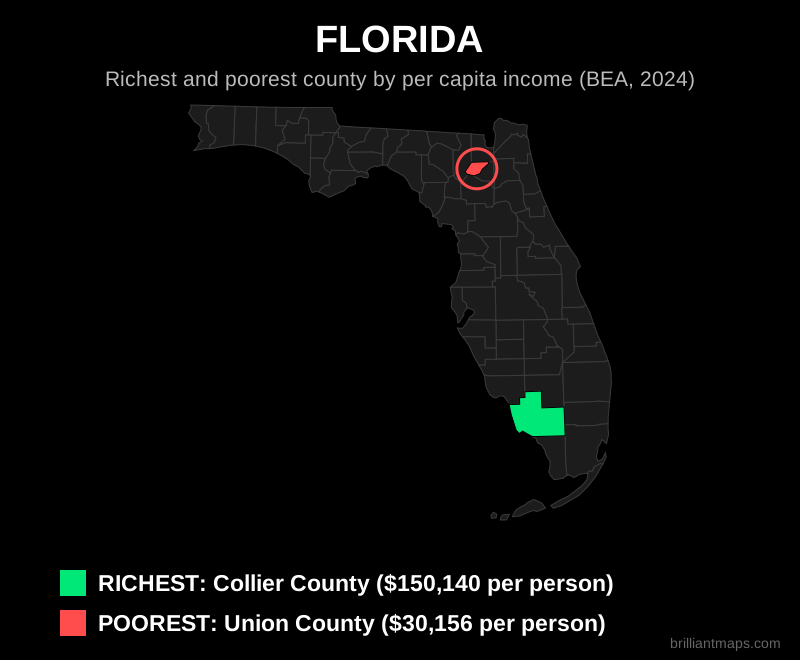
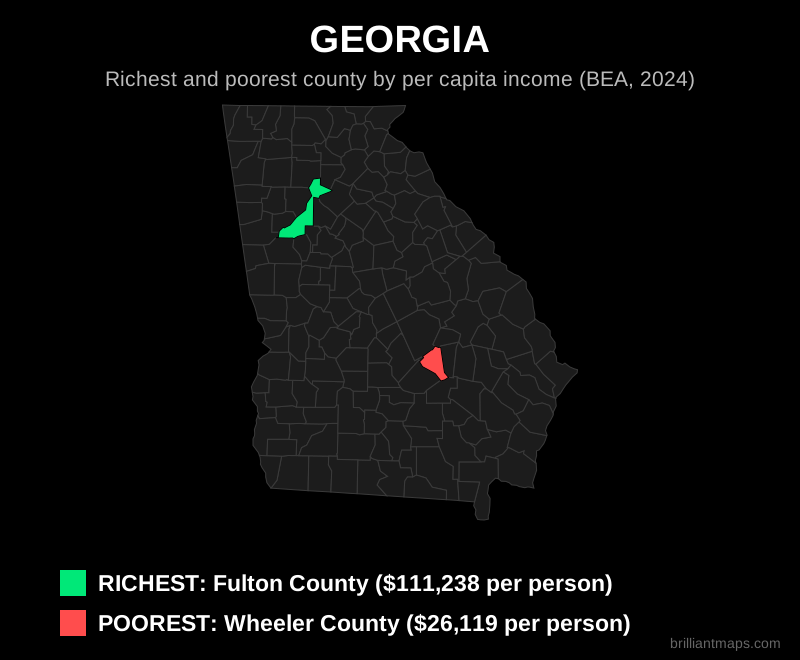
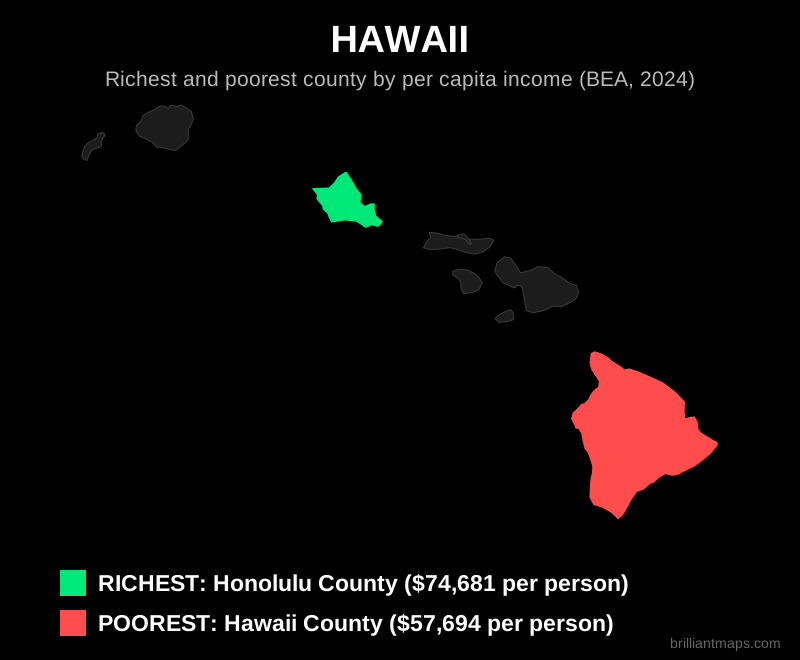
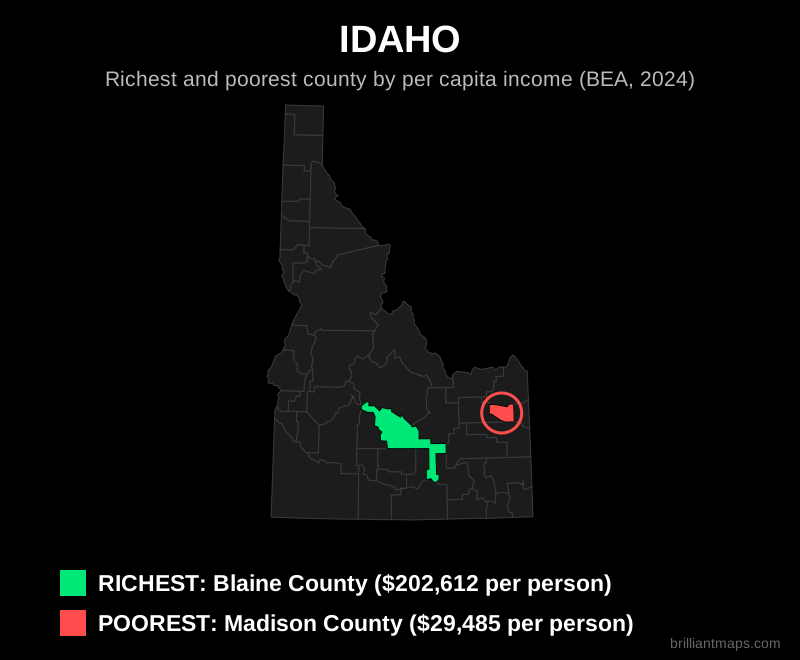
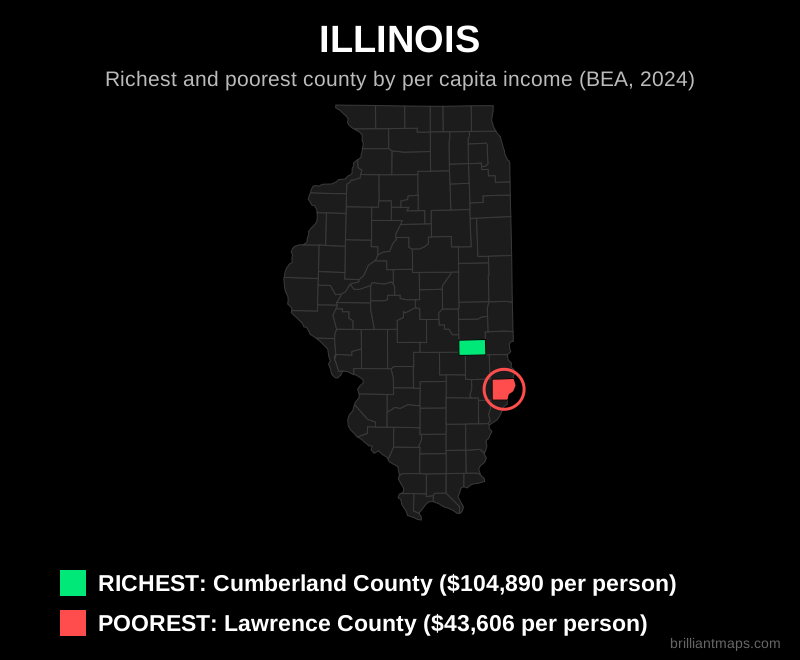
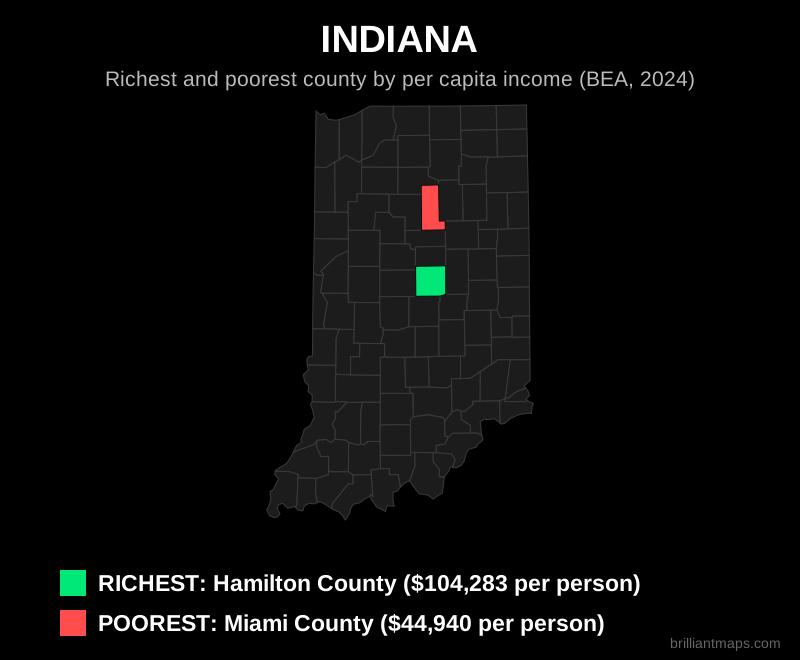
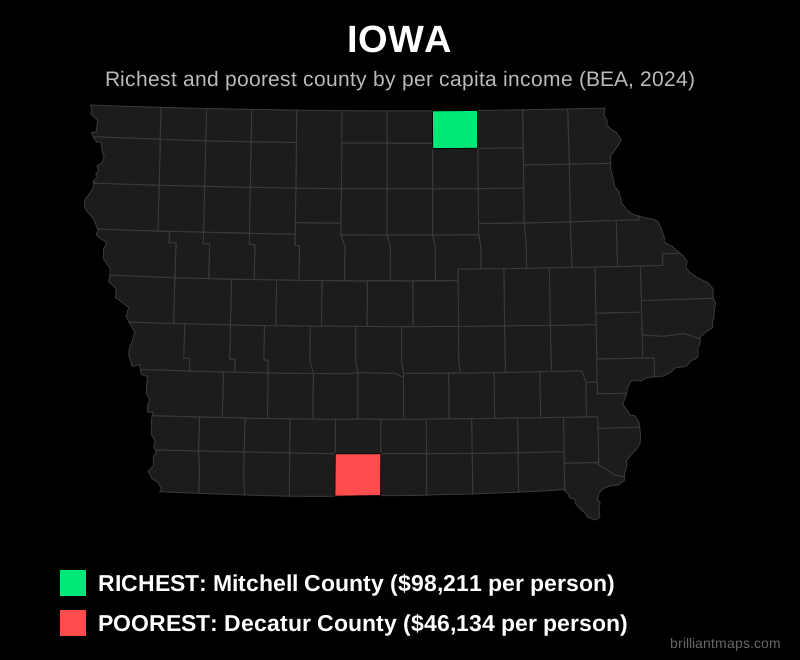
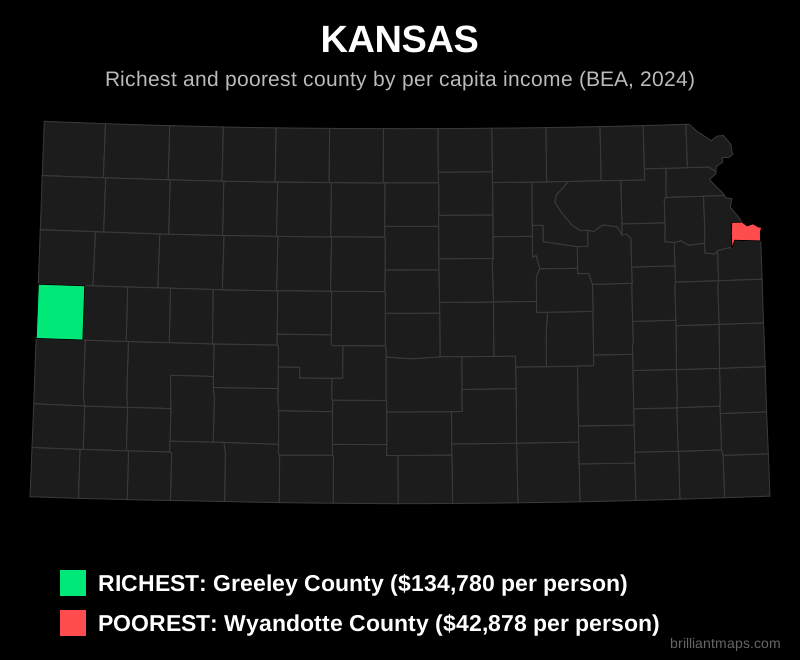
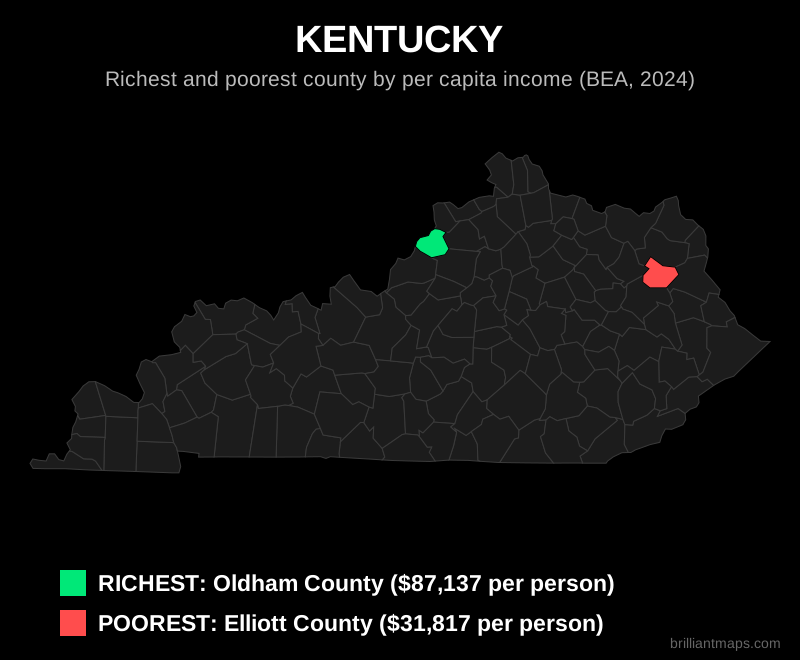
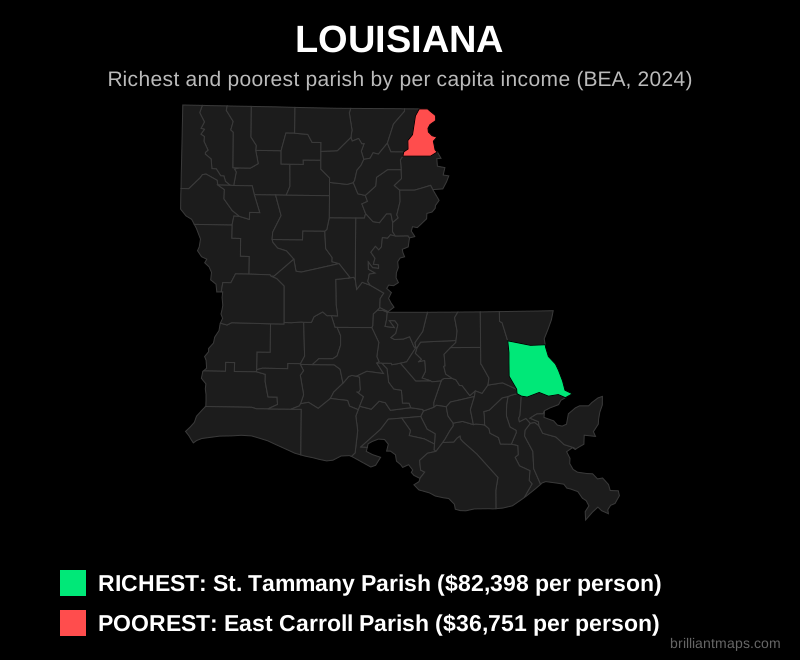
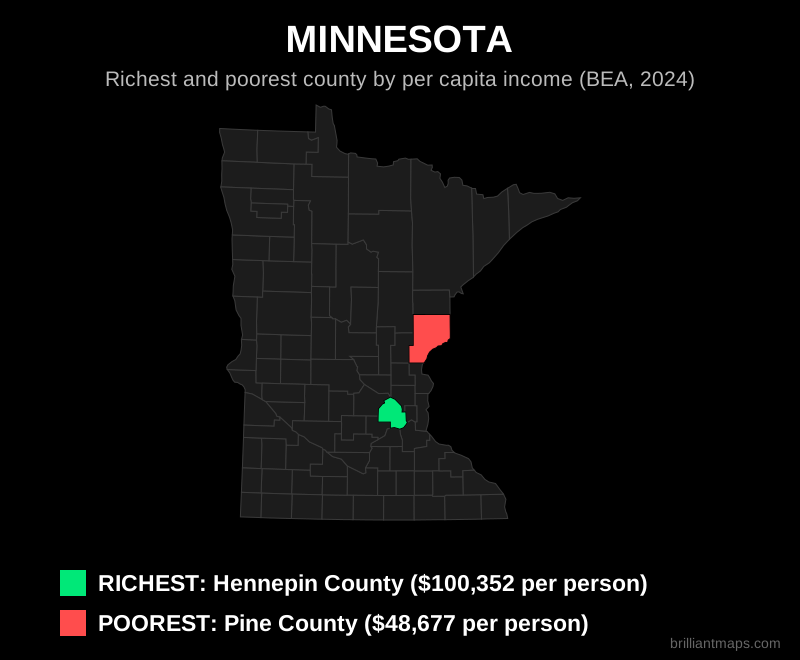
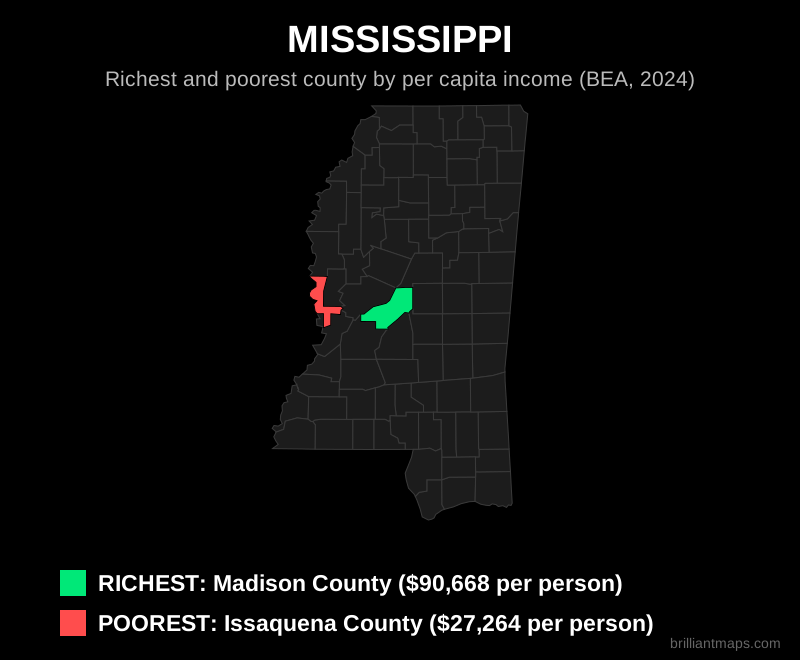
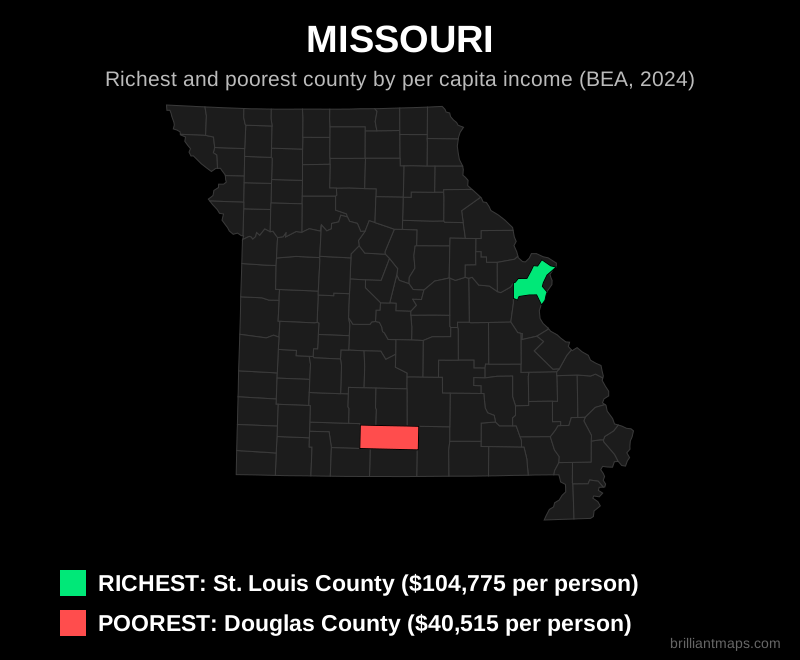
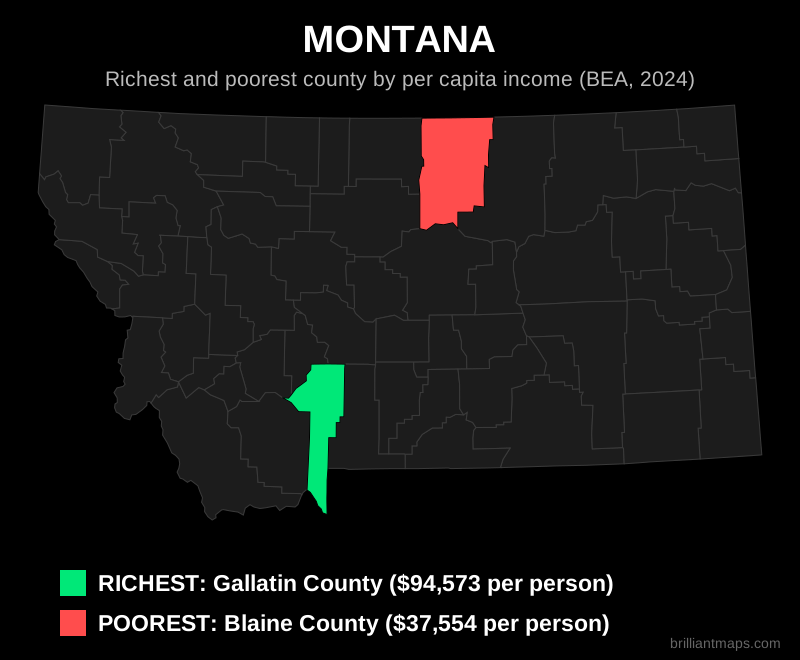
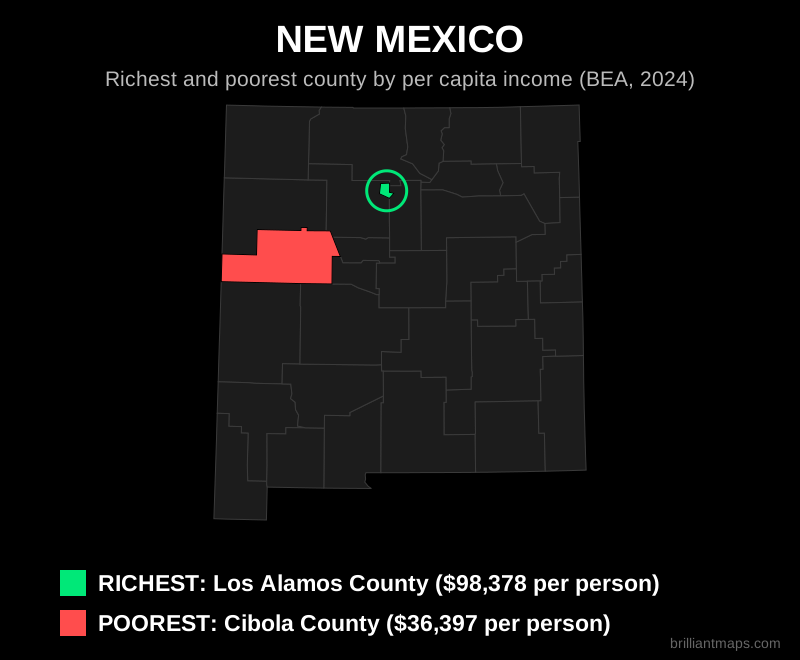
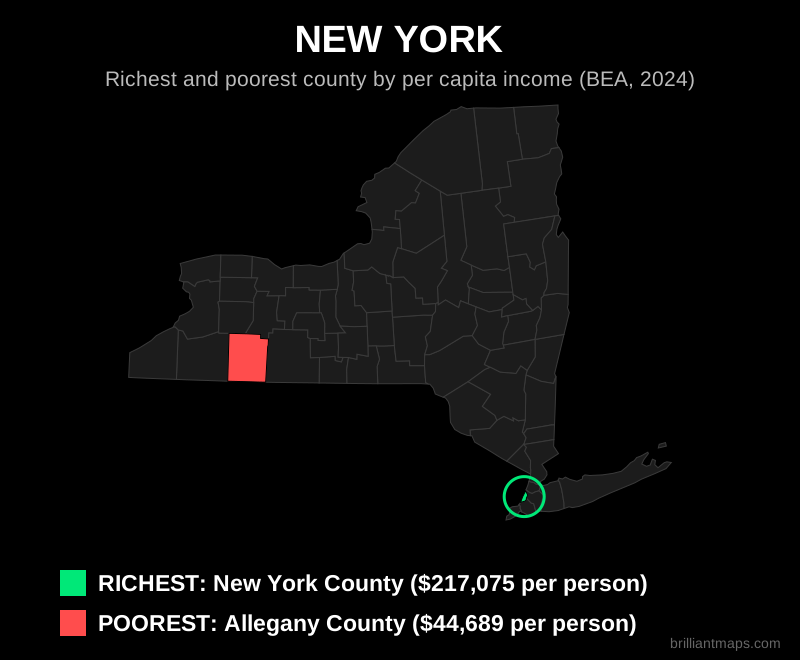
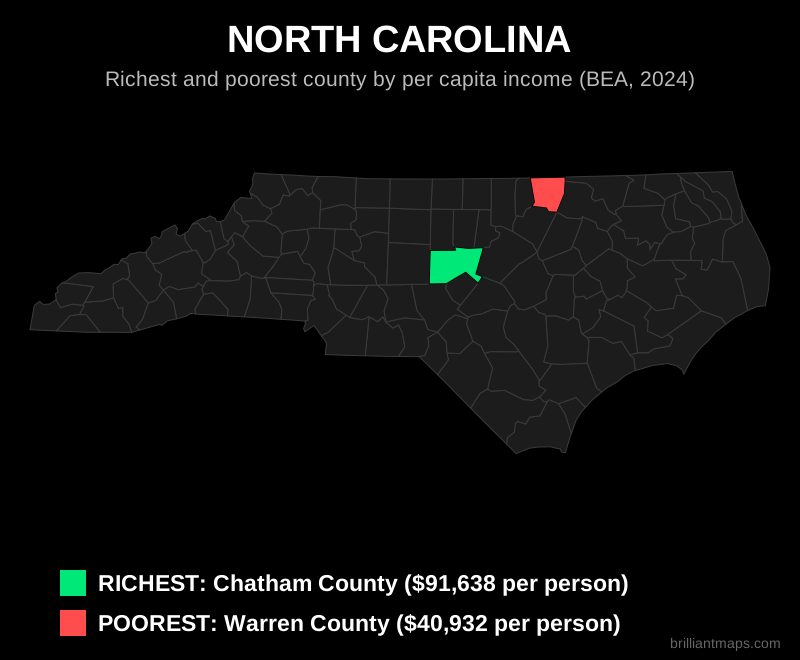
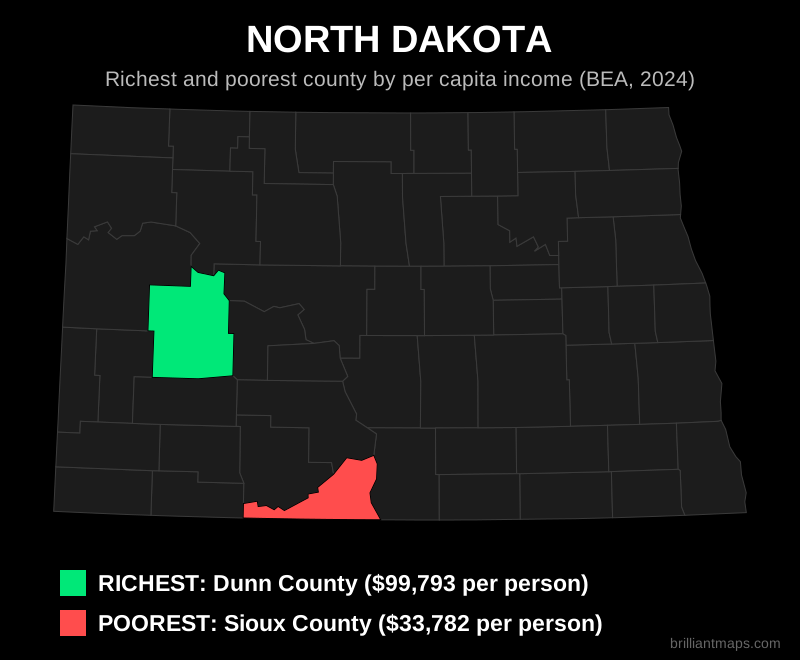
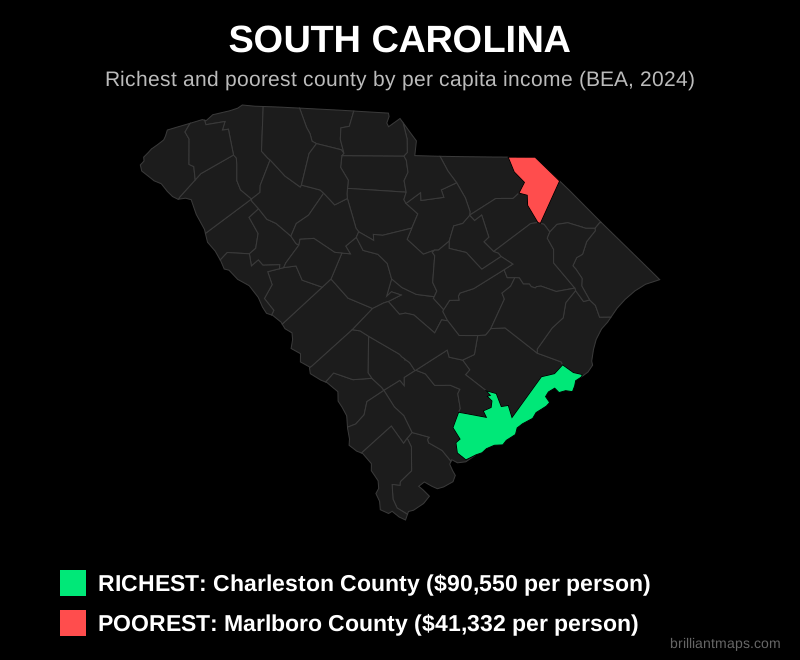
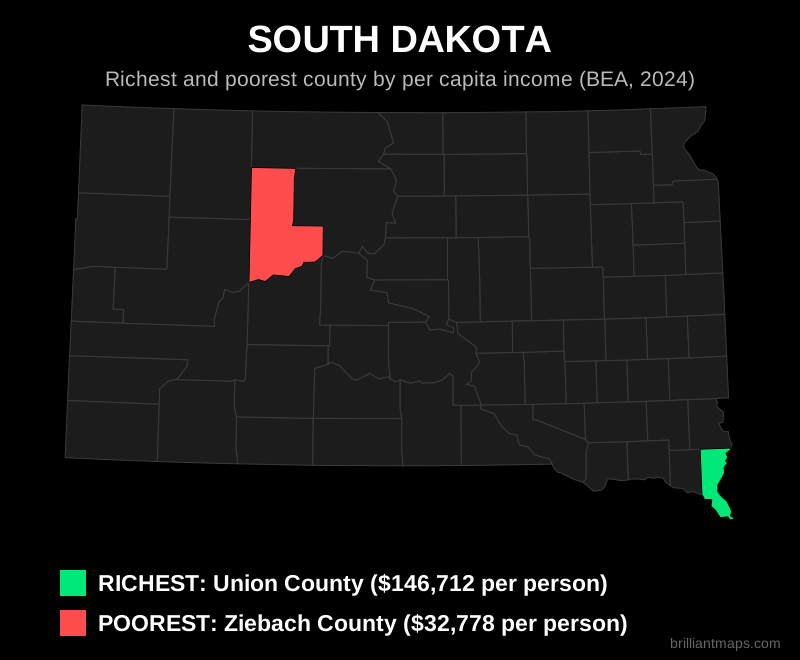
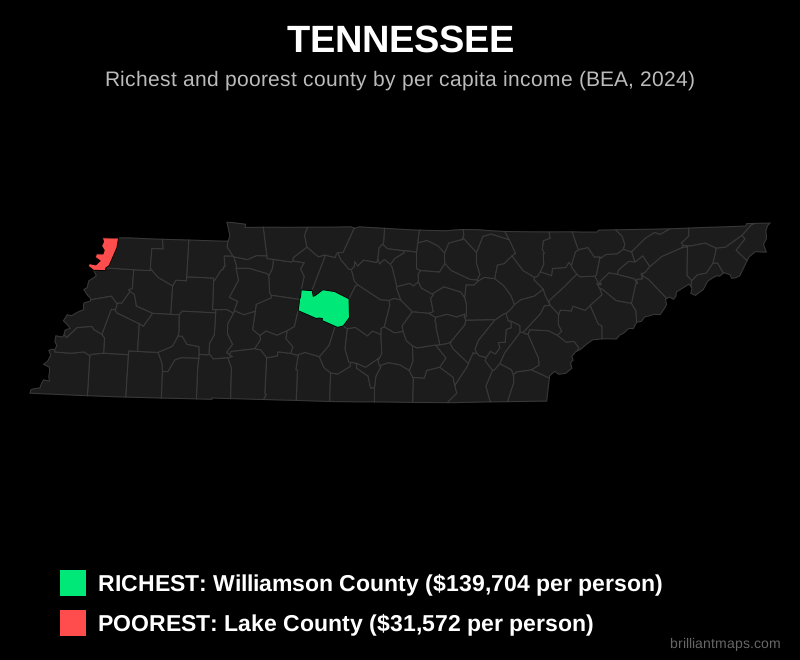
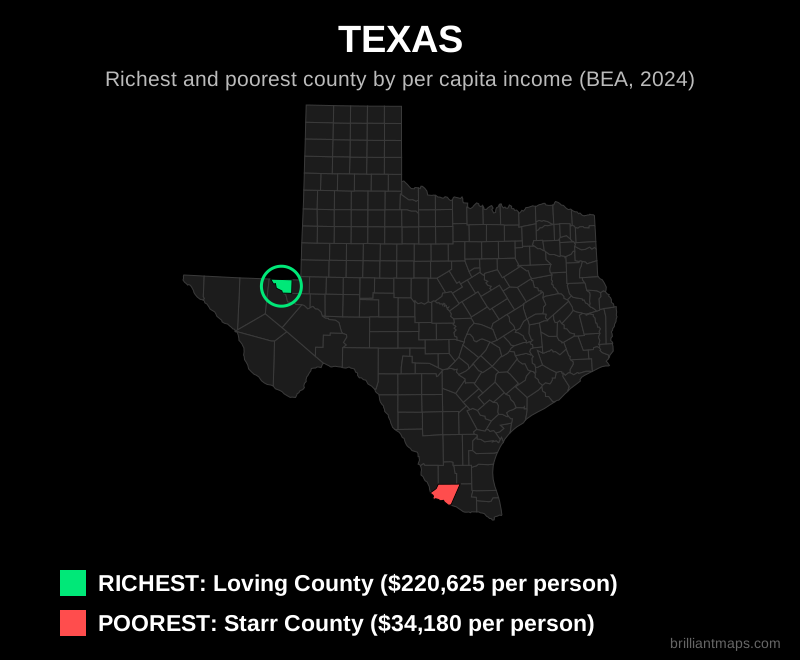
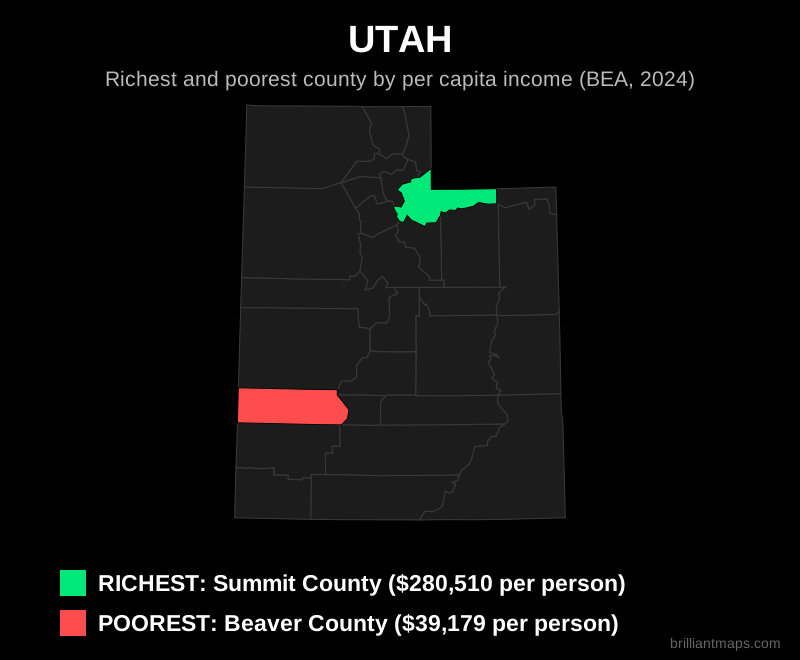
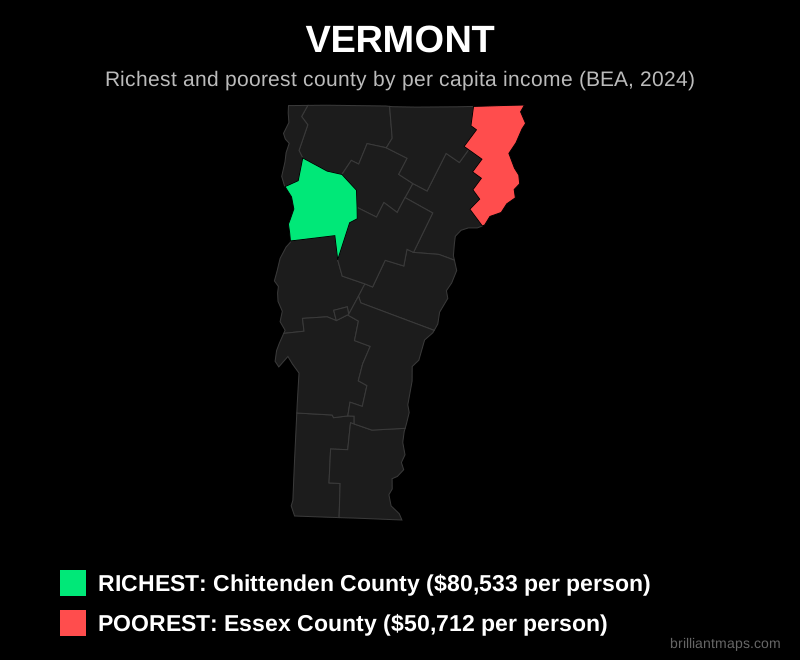
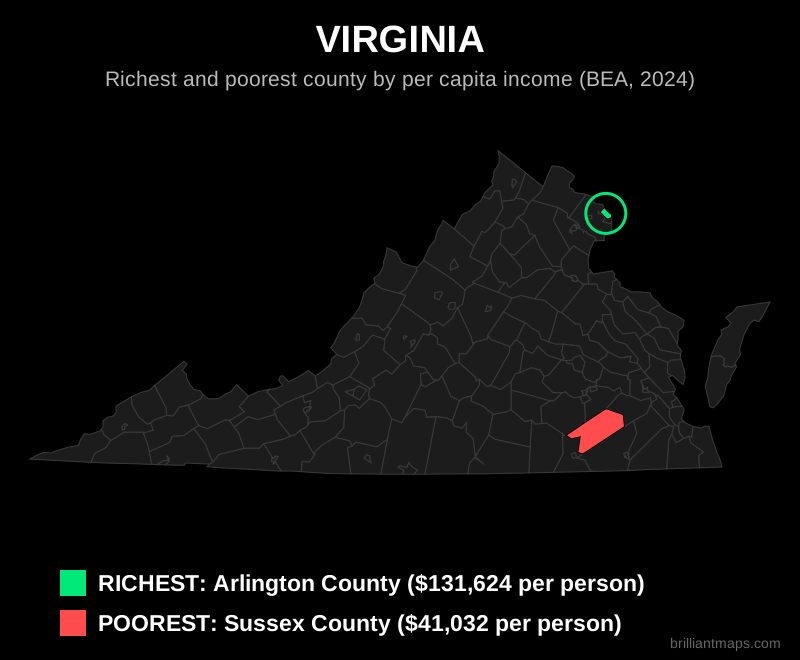
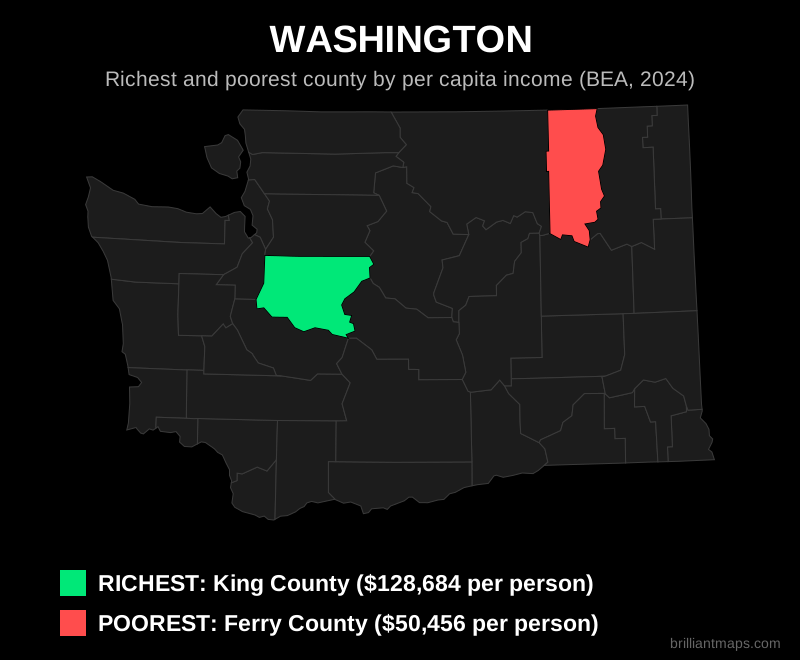
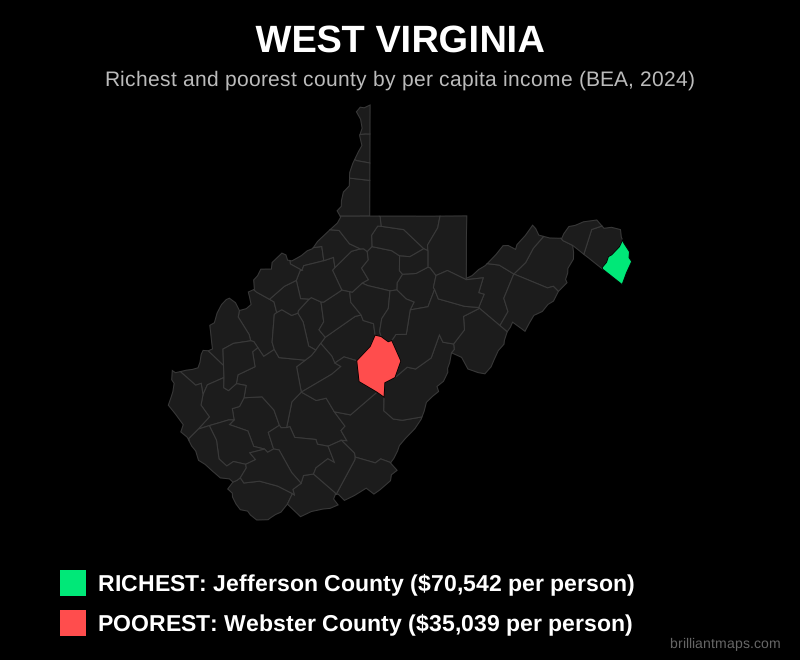
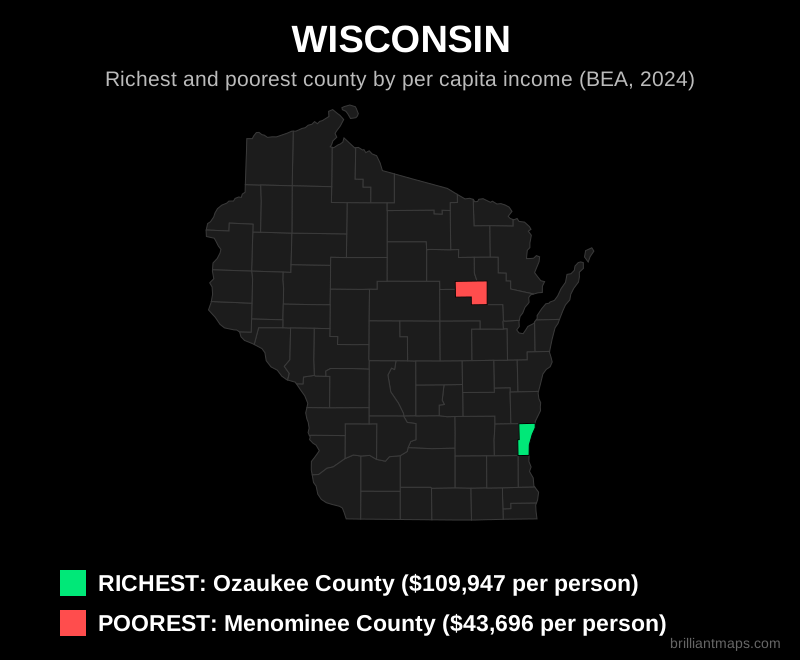
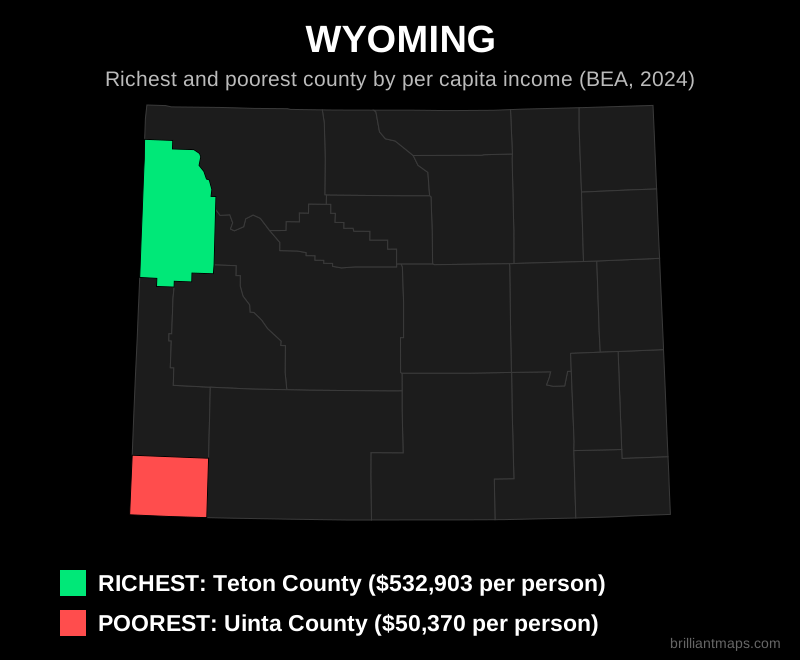
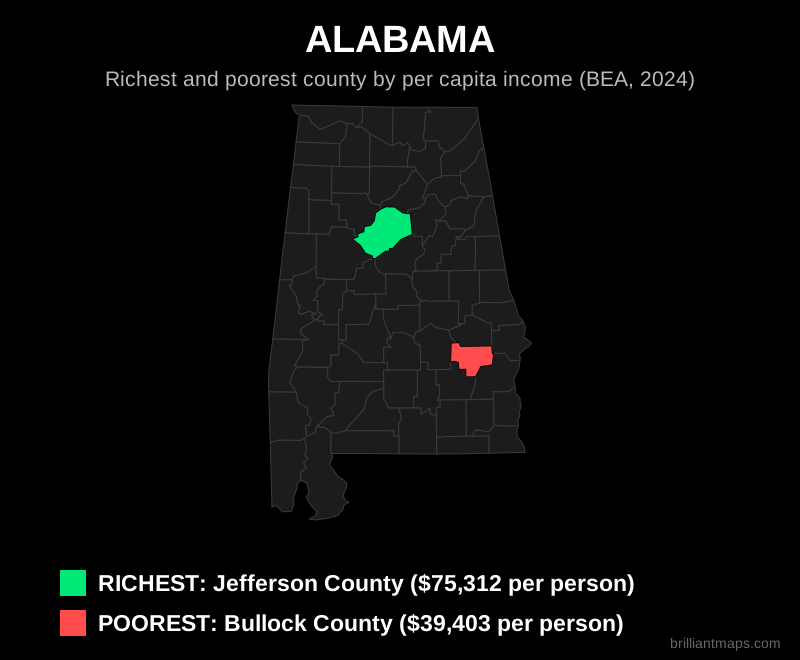
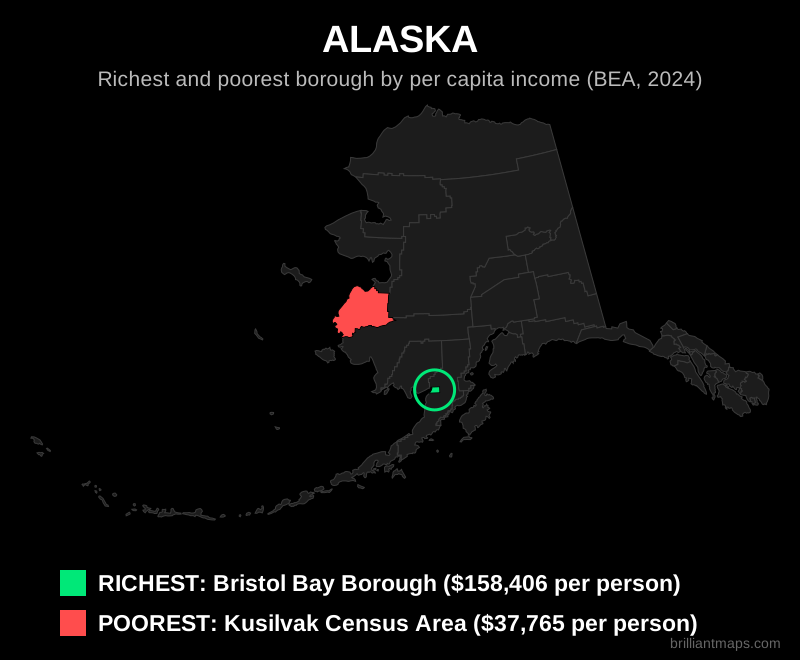
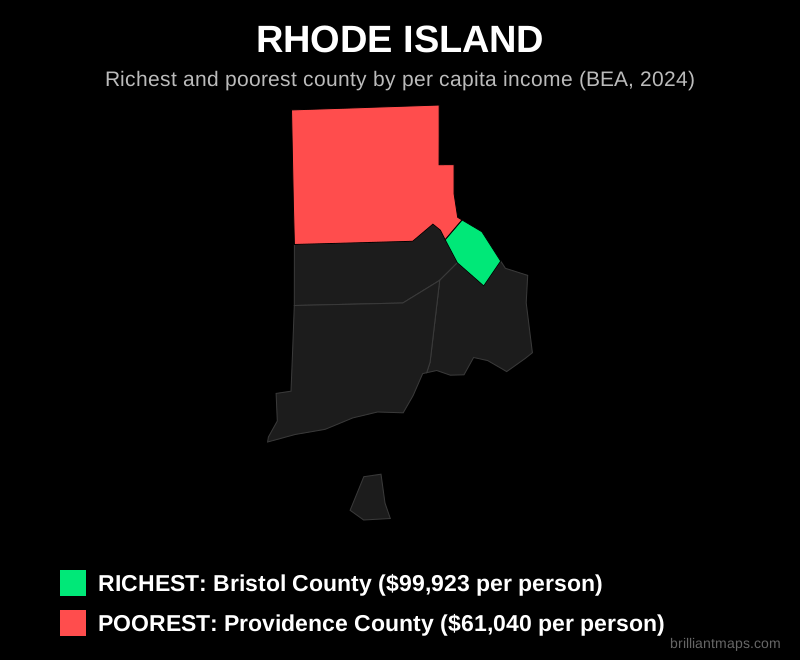
One map for each state: the richest and poorest county (parish in Louisiana, borough in Alaska, planning region in Connecticut) by per capita personal income, with the amount shown. The richest is in green and the poorest in red. Very small counties are circled so they are easy to spot. The District of Columbia is a single county equivalent, so it has no map.
ALAKAZARCACOCTDEFLGAHIIDILINIAKSKYLAMEMDMAMIMNMSMOMTNENVNHNJNMNYNCNDOHOKORPARISCSDTNTXUTVTVAWAWVWIWY

Alabama

Richest and poorest county in Alabama by per capita income

Back to top

Alaska

Richest and poorest county in Alaska by per capita income

Back to top

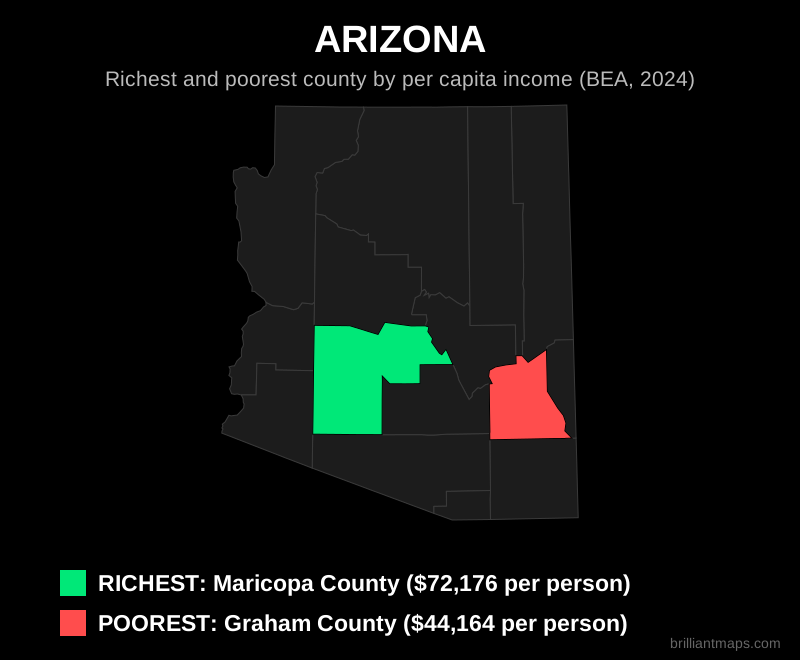
Arizona

Richest and poorest county in Arizona by per capita income

Back to top

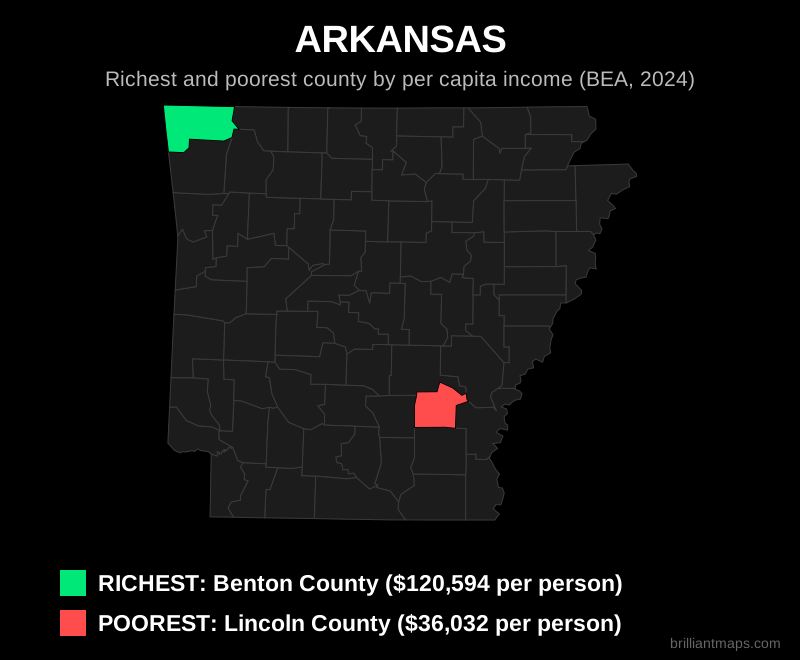
Arkansas

Richest and poorest county in Arkansas by per capita income

Back to top

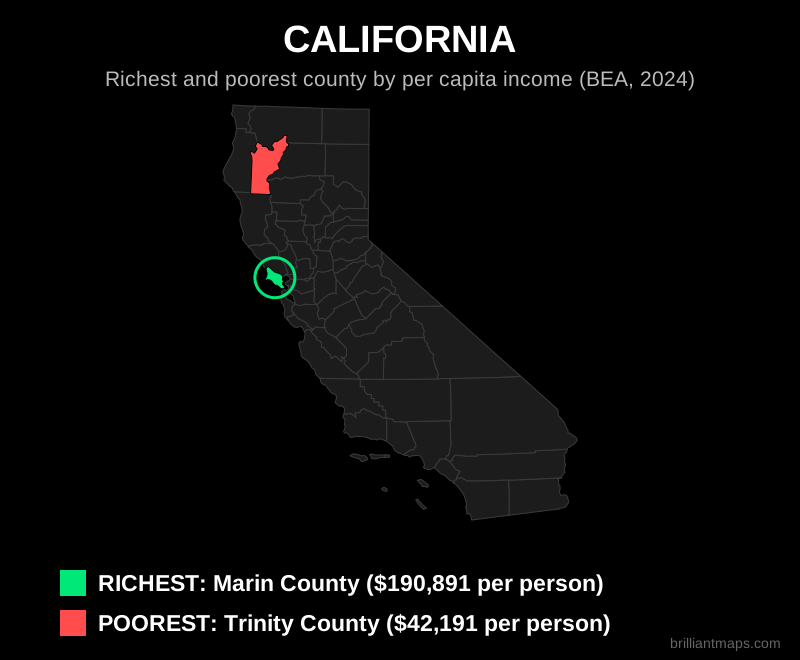
California

Richest and poorest county in California by per capita income

Back to top

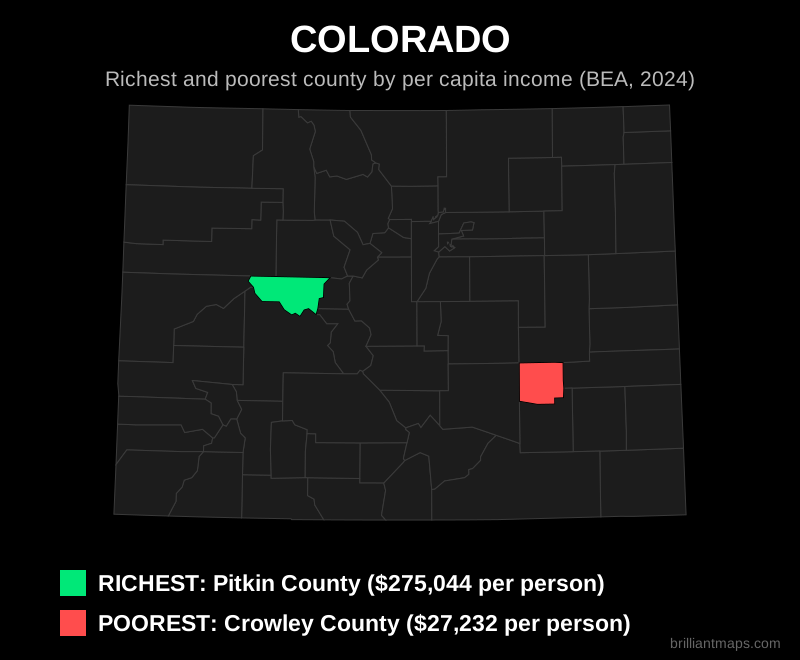
Colorado

Richest and poorest county in Colorado by per capita income

Back to top

Connecticut

Richest and poorest county in Connecticut by per capita income

Back to top

Delaware

Richest and poorest county in Delaware by per capita income

Back to top

Florida

Richest and poorest county in Florida by per capita income

Back to top

Georgia

Richest and poorest county in Georgia by per capita income

Back to top

Hawaii

Richest and poorest county in Hawaii by per capita income

Back to top

Idaho

Richest and poorest county in Idaho by per capita income

Back to top

Illinois

Richest and poorest county in Illinois by per capita income

Back to top

Indiana

Richest and poorest county in Indiana by per capita income

Back to top

Iowa

Richest and poorest county in Iowa by per capita income

Back to top

Kansas

Richest and poorest county in Kansas by per capita income

Back to top

Kentucky

Richest and poorest county in Kentucky by per capita income

Back to top

Louisiana

Richest and poorest county in Louisiana by per capita income

Back to top

Maine

Richest and poorest county in Maine by per capita income

Back to top

Maryland

Richest and poorest county in Maryland by per capita income

Back to top

Massachusetts

Richest and poorest county in Massachusetts by per capita income

Back to top

Michigan

Richest and poorest county in Michigan by per capita income

Back to top

Minnesota

Richest and poorest county in Minnesota by per capita income

Back to top

Mississippi

Richest and poorest county in Mississippi by per capita income

Back to top

Missouri

Richest and poorest county in Missouri by per capita income

Back to top

Montana

Richest and poorest county in Montana by per capita income

Back to top

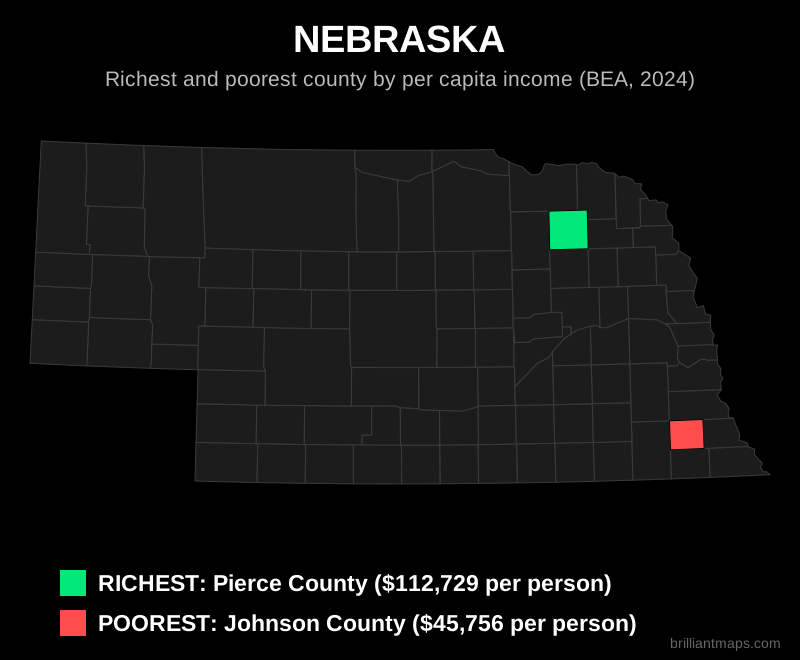
Nebraska

Richest and poorest county in Nebraska by per capita income

Back to top

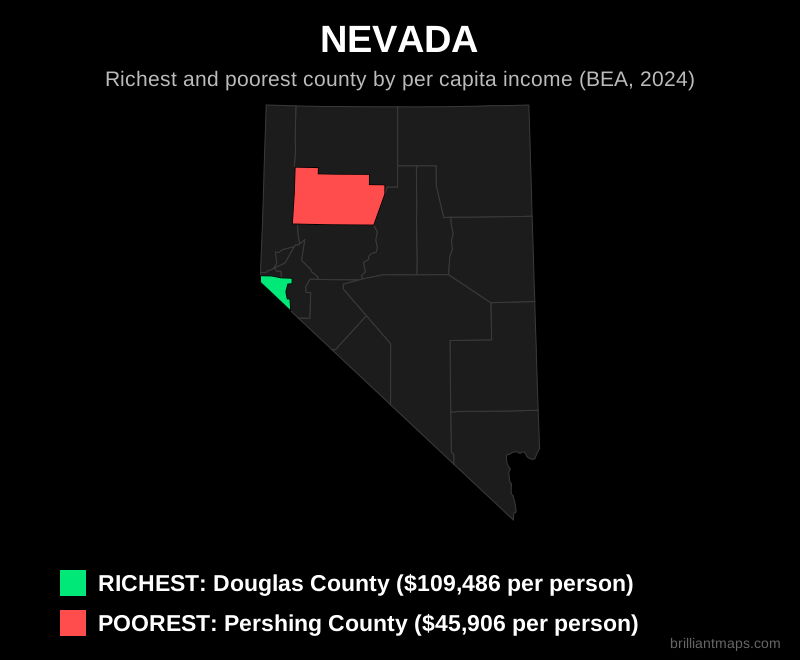
Nevada

Richest and poorest county in Nevada by per capita income

Back to top

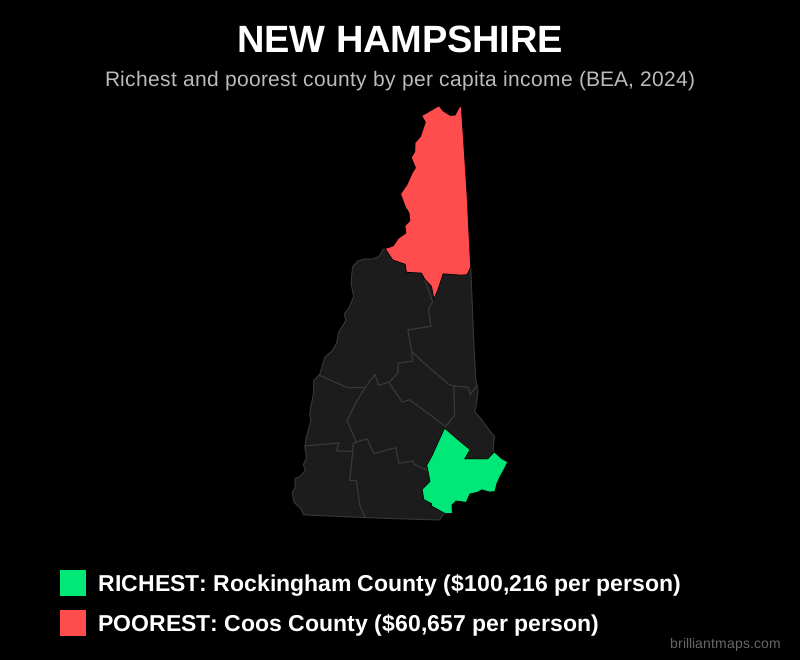
New Hampshire

Richest and poorest county in New Hampshire by per capita income

Back to top

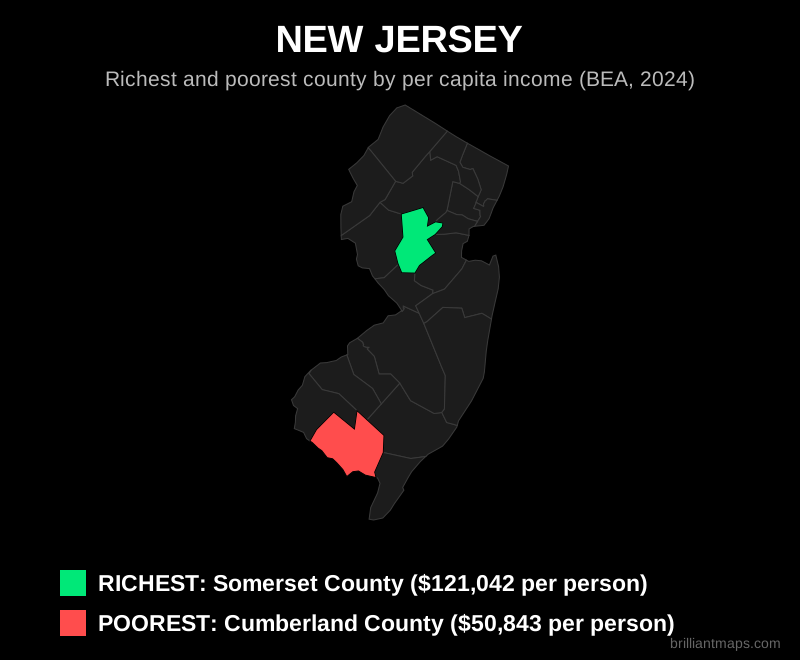
New Jersey

Richest and poorest county in New Jersey by per capita income

Back to top

New Mexico

Richest and poorest county in New Mexico by per capita income

Back to top

New York

Richest and poorest county in New York by per capita income

Back to top

North Carolina

Richest and poorest county in North Carolina by per capita income

Back to top

North Dakota

Richest and poorest county in North Dakota by per capita income

Back to top

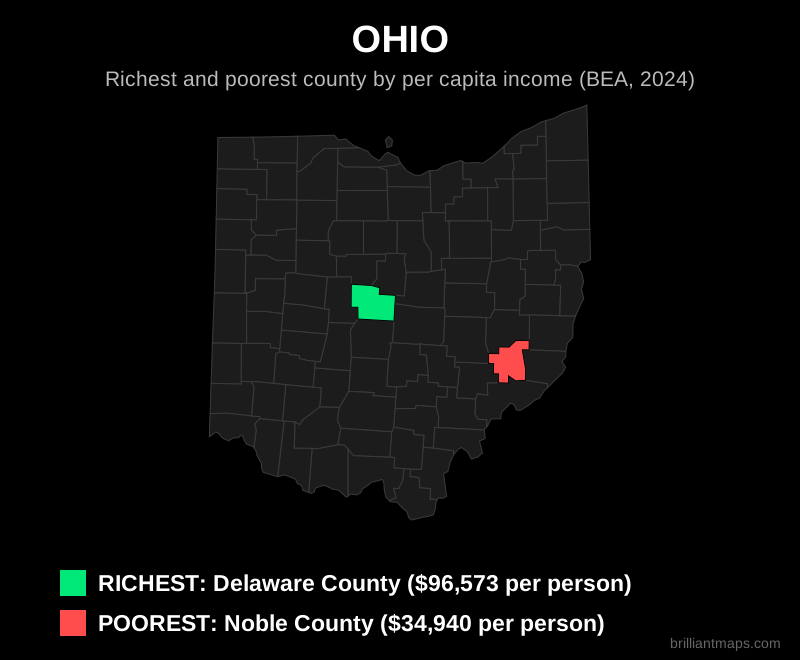
Ohio

Richest and poorest county in Ohio by per capita income

Back to top

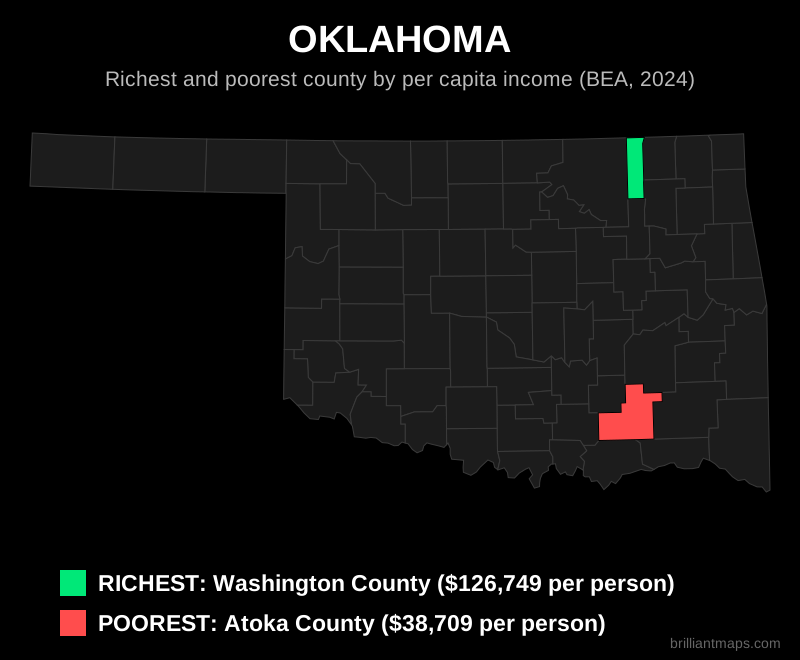
Oklahoma

Richest and poorest county in Oklahoma by per capita income

Back to top

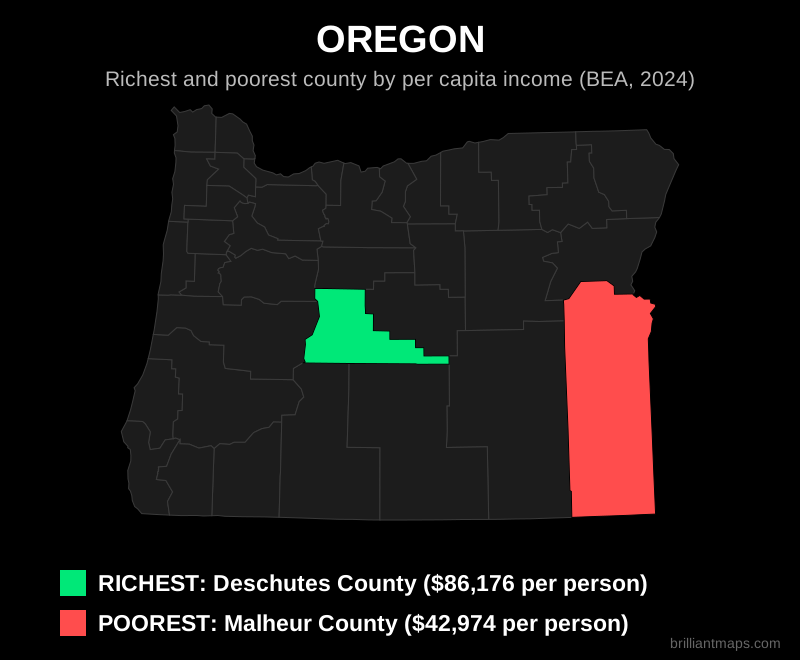
Oregon

Richest and poorest county in Oregon by per capita income

Back to top

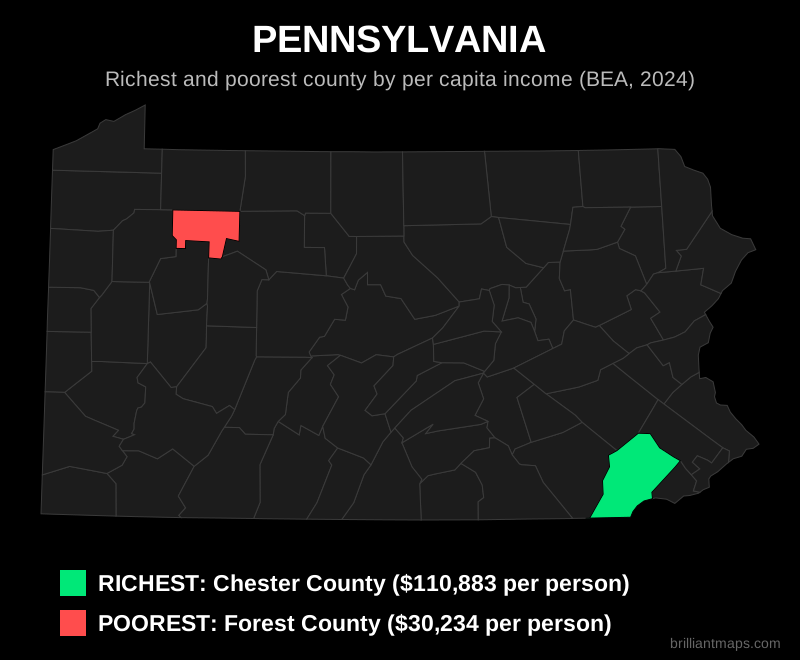
Pennsylvania

Richest and poorest county in Pennsylvania by per capita income

Back to top

Rhode Island

Richest and poorest county in Rhode Island by per capita income

Back to top

South Carolina

Richest and poorest county in South Carolina by per capita income

Back to top

South Dakota

Richest and poorest county in South Dakota by per capita income

Back to top

Tennessee

Richest and poorest county in Tennessee by per capita income

Back to top

Texas

Richest and poorest county in Texas by per capita income

Back to top

Utah

Richest and poorest county in Utah by per capita income

Back to top

Vermont

Richest and poorest county in Vermont by per capita income

Back to top

Virginia

Richest and poorest county in Virginia by per capita income

Back to top

Washington

Richest and poorest county in Washington by per capita income

Back to top

West Virginia

Richest and poorest county in West Virginia by per capita income

Back to top

Wisconsin

Richest and poorest county in Wisconsin by per capita income

Back to top

Wyoming

Richest and poorest county in Wyoming by per capita income

Back to top

Data Sources and Notes

GDP figures come from the Bureau of Economic Analysis GDP by County and GDP by State tables (current dollars, 2024). Income and population figures come from the BEA Personal Income by County tables (CAINC1, 2024). GDP per capita is calculated as GDP divided by BEA mid-year population. Average income is BEA per capita personal income, which includes wages, investment income and government benefits. Connecticut figures use the nine planning regions that replaced its counties. This page is for general reference and educational purposes.

Product Reviews · World Atlas · Map Posters · Settlers of Catan · Risk · Game of Thrones · Coloring Books · Globes · Monopoly · Star Wars · Game of Life · Pandemic · Ticket To Ride · Drinks Cabinets
Size Comparisons · US Locations · Flight Maps · Fleet Management
Copyright © 2026 · Privacy Policy · Fair Use, Attribution & Copyright · Contact Us
Follow Us: Newsletter · Facebook · Youtube · Twitter · Threads · BlueSky · LinkedIn · Instagram · Pinterest · Flipboard