The map above shows Tennessee and New South Wales side by side at exactly the same scale, using equal-area projections, so their true relative sizes are preserved.
Tennessee vs New South Wales Geography
Land area
- Tennessee has a land area of 41,224 square miles (106,770 km²), while New South Wales has 309,130 square miles (800,642 km²).
- New South Wales' land area is 7.5 times (650%) larger than Tennessee's.
Total area
- Tennessee: 42,130 square miles (109,116 km²) vs New South Wales: 309,130 square miles (800,642 km²), including inland and coastal water.
- New South Wales' total area is 7.3 times (634%) larger than Tennessee's.
Length
- Tennessee is 191 miles (308 km) long from north to south; New South Wales is 678 miles (1,092 km).
- New South Wales' north-south length is 3.5 times (255%) longer than Tennessee's.
Width
- Tennessee spans 497 miles (800 km) east to west; New South Wales spans 831 miles (1,338 km).
- New South Wales' east-west width is 1.7 times (67%) wider than Tennessee's.
Highest point
- Tennessee's highest point is Clingmans Dome at 6,624 feet (2,019 m); New South Wales's is Mount Kosciuszko at 7,310 feet (2,228 m).
- Mount Kosciuszko is 686 feet higher than Clingmans Dome.
Lowest point
- Tennessee's lowest point is Mississippi River at 178 feet; New South Wales's is Pacific Ocean at 0 feet.
- New South Wales's lowest point is 178 feet lower.
Tennessee vs New South Wales Population and History
Population
- Tennessee has a population of 7,227,750 (2024), while New South Wales has 8,624,534 (2025).
- New South Wales' population is 1.2 times (19%) larger than Tennessee's.
Population density
- Tennessee: 175.3 people per square mile vs New South Wales: 27.9.
- Tennessee's population density is 6.3 times (528%) higher than New South Wales'.
Largest metro area
- Tennessee's largest metropolitan area is Nashville-Davidson--Murfreesboro--Franklin, TN metro area (2,150,553 people) vs New South Wales's Greater Sydney (5,638,830).
- Greater Sydney's population is 2.6 times (162%) larger than Nashville-Davidson--Murfreesboro--Franklin, TN metro area's.
History
- Tennessee: Admitted to the Union on June 1, 1796, as the 16th state.
- New South Wales: Became an Australian state at Federation on January 1, 1901; founded as a colony in 1788.
- In its current form, Tennessee is the older of the two by 105 years.
Tennessee vs New South Wales Economy
GDP
- Tennessee's GDP is $561.2 billion (2024) vs New South Wales's $547.1 billion.
- Tennessee and New South Wales have about the same economic output.
GDP per capita
- Tennessee: $77,645 per person vs New South Wales: $63,435.
- Tennessee's GDP per capita is 1.2 times (22%) higher than New South Wales'.
Official Websites
Tennessee official website · New South Wales official website
Download the Tennessee vs New South Wales Size Comparison Map for free
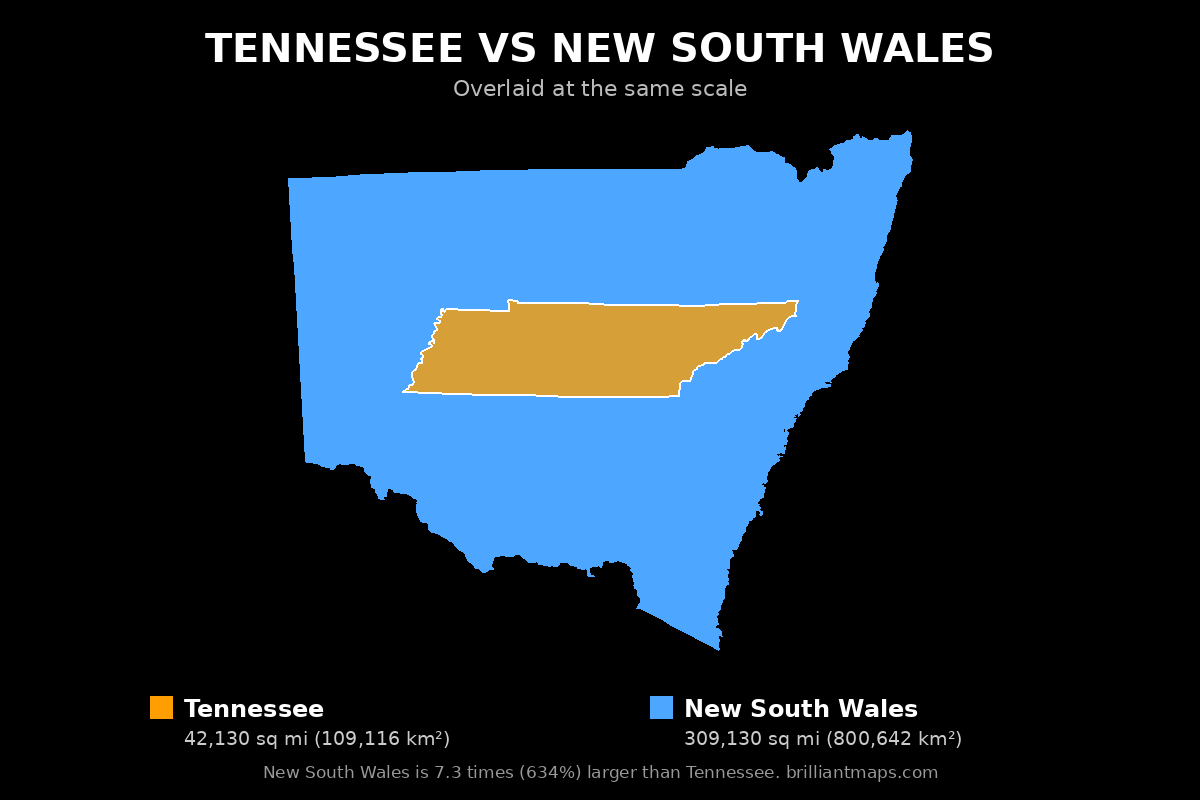
To download the map, right-click the image above (or press and hold on a phone or tablet) and choose Save image as. The map is free to use anywhere, including on your own website or in print, as long as you credit it with a link back to this page or to BrilliantMaps.com.
More Size Comparisons
All Tennessee size comparisons · All New South Wales size comparisons
Area, elevation and boundary figures come from official national statistics and US Census Bureau and Natural Earth boundary data; US state population, economic, county and tax figures come from the US Census Bureau, the Bureau of Economic Analysis and the Tax Foundation. Figures are rounded and for general reference.