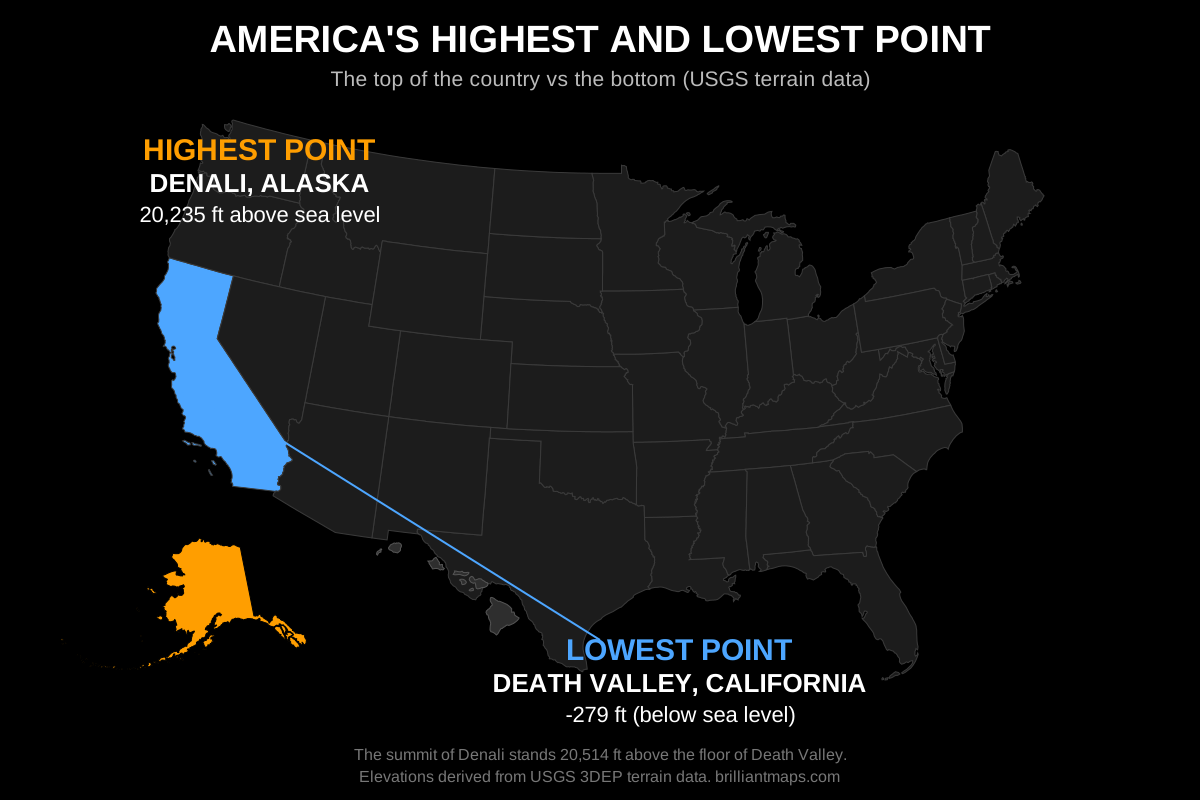
From the summit of Denali to the floor of Death Valley, the United States spans more than 20,000 vertical feet. The tables below list the highest and lowest point in every state and in every one of the 3,144 counties and county equivalents, derived from USGS elevation data. Click any column heading to sort, and use the search box to filter the county table. Below the tables you will find a map for every state showing which county contains its highest point and which contains its lowest.
The Highest and Lowest Point in Every State
Elevations are in feet and meters above sea level. The named high and low points are the officially recognized ones; the elevation figures are derived from terrain data, so they can differ slightly from surveyed values (Denali, for example, is officially 20,310 ft). Where a state's lowest elevation is the coast, several counties tie at sea level.
| # | State | Highest Point | Highest (ft) | Highest (m) | Lowest Point | Lowest (ft) | Lowest (m) |
|---|
The Highest and Lowest Point in Every US County
All 3,144 counties and county equivalents. Relief is the difference between the highest and lowest point in the county, a rough measure of how mountainous it is. Counties marked with an asterisk had their minimum adjusted to remove elevation model artefacts such as open pit mines and quarries, or their maximum includes a man-made structure; see the notes at the bottom of the page. Use the search box to filter by county or state name.
| # | County | State | Highest (ft) | Highest (m) | Lowest (ft) | Lowest (m) | Relief (ft) |
|---|
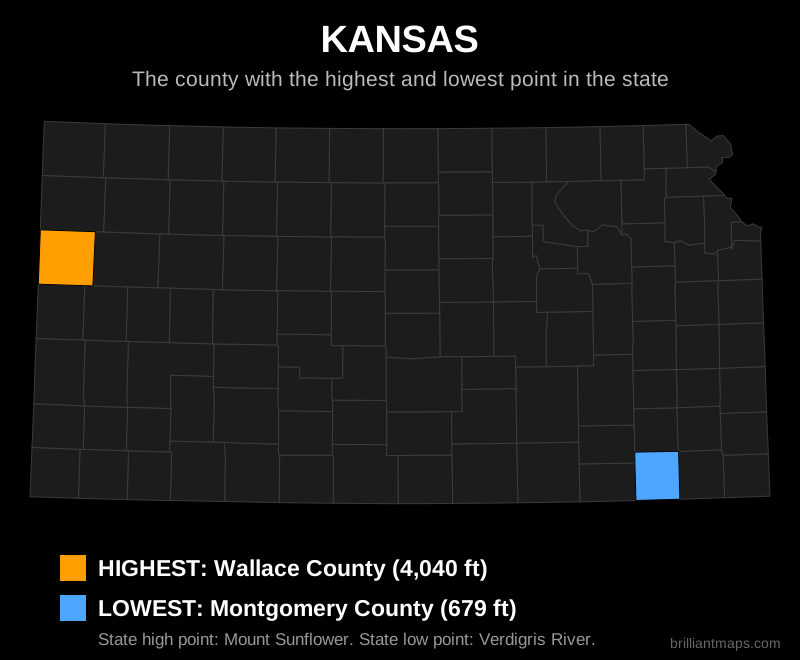
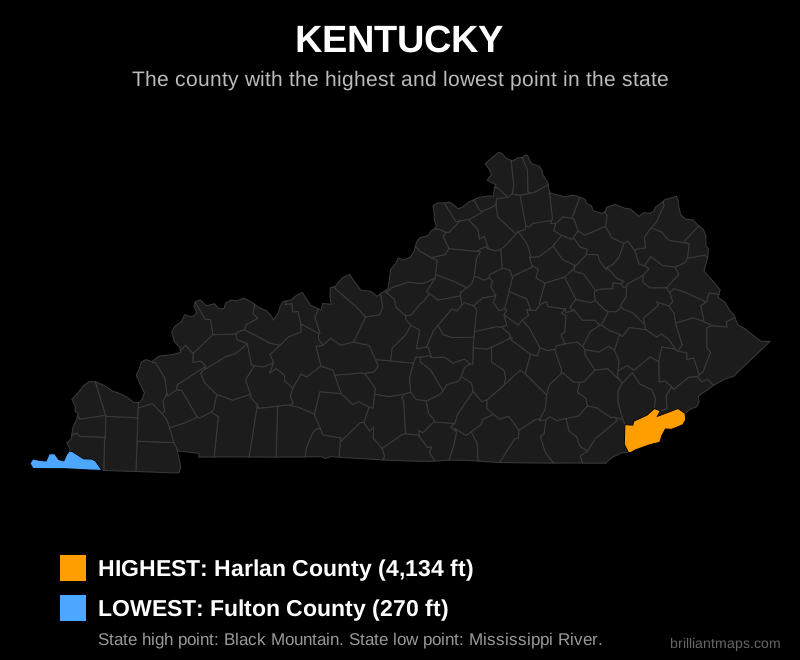
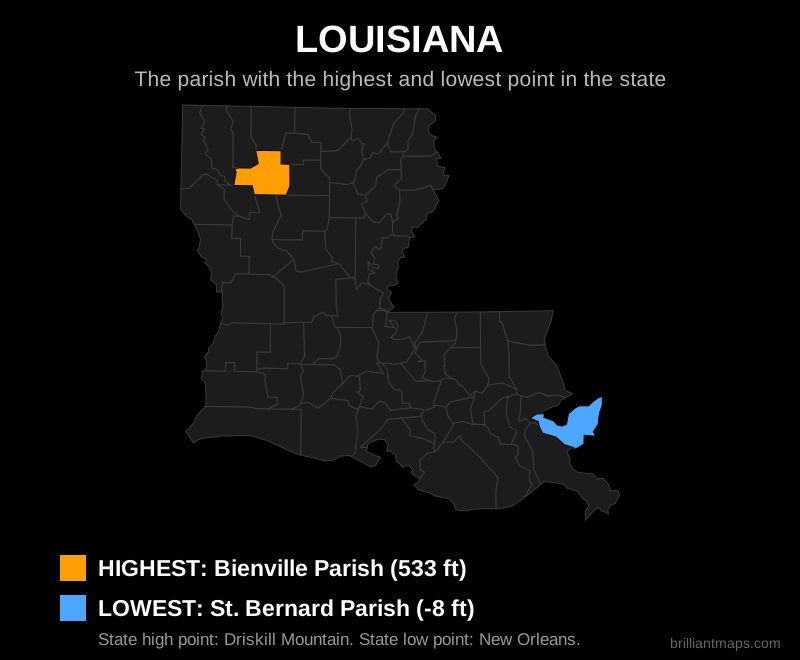
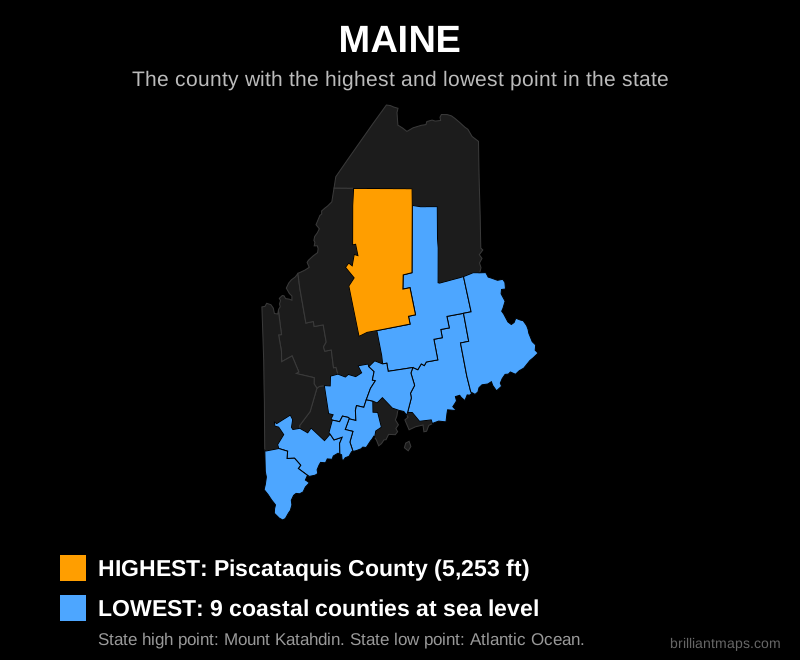
The Highest and Lowest County in Every State
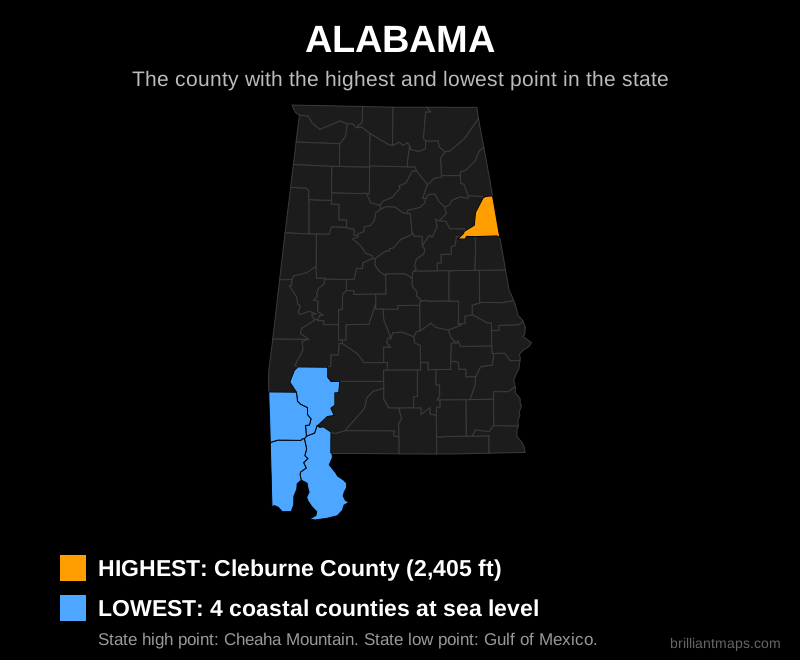
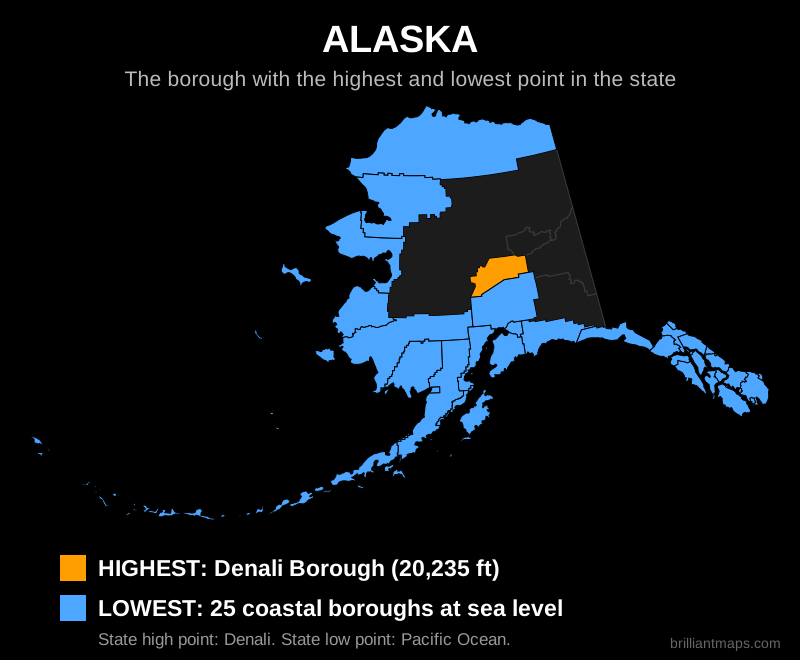
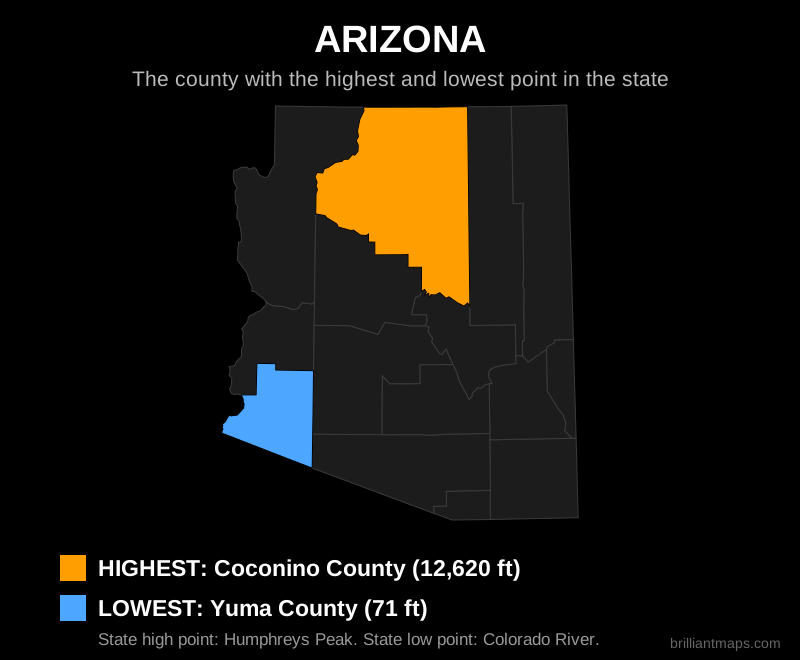
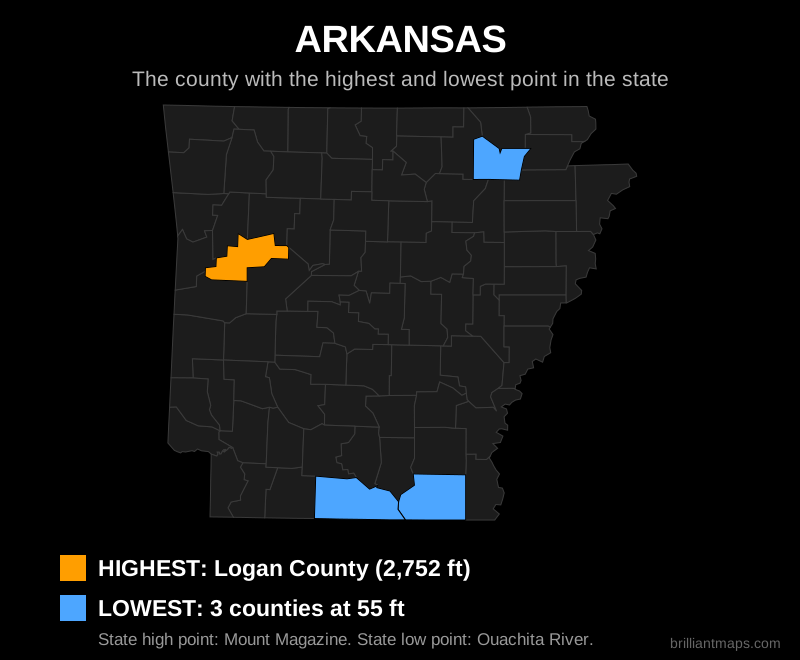
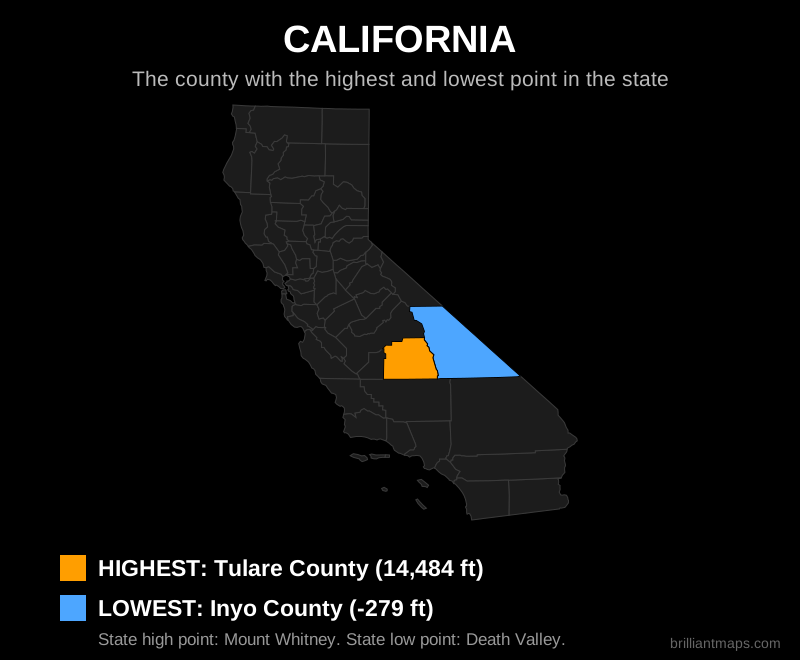
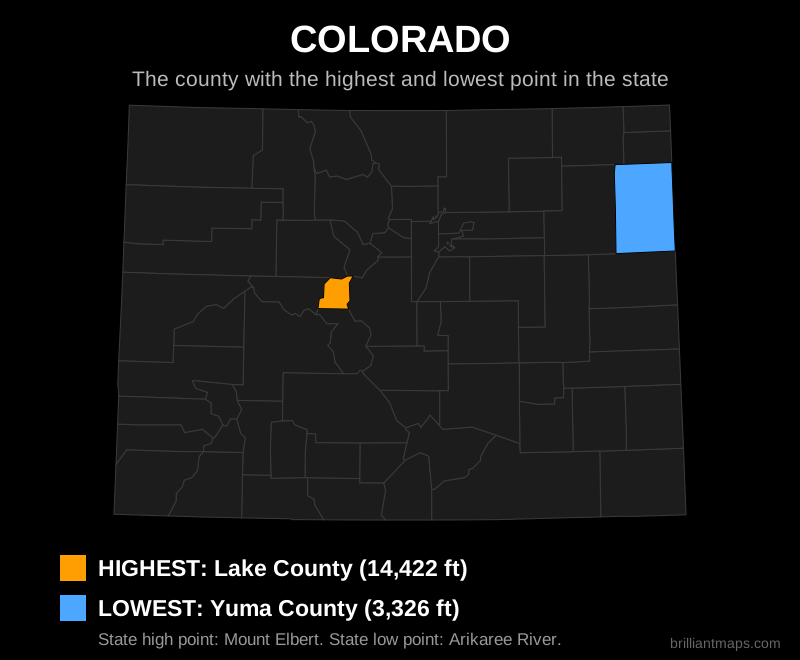
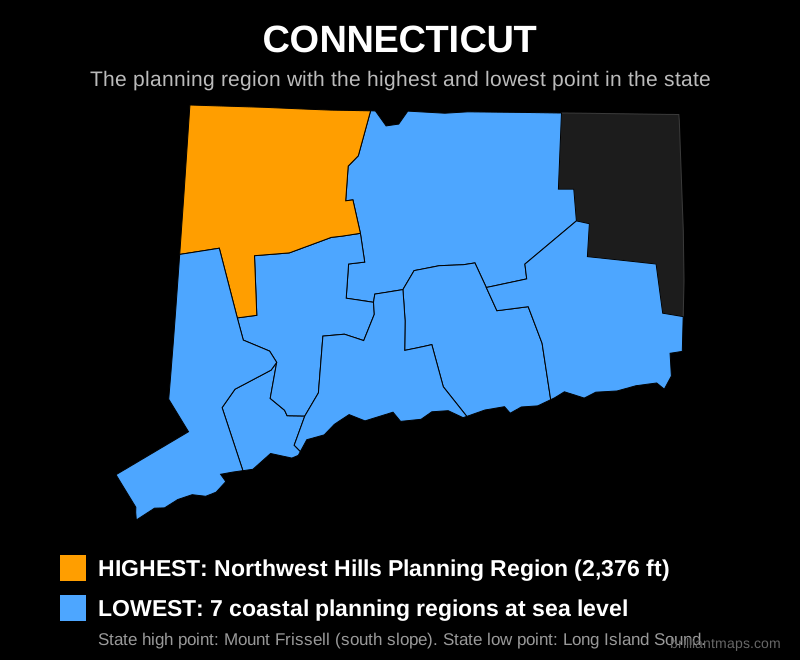
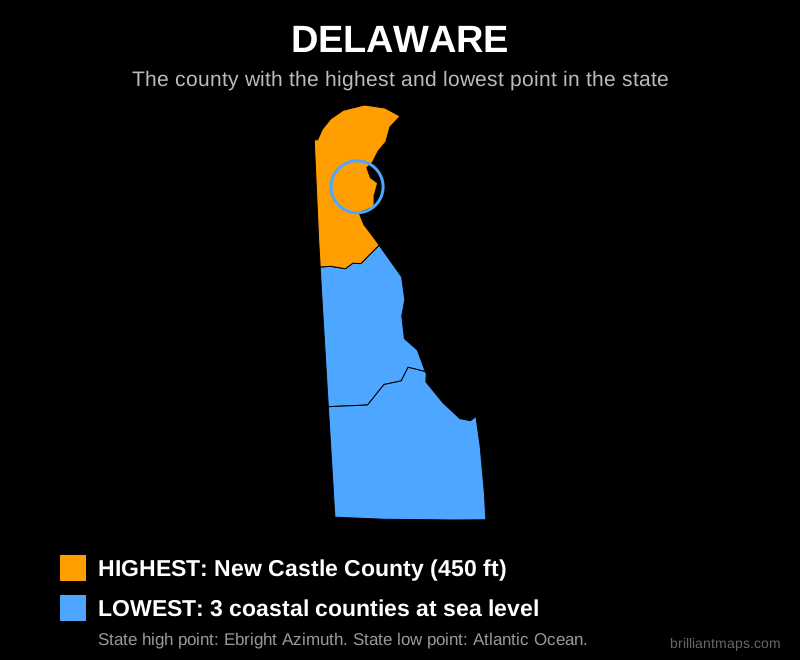
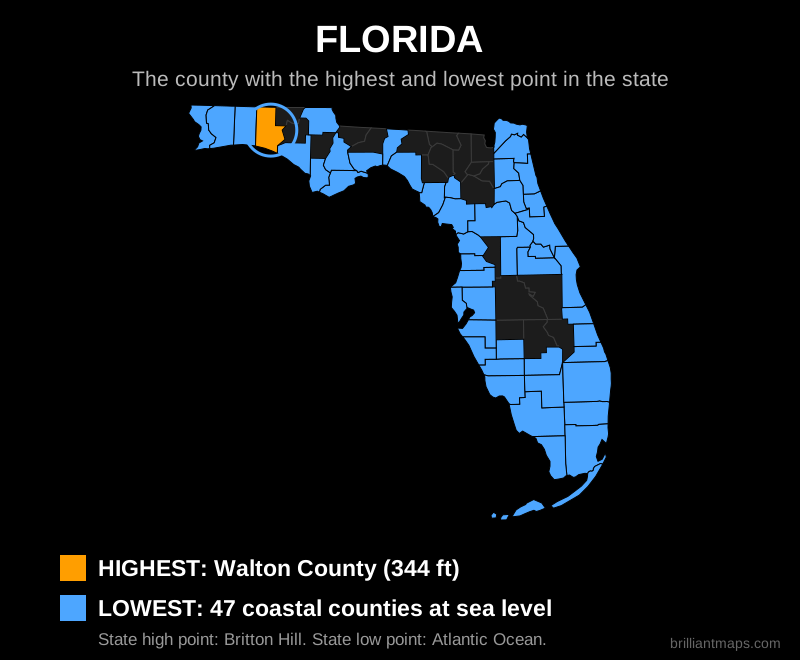
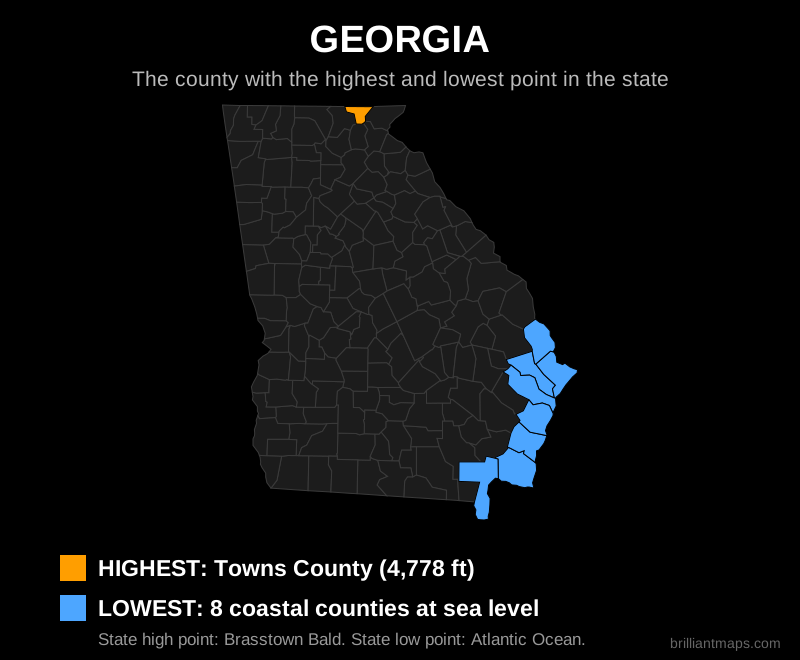
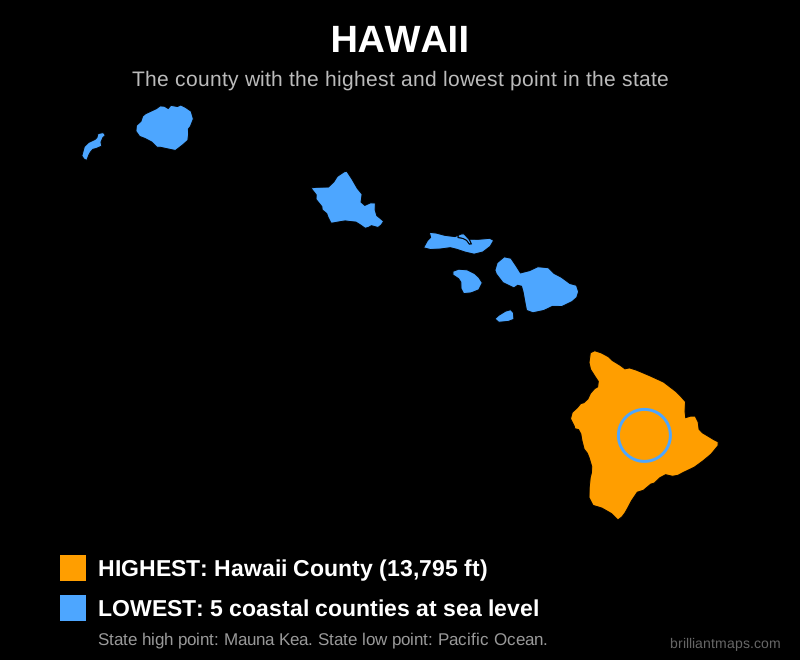
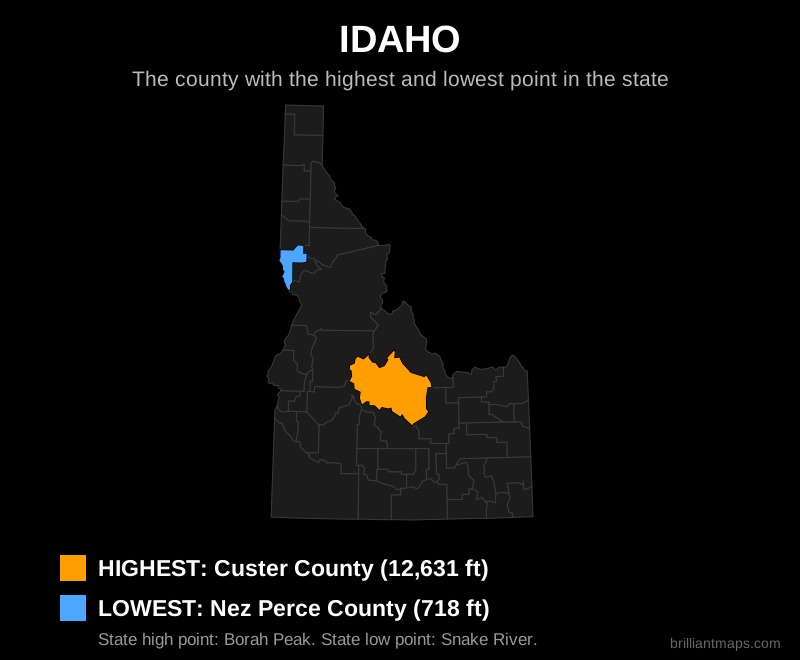
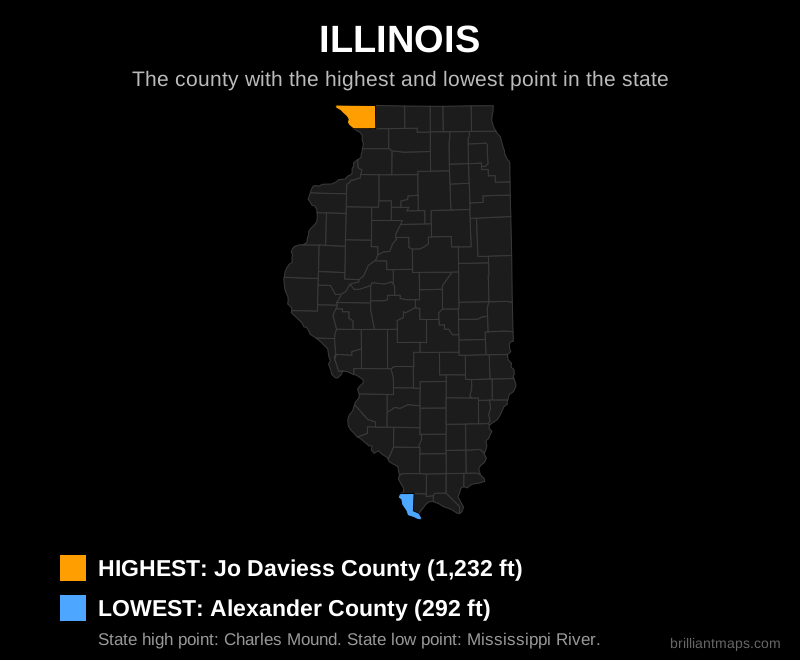
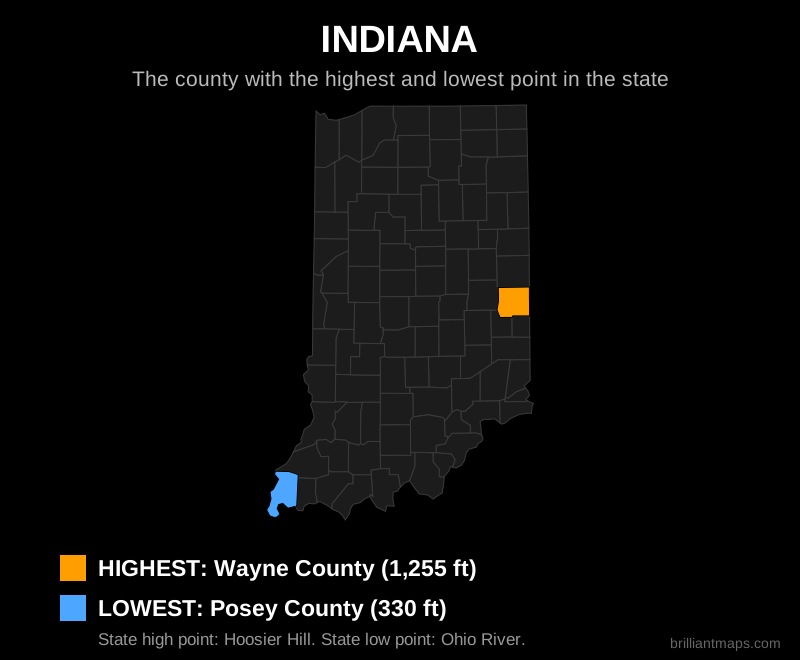
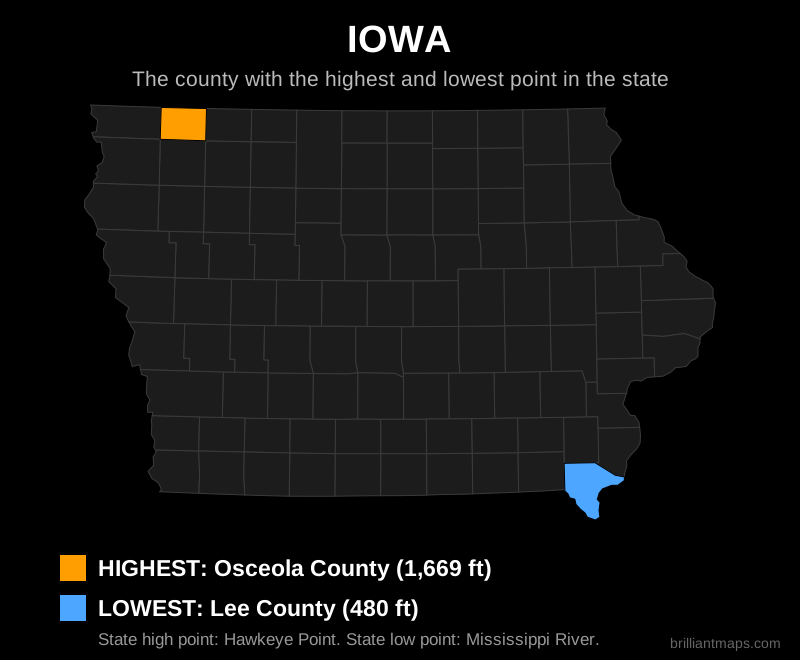
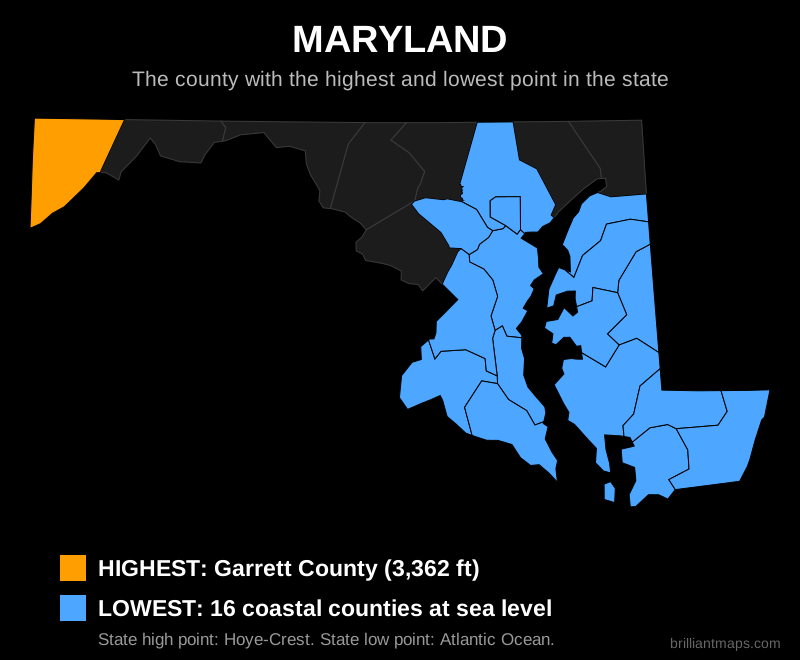
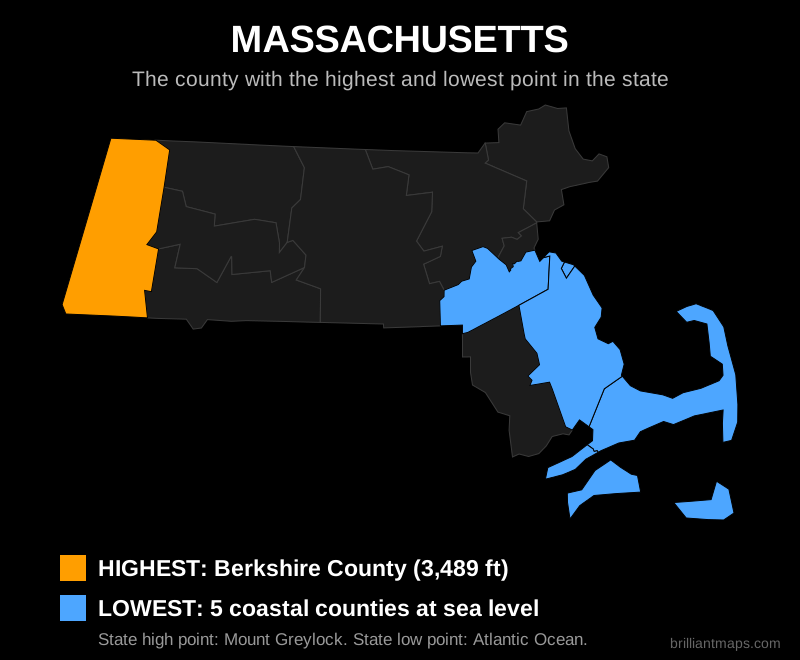
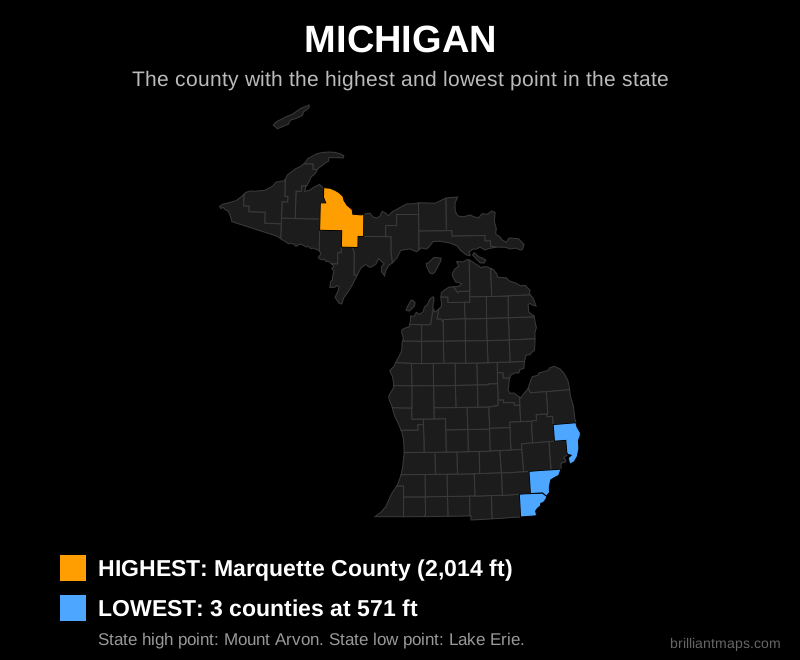
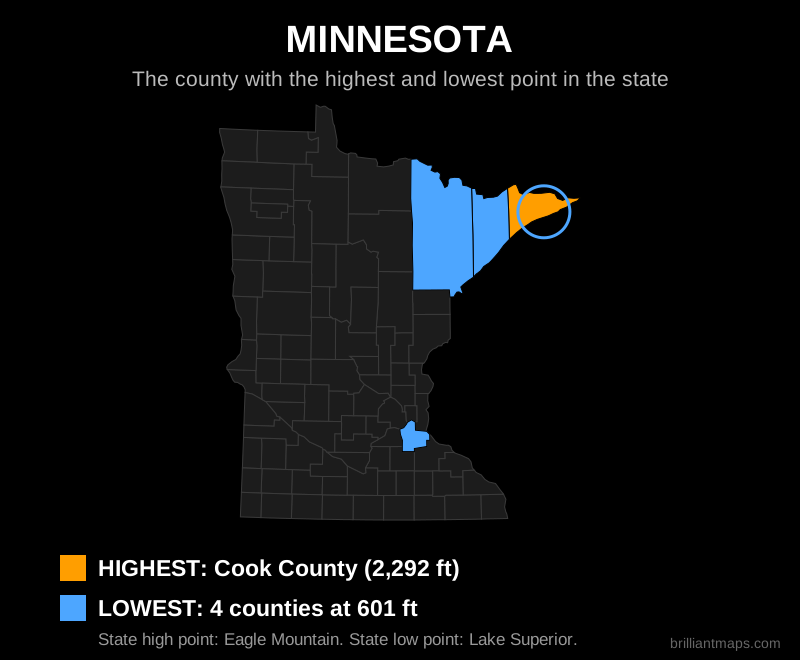
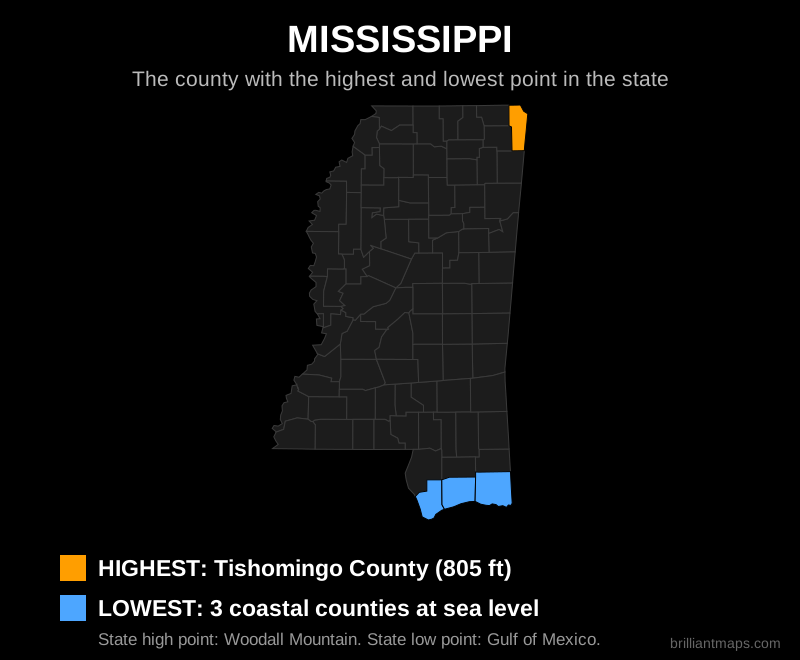
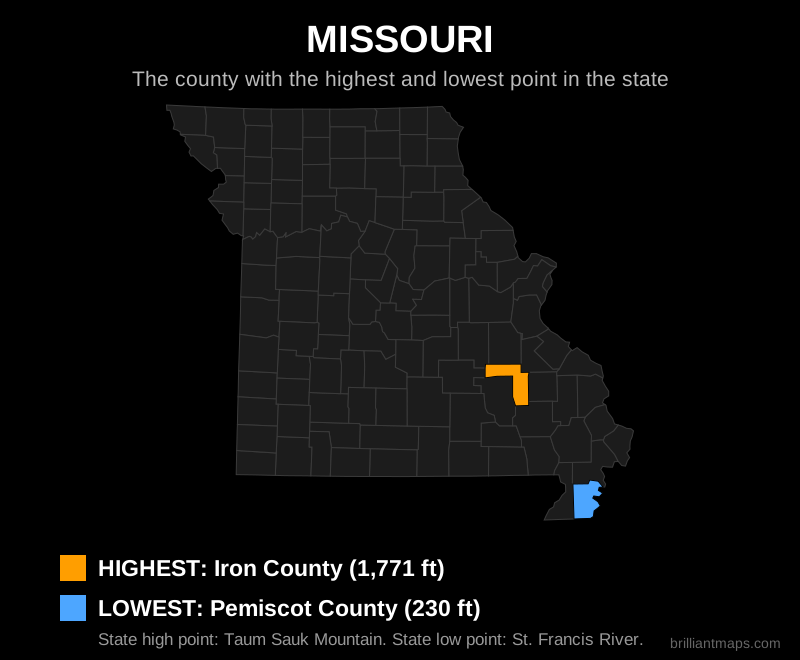
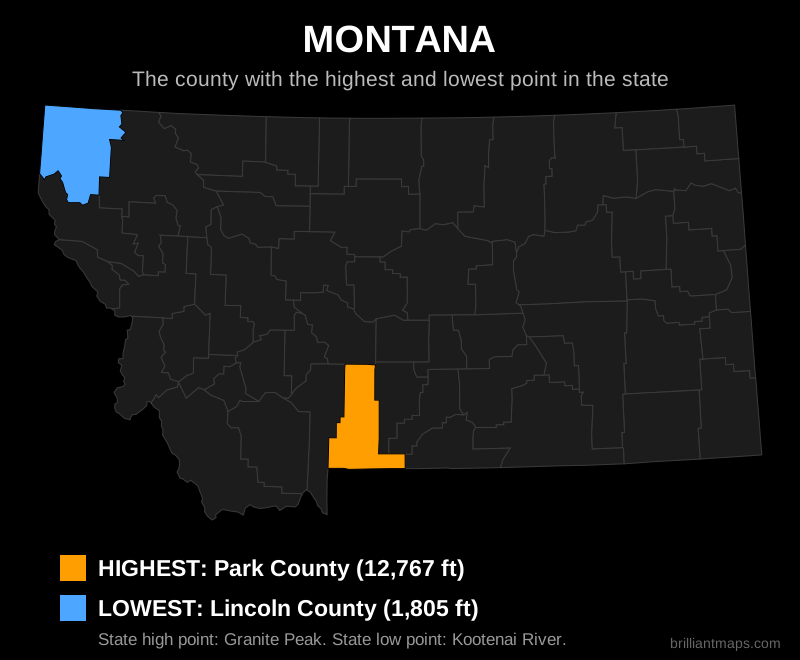
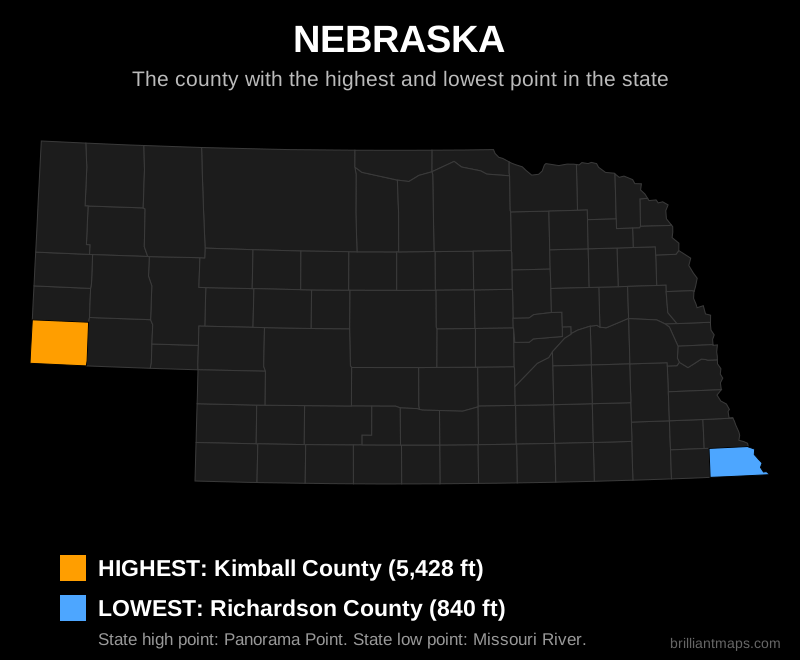
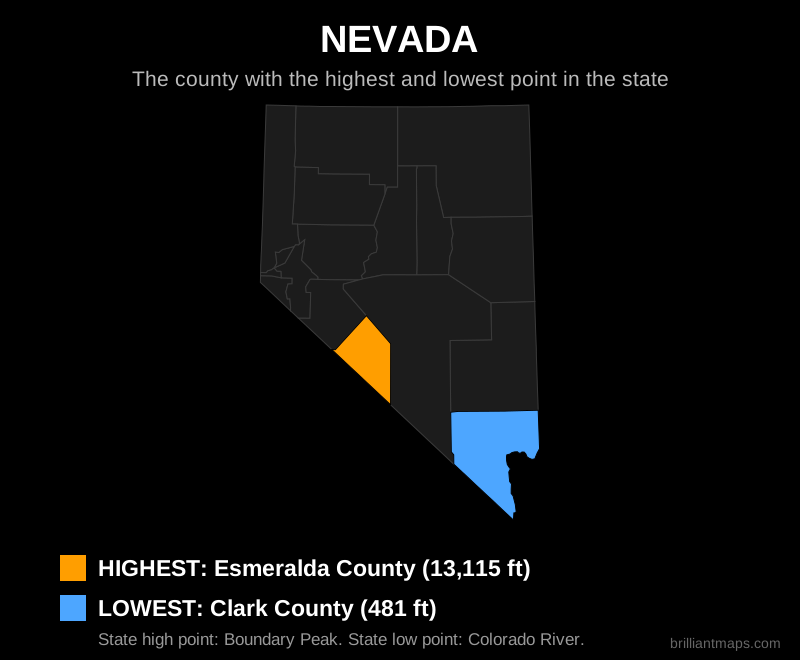
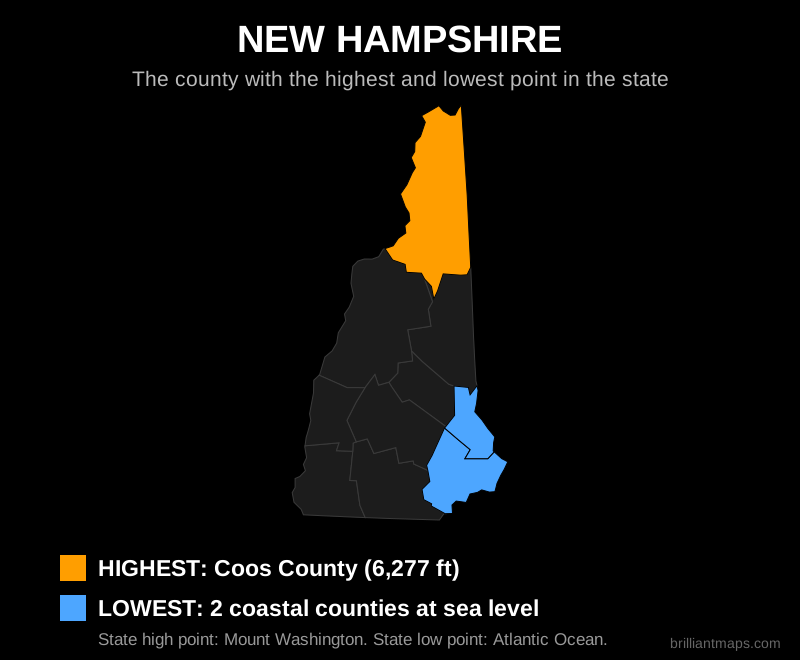
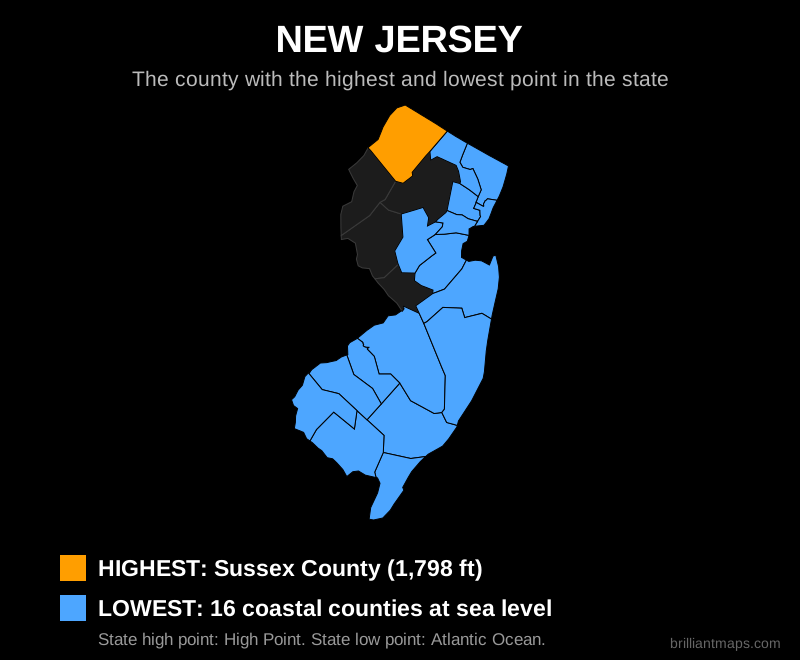
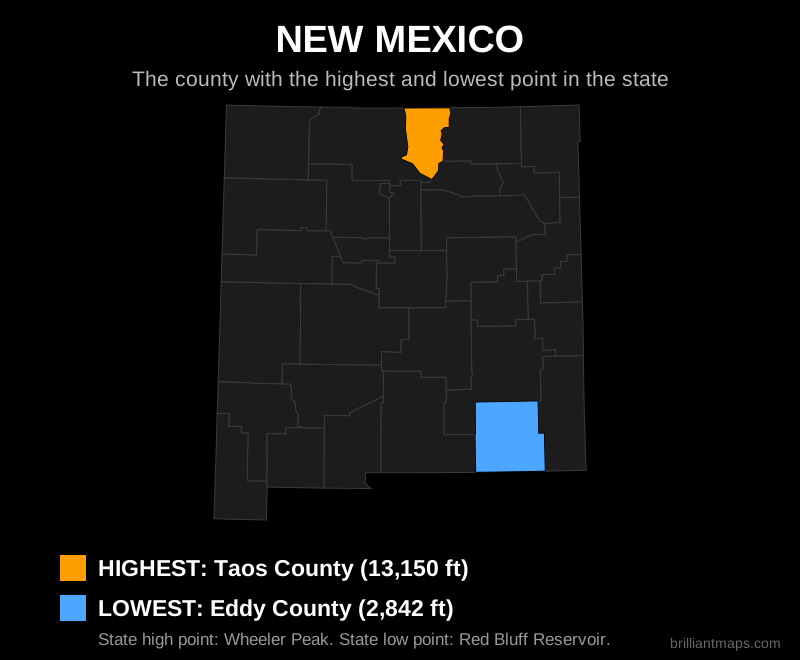
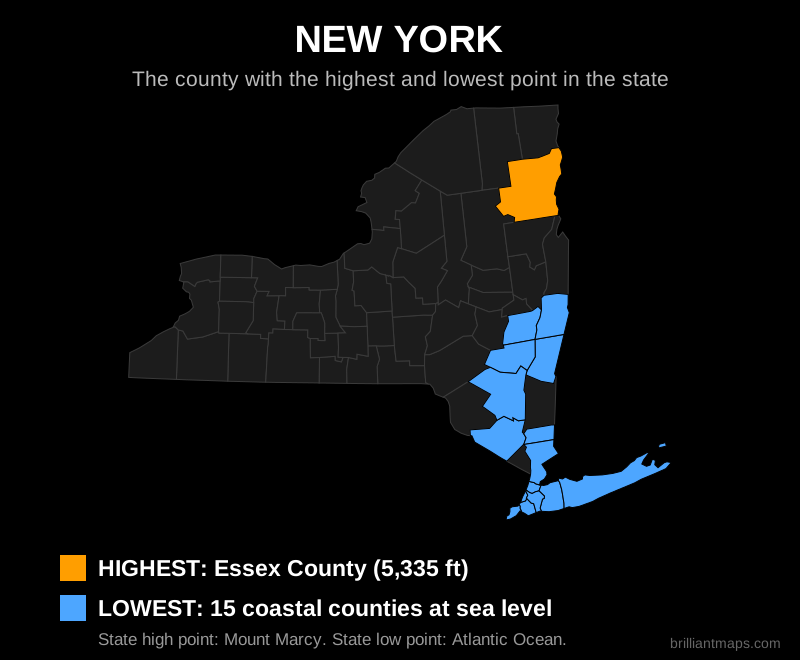
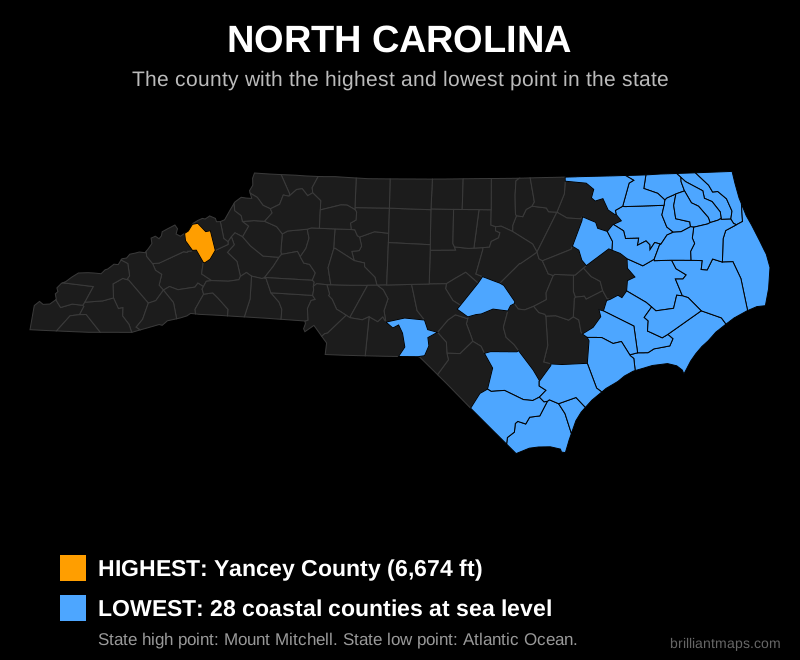
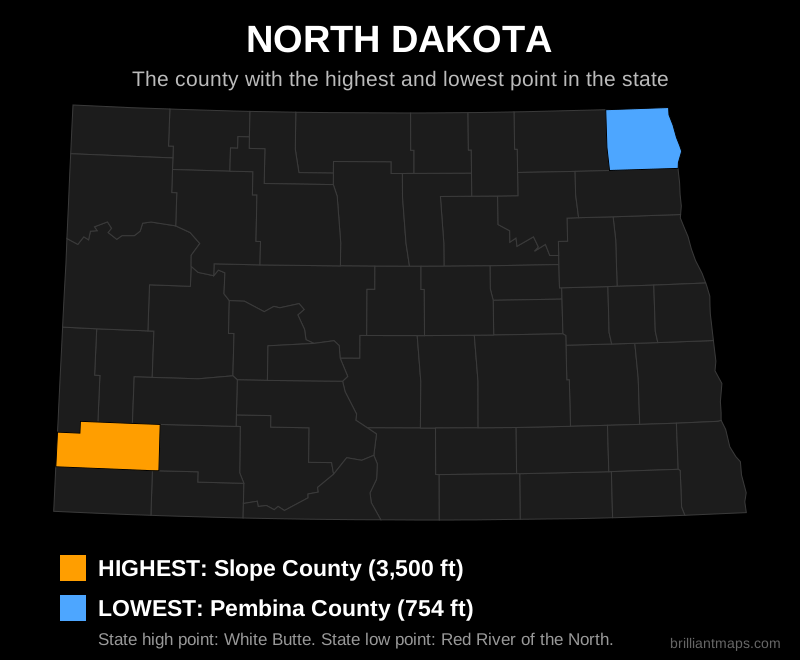
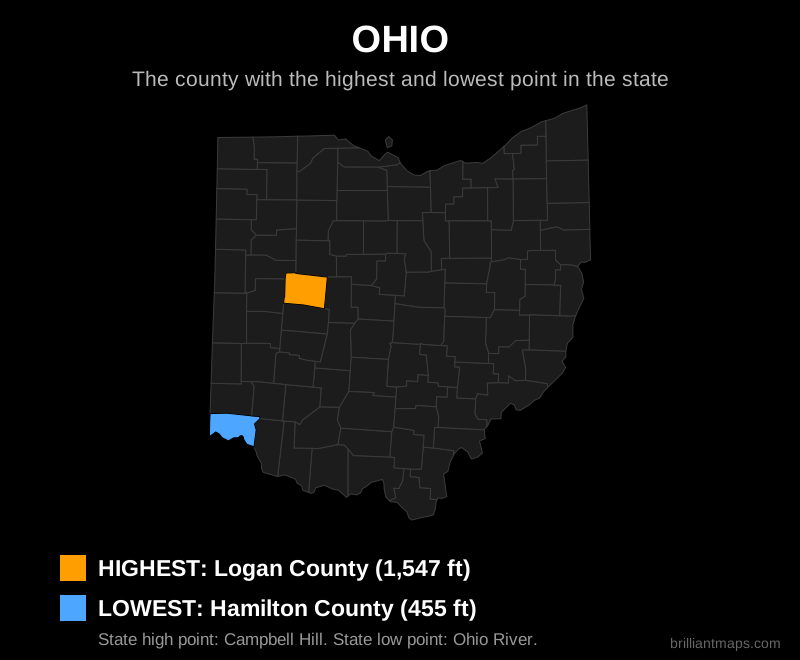
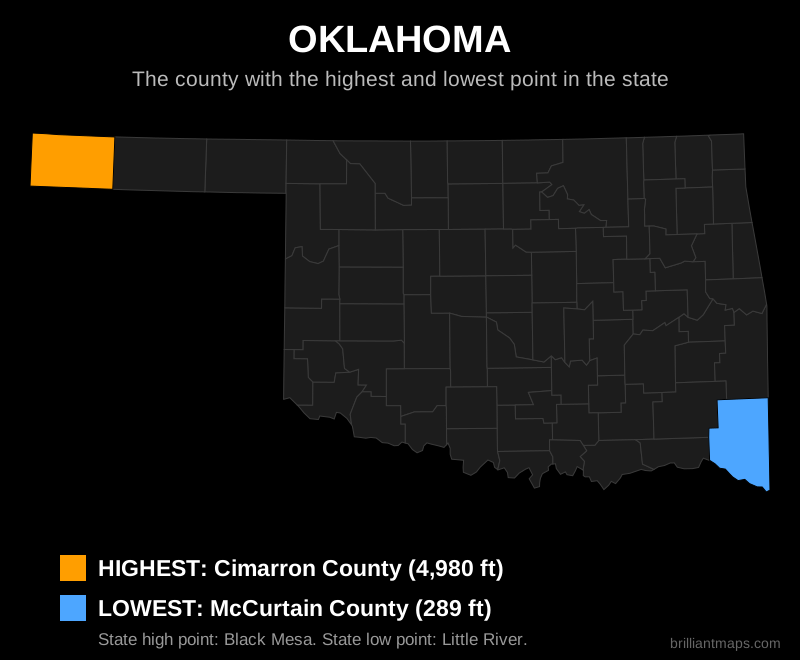
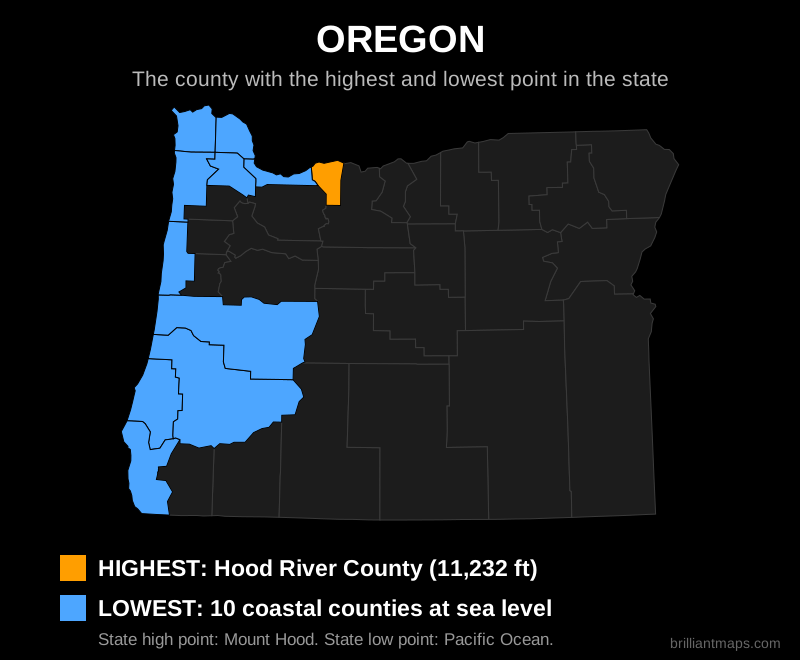
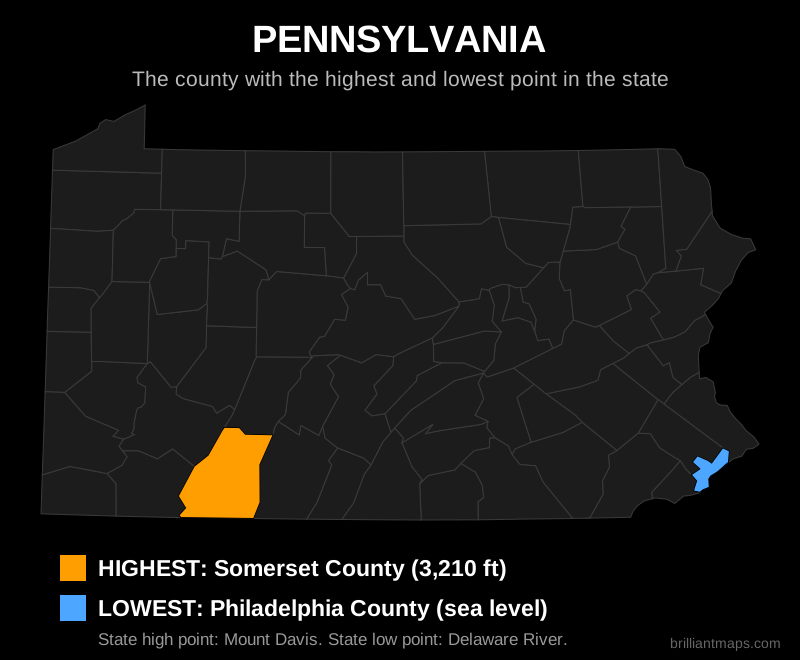
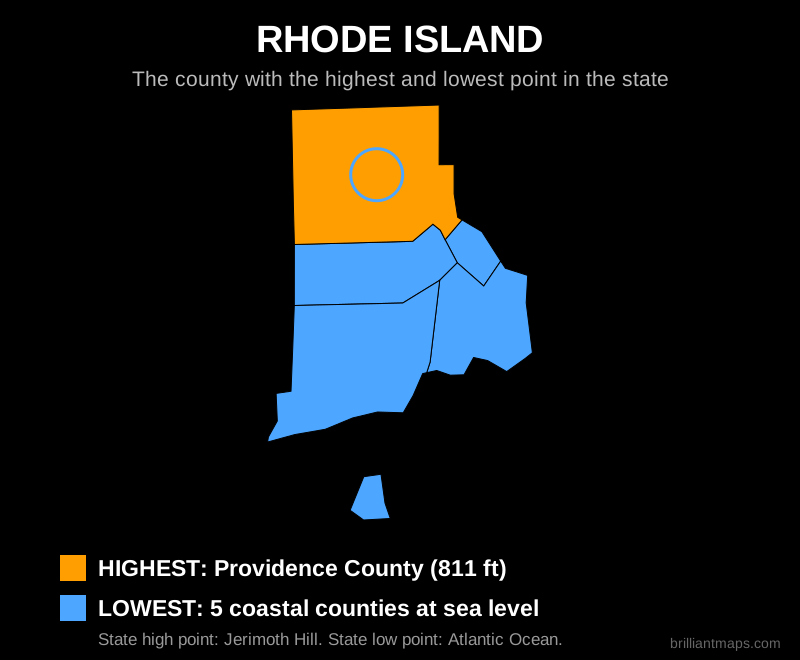
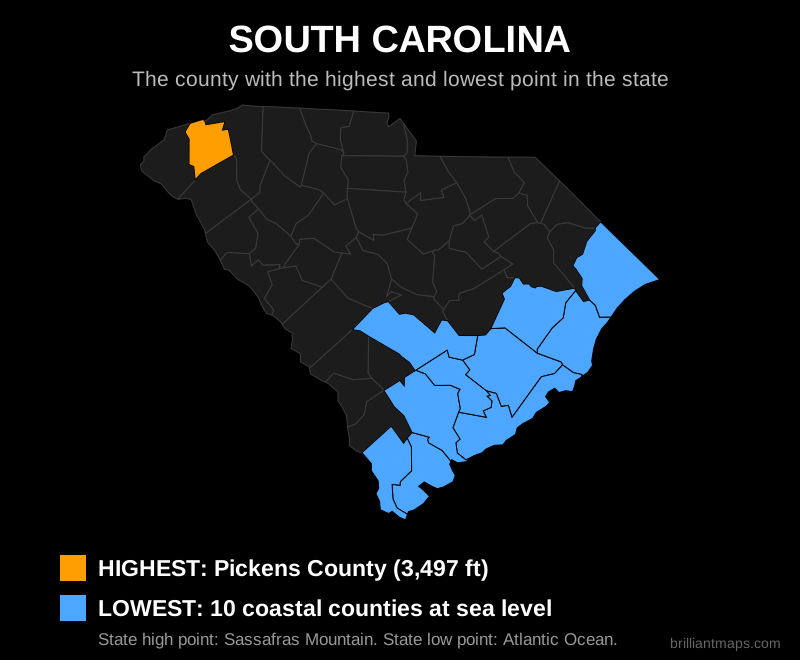
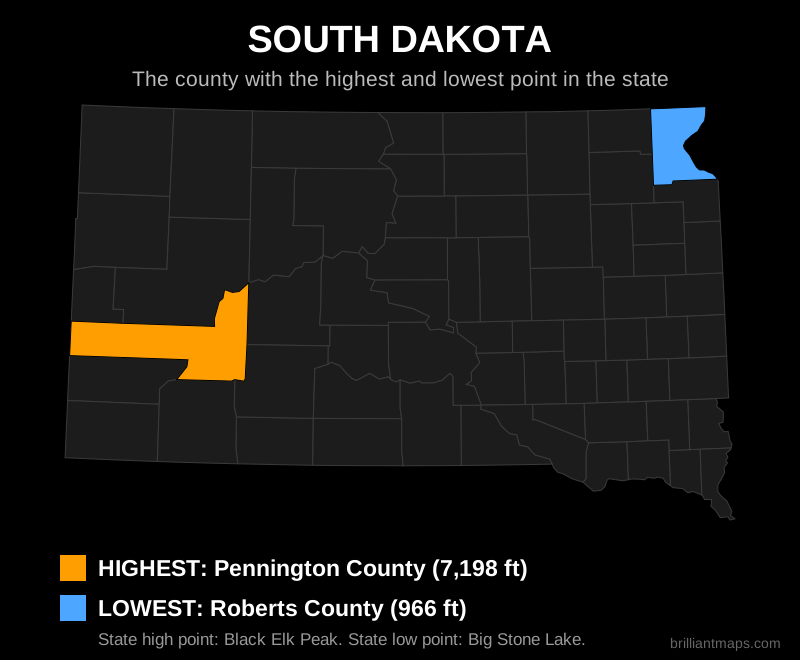
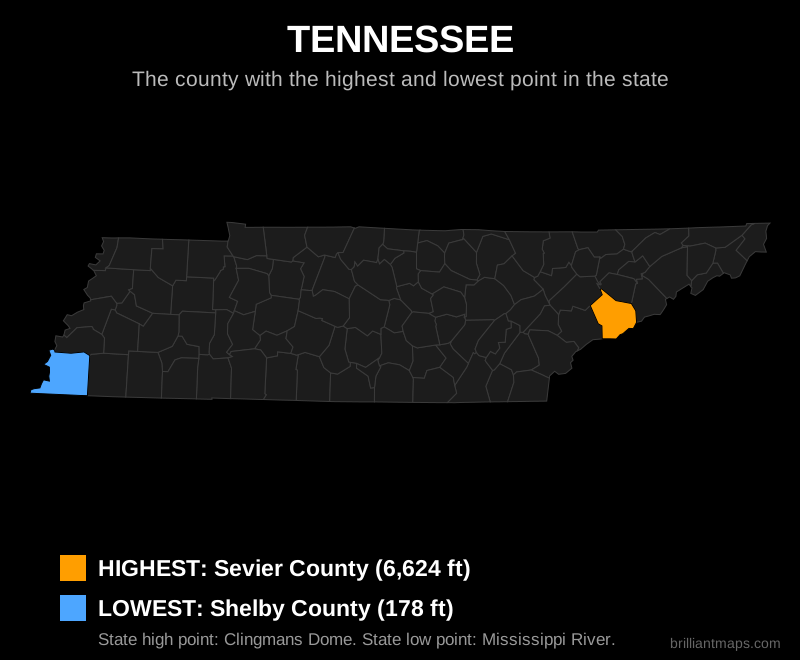
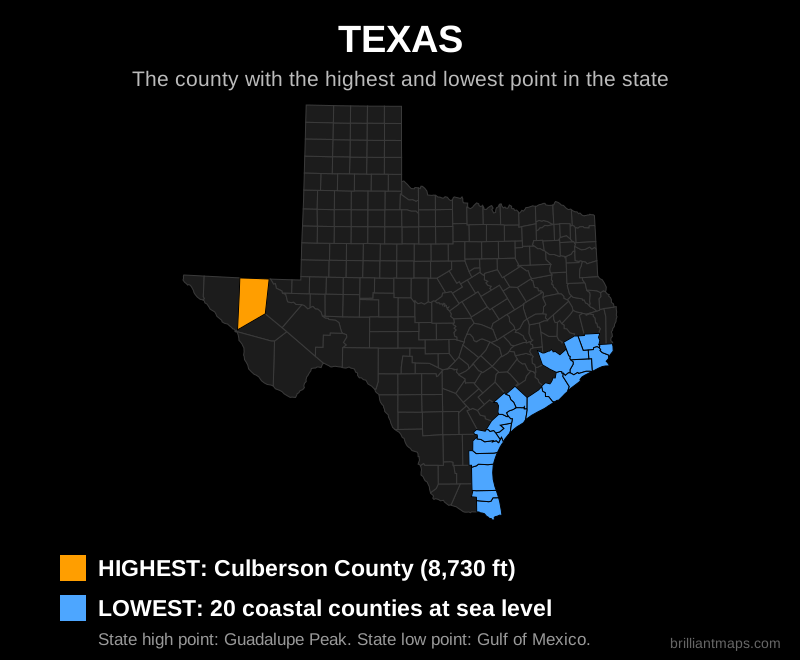
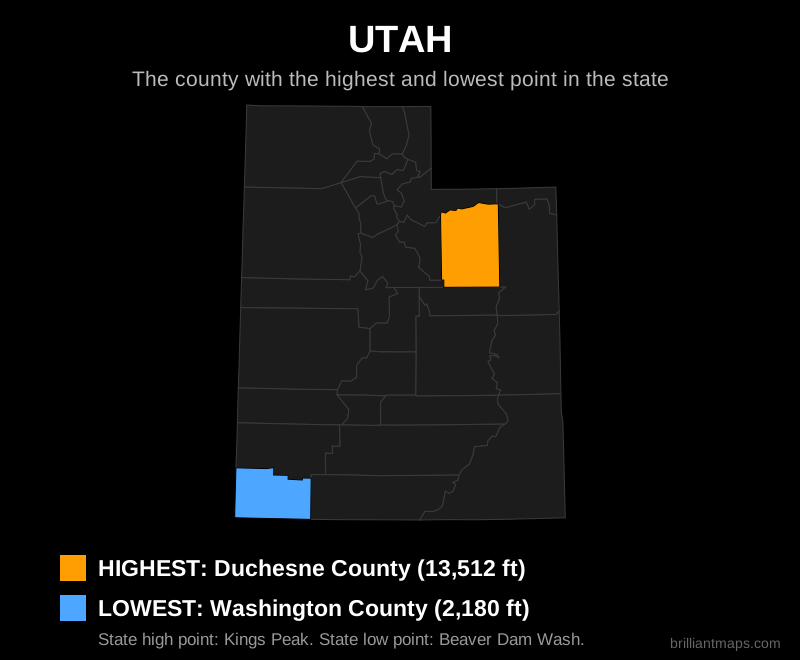
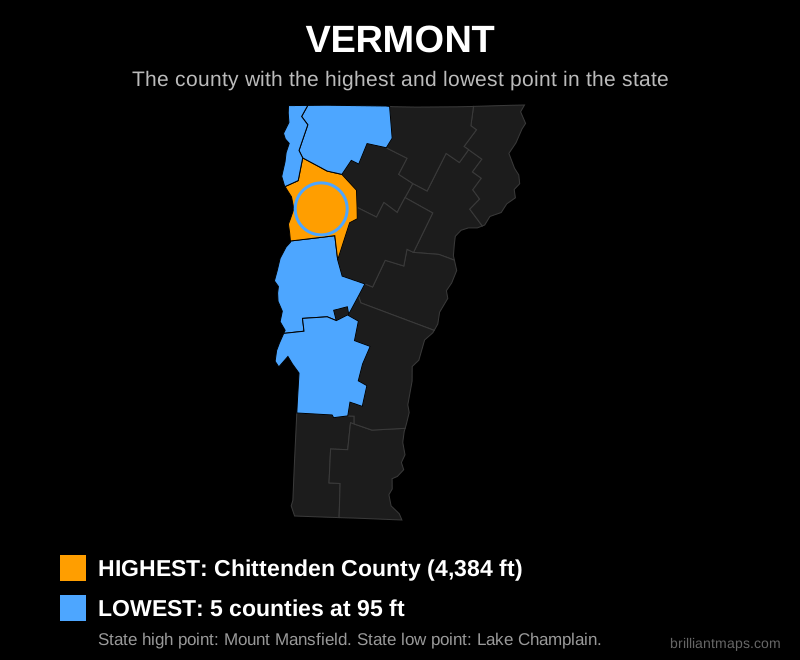
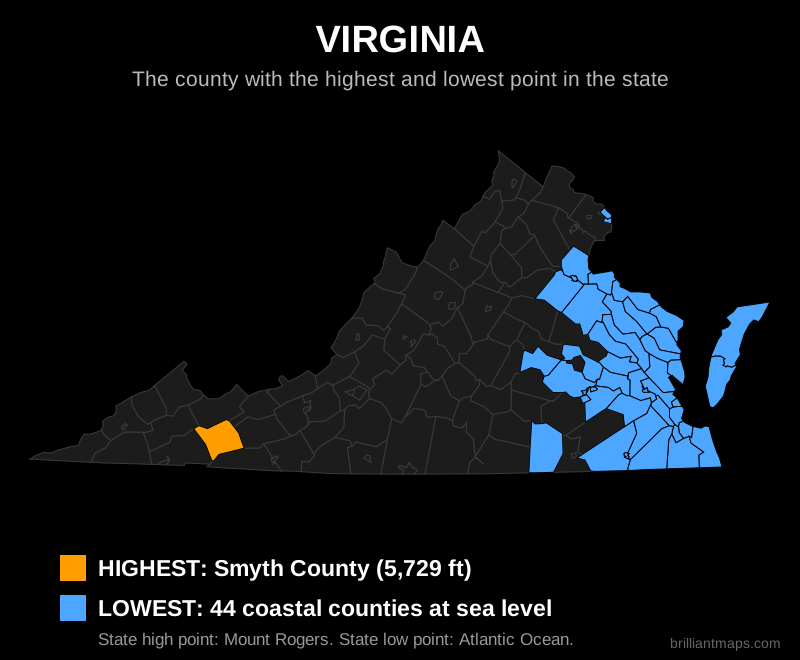
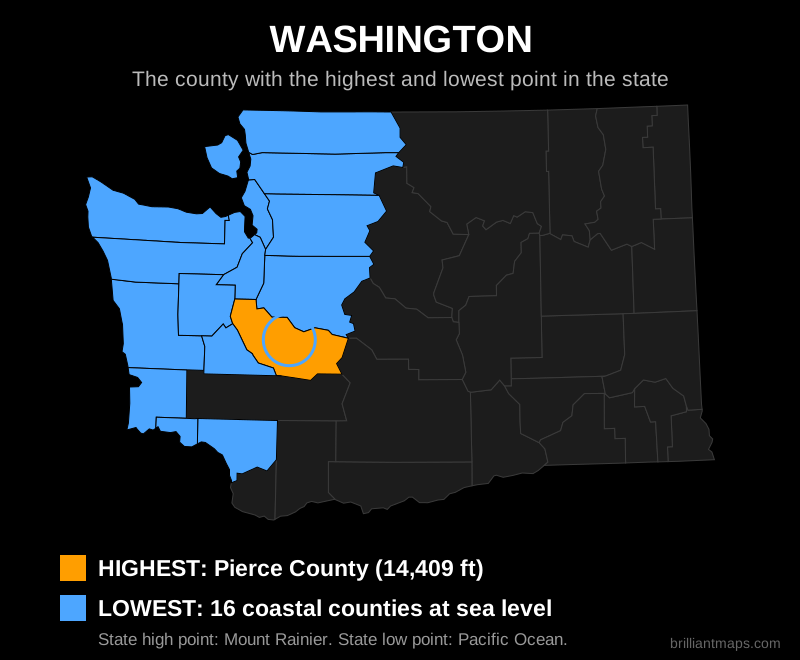
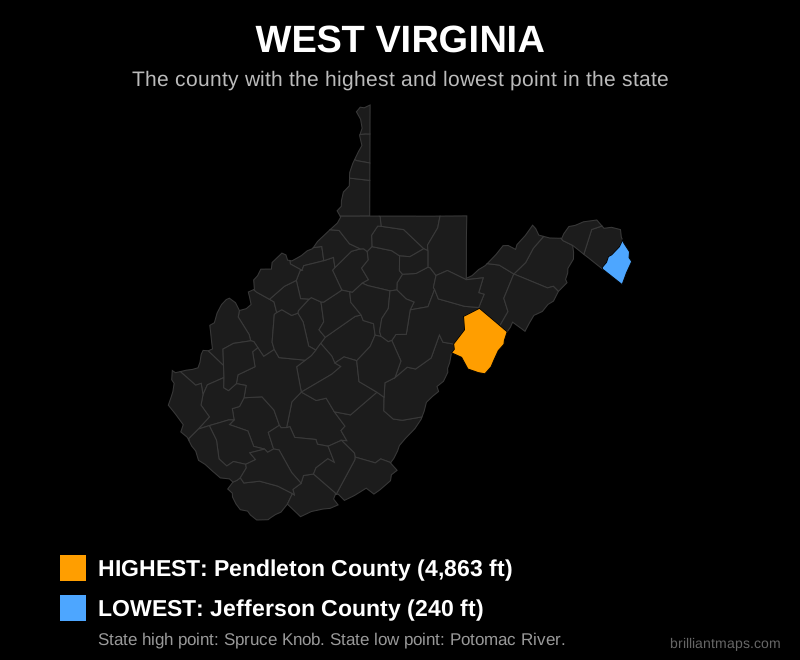
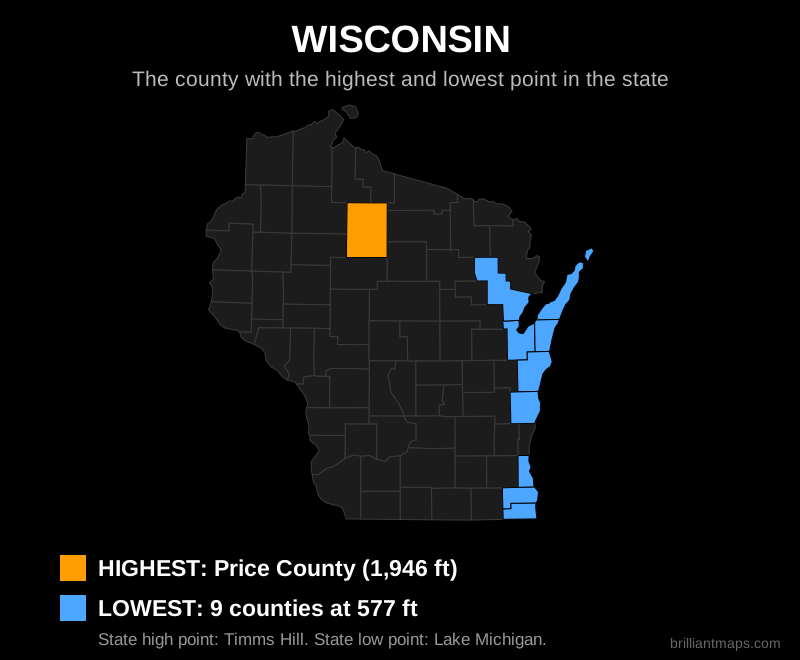
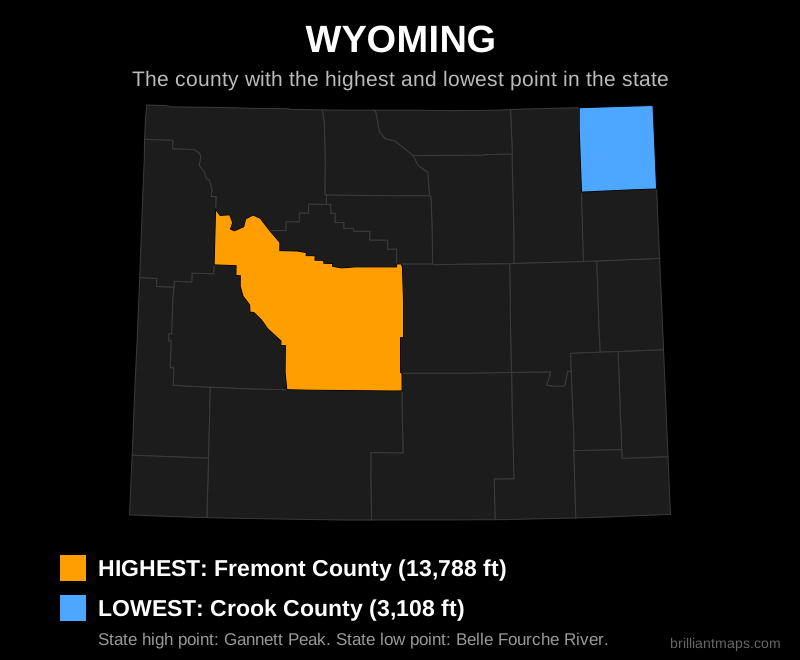
One map for each state: the county (parish in Louisiana, borough in Alaska, planning region in Connecticut) containing the state's highest point is in orange, and the county or counties containing its lowest point are in blue. Where the lowest point is the coast or a lake, every county that reaches that level is highlighted. Very small counties are circled so they are easy to spot. The District of Columbia is a single county equivalent, so it has no map.
Data Sources and Notes
County elevation extremes were computed from the USGS 3D Elevation Program terrain model (1 arc-second, with IFSAR data for Alaska). Digital elevation models include some features that are not natural terrain: open pit mines, quarries and spoil heaps, lake and offshore depths, and occasional data gaps can all produce false county extremes. To correct for this, coastal below-sea-level readings were set to sea level, Great Lakes and Lake Champlain shoreline counties were floored at the lake surface, and clear mining or data artefacts were replaced using official state elevations and neighboring county values. In total 481 county minimums were adjusted; the 140 counties adjusted by more than 30 ft are marked with an asterisk in the table, and their corrected values should be treated as close estimates. Two Florida counties (Polk and Hamilton) have maximums that include phosphate mining structures taller than the state's natural high point of Britton Hill; they are marked and excluded from map selection. Genuine below-sea-level terrain in Death Valley, the Salton Sea basin and the New Orleans area is preserved. State high and low point names follow the official USGS lists. Terrain-derived elevations can differ slightly from surveyed values. This page is for general reference and educational purposes.