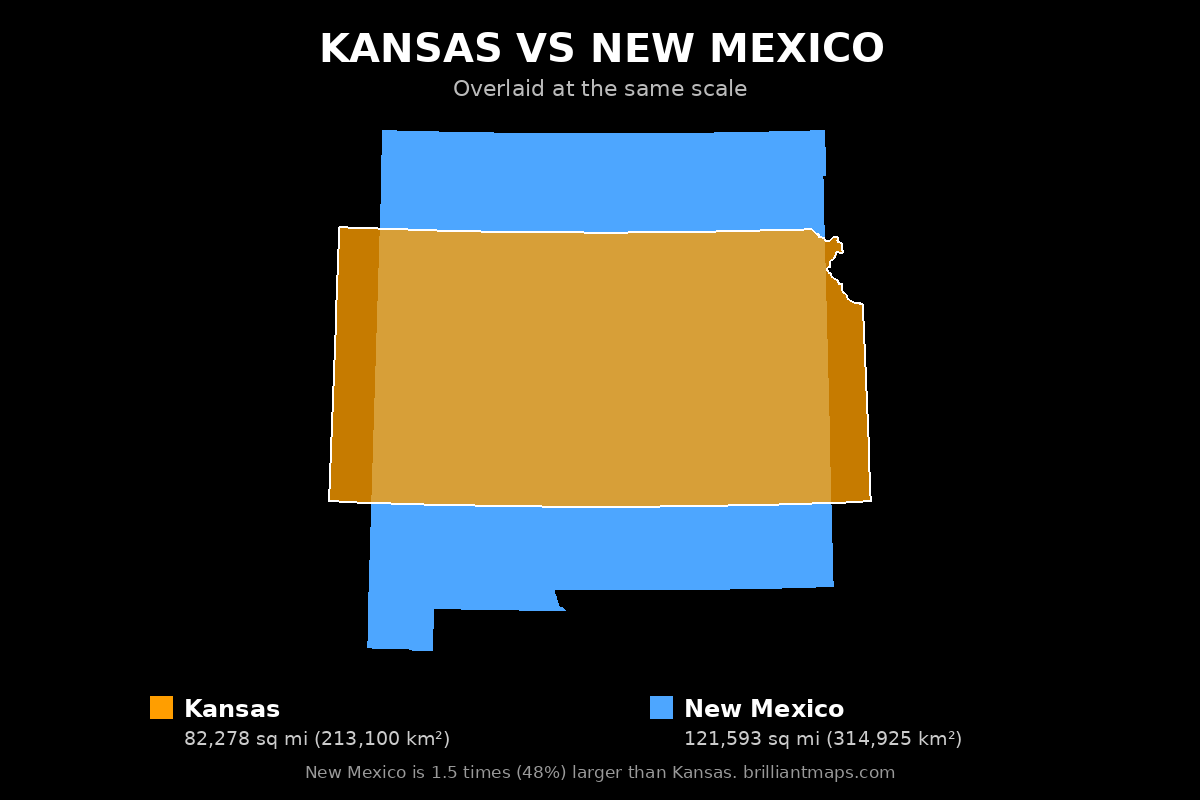
The map above shows Kansas and New Mexico side by side at exactly the same scale, using equal-area projections, so their true relative sizes are preserved.
Kansas vs New Mexico Geography
Land area
- Kansas has a land area of 81,759 square miles (211,754 km²), while New Mexico has 121,313 square miles (314,198 km²).
- New Mexico's land area is 1.5 times (48%) larger than Kansas'.
Total area
- Kansas: 82,278 square miles (213,100 km²) vs New Mexico: 121,593 square miles (314,925 km²), including inland and coastal water.
- New Mexico's total area is 1.5 times (48%) larger than Kansas'.
Length
- Kansas is 207 miles (334 km) long from north to south; New Mexico is 395 miles (635 km).
- New Mexico's north-south length is 1.9 times (91%) longer than Kansas'.
Width
- Kansas spans 401 miles (645 km) east to west; New Mexico spans 498 miles (801 km).
- New Mexico's east-west width is 1.2 times (24%) wider than Kansas'.
Highest point
- Kansas's highest point is Mount Sunflower at 4,040 feet (1,231 m); New Mexico's is Wheeler Peak at 13,150 feet (4,008 m).
- Wheeler Peak is 9,110 feet higher than Mount Sunflower.
Lowest point
- Kansas's lowest point is Verdigris River at 679 feet; New Mexico's is Red Bluff Reservoir at 2,842 feet.
- Kansas's lowest point is 2,163 feet lower.
Kansas vs New Mexico Population and History
Population
- Kansas has a population of 2,970,606 (2024), while New Mexico has 2,130,256 (2024).
- Kansas' population is 1.4 times (39%) larger than New Mexico's.
Population density
- Kansas: 36.3 people per square mile vs New Mexico: 17.6.
- Kansas' population density is 2.1 times (106%) higher than New Mexico's.
Biggest city
- Kansas's biggest city is Wichita with 400,991 people; New Mexico's is Albuquerque with 560,326.
- Albuquerque's population is 1.4 times (40%) larger than Wichita's.
Largest metro area
- Kansas's largest metropolitan area is Kansas City, MO-KS metro area (2,253,579 people) vs New Mexico's Albuquerque, NM metro area (926,303).
- Kansas City, MO-KS metro area's population is 2.4 times (143%) larger than Albuquerque, NM metro area's.
History
- Kansas: Admitted to the Union on January 29, 1861, as the 34th state.
- New Mexico: Admitted to the Union on January 6, 1912, as the 47th state.
- In its current form, Kansas is the older of the two by 51 years.
Kansas vs New Mexico Economy
GDP
- Kansas's GDP is $230.5 billion (2024) vs New Mexico's $147.1 billion.
- Kansas' economic output is 1.6 times (57%) larger than New Mexico's.
GDP per capita
- Kansas: $77,601 per person vs New Mexico: $69,046.
- Kansas' GDP per capita is 1.1 times (12%) higher than New Mexico's.
Average income
- Kansas: $65,856 vs New Mexico: $58,249 average income per person (per capita personal income).
- Kansas' average income is 1.1 times (13%) higher than New Mexico's.
Kansas vs New Mexico Counties
Number of counties
- Kansas has 105 counties, while New Mexico has 33.
- Kansas' county count is 3.2 times (218%) higher than New Mexico's.
Biggest county by area
- Kansas's largest county is Butler County at 1,430 square miles; New Mexico's is Catron County at 6,924 square miles.
- Catron County's land area is 4.8 times (384%) larger than Butler County's.
Smallest county by area
- Kansas: Wyandotte County (152 sq mi) vs New Mexico: Los Alamos County (109 sq mi).
- Wyandotte County's land area is 1.4 times (39%) larger than Los Alamos County's.
Most populous county
- Kansas: Johnson County (632,276 people) vs New Mexico: Bernalillo County (671,747 people).
- Bernalillo County's population is 1.1 times (6%) larger than Johnson County's.
Least populous county
- Kansas: Greeley County (1,152 people) vs New Mexico: Harding County (635 people).
- Greeley County's population is 1.8 times (81%) larger than Harding County's.
Richest county
- Kansas: Greeley County ($134,780 per capita income) vs New Mexico: Los Alamos County ($98,378).
- Greeley County's income is 1.4 times (37%) richer than Los Alamos County's.
Poorest county
- Kansas: Wyandotte County ($42,878 per capita income) vs New Mexico: Cibola County ($36,397).
- Wyandotte County's income is 1.2 times (18%) richer than Cibola County's.
Kansas vs New Mexico Taxes
State income tax
- Kansas has a top income tax rate of 5.58%, while New Mexico has a top income tax rate of 5.9%.
- New Mexico's top rate is 0.32 percentage points higher.
Property tax
- Kansas: 1.25% effective rate vs New Mexico: 0.63% of home value per year.
- Kansas's rate is 0.62 percentage points higher.
Sales tax
- Kansas: 8.71% combined state and average local rate vs New Mexico: 7.68%.
- Kansas's combined rate is 1.03 percentage points higher.
Official Websites
Kansas official website · New Mexico official website
Download the Kansas vs New Mexico Size Comparison Map for free
To download the map, right-click the image above (or press and hold on a phone or tablet) and choose Save image as. The map is free to use anywhere, including on your own website or in print, as long as you credit it with a link back to this page or to BrilliantMaps.com.
More Size Comparisons
All Kansas size comparisons · All New Mexico size comparisons
Area, elevation and boundary figures come from official national statistics and US Census Bureau and Natural Earth boundary data; US state population, economic, county and tax figures come from the US Census Bureau, the Bureau of Economic Analysis and the Tax Foundation. Figures are rounded and for general reference.