The map above shows Japan and South Africa side by side at exactly the same scale, using equal-area projections, so their true relative sizes are preserved.
Japan vs South Africa Geography
Land area
- Japan has a land area of 140,752 square miles (364,546 km²), while South Africa has 468,909 square miles (1,214,470 km²).
- South Africa's land area is 3.3 times (233%) larger than Japan's.
Total area
- Japan: 145,937 square miles (377,975 km²) vs South Africa: 471,445 square miles (1,221,037 km²), including inland and coastal water.
- South Africa's total area is 3.2 times (223%) larger than Japan's.
Length
- Japan is 1,557 miles (2,505 km) long from north to south; South Africa is 1,050 miles (1,690 km).
- Japan's north-south length is 1.5 times (48%) longer than South Africa's.
Width
- Japan spans 1,568 miles (2,524 km) east to west; South Africa spans 1,012 miles (1,628 km).
- Japan's east-west width is 1.5 times (55%) wider than South Africa's.
Highest point
- Japan's highest point is Mount Fuji at 12,388 feet (3,776 m); South Africa's is Mafadi at 11,319 feet (3,450 m).
- Mount Fuji is 1,069 feet higher than Mafadi.
Lowest point
- Japan's lowest point is Hachirogata at -13 feet; South Africa's is Indian Ocean at 0 feet.
- Japan's lowest point is 13 feet lower.
Japan vs South Africa Population and History
Population
- Japan has a population of 122,680,000 (2026), while South Africa has 63,522,380 (2026).
- Japan's population is 1.9 times (93%) larger than South Africa's.
Population density
- Japan: 871.6 people per square mile vs South Africa: 135.5.
- Japan's population density is 6.4 times (543%) higher than South Africa's.
Biggest city
- Japan's biggest city is Tokyo with 13,515,271 people; South Africa's is Johannesburg with 4,803,262.
- Tokyo's population is 2.8 times (181%) larger than Johannesburg's.
Largest metro area
- Japan's largest metropolitan area is Tokyo (33,412,512 people) vs South Africa's Johannesburg (7,077,175).
- Tokyo's population is 4.7 times (372%) larger than Johannesburg's.
History
- Japan: An independent state for over two millennia; the current constitution dates from 1947.
- South Africa: Formed as the Union of South Africa on May 31, 1910; a republic since 1961.
- In its current form, Japan is the older of the two by 1,250 years.
Japan vs South Africa Economy
GDP
- Japan's GDP is $4,435.2 billion (2025) vs South Africa's $427.2 billion.
- Japan's economic output is 10.4 times larger than South Africa's.
GDP per capita
- Japan: $35,951 per person vs South Africa: $6,598.
- Japan's GDP per capita is 5.4 times (445%) higher than South Africa's.
Average income
- Japan: $38,340 vs South Africa: $6,270 average income per person (per capita personal income).
- Japan's average income is 6.1 times (511%) higher than South Africa's.
Official Websites
Japan official website · South Africa official website
Download the Japan vs South Africa Size Comparison Map for free
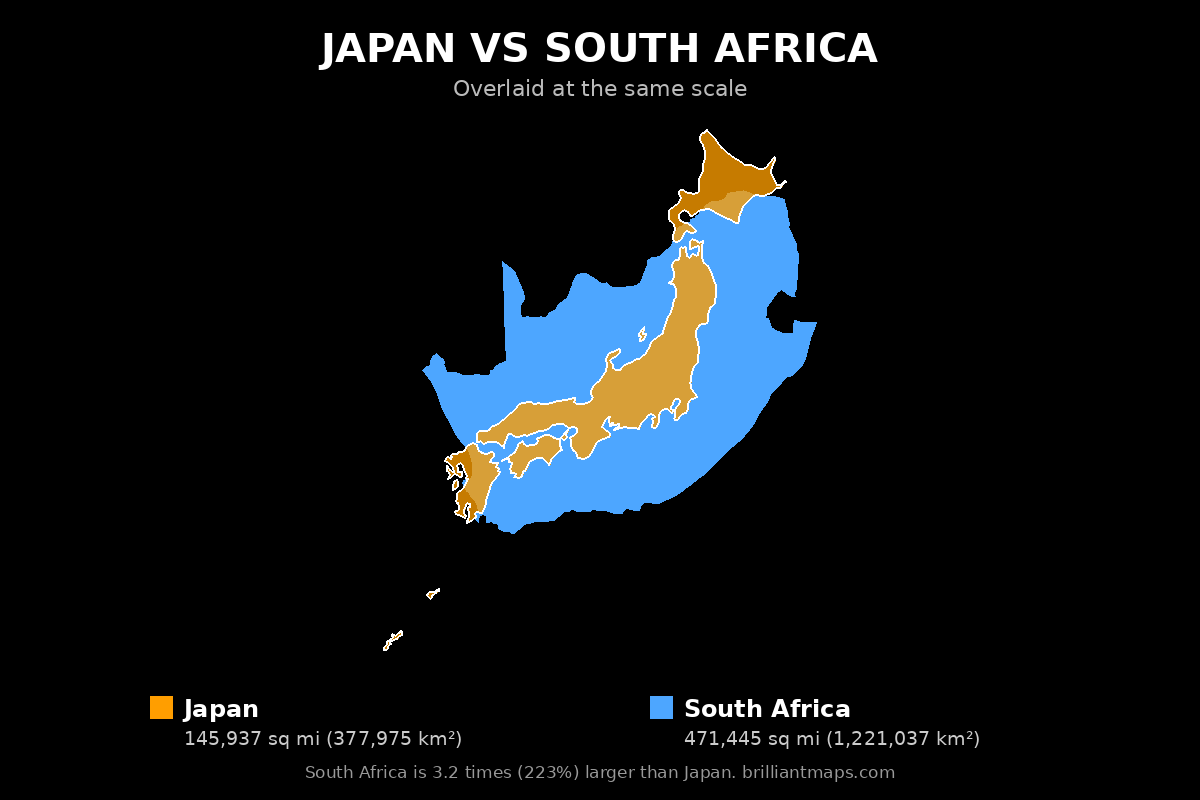
To download the map, right-click the image above (or press and hold on a phone or tablet) and choose Save image as. The map is free to use anywhere, including on your own website or in print, as long as you credit it with a link back to this page or to BrilliantMaps.com.
More Size Comparisons
All Japan size comparisons · All South Africa size comparisons
Area, elevation and boundary figures come from official national statistics and US Census Bureau and Natural Earth boundary data; US state population, economic, county and tax figures come from the US Census Bureau, the Bureau of Economic Analysis and the Tax Foundation. Figures are rounded and for general reference.