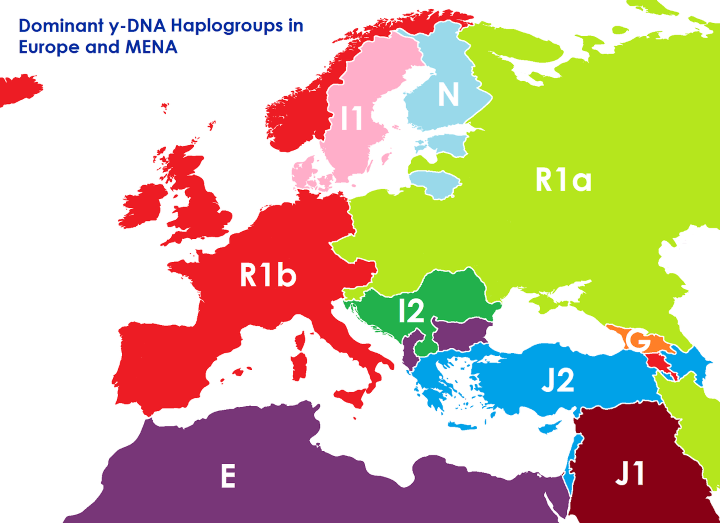
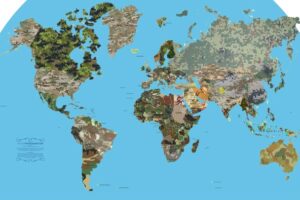
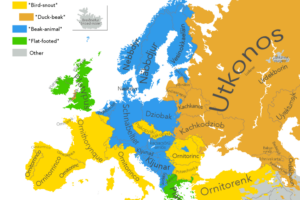
The map above shows what the borders of Europe, the Middle East and North Africa might look like if they were based on the dominant Y-DNA haplogroup rather than ethnicity and/or any other political considerations.
Here’s some very basic information about each group:
- Haplogroup R1b: “It is the most frequently occurring paternal lineage in Western Europe, as well as some parts of Russia (e.g. the Bashkir minority) and Central Africa (e.g. Chad and Cameroon). It is also present at lower frequencies throughout Eastern Europe, Western Asia, as well as parts of North Africa and Central Asia.”
- Haplogroup R1a: “It is distributed in a large region in Eurasia, extending from Scandinavia, Central Europe and southern Siberia to South Asia.”
- Haplogroup N: “It has a wide geographic distribution throughout northern Eurasia, and it also has been observed occasionally in other areas, including Southeast Asia, the Pacific, Southwest Asia and Southern Europe.”
- Haplogroup I1: “The haplogroup reaches its peak frequencies in Sweden (52 percent of males in Västra Götaland County) and western Finland (more than 50 percent in Satakunta province).[6] In terms of national averages, I-M253 is found in 35–38 per cent of Swedish males, 32.8% of Danish males, about 31.5% of Norwegian males and about 28% of Finnish males.”
- Haplogroup I2: “The haplogroup reaches its maximum frequency in the Dinaric Alps in the Balkans, where the men are on record as being the tallest in the world, with a male average height of 185.6 cm (6 ft 1.1 in).”
- Haplogroup J1: “This haplogroup is found today in significant frequencies in many areas in or near the Middle East, and parts of the Caucasus, Sudan and Ethiopia. It is also found in high frequencies in parts of North Africa, Southern Europe, and amongst Jewish groups, especially those with Cohen surnames. It can also be found much less commonly, but still occasionally in significant amounts, throughout Europe and as far east as Central Asia and the Indian Subcontinent.”
- Haplogroup J2: “It is found in Western Asia, Central Asia, South Asia, Europe and North Africa, but it is usually associated with Northwest Asia. It is thought that J2 might have originated between the Caucasus Mountains, Mesopotamia and the Levant.”
- Haplogroup E: “Most members of haplogroup E-M96 belong to one of its identified subclades, and the E-M96(xE-P147, E-M75) is rare. E1a and E-M75 are found almost exclusively in Africa. By looking at the major subclade frequencies, five broad regions of Africa can be defined: East, Central, North, Southern and West. The division can be distinguished by the prevalence of E-V38 in East, Central, Southern and West Africa, E-M78 in East Africa and E-M81 in North Africa.”
- Haplogroup G: “At the level of national populations, G-M201 is most commonly found in Georgia; it is found at even higher levels among many other regional and minority populations in The Caucasus. G-M201 is also widely distributed at low frequencies, among ethnic groups of Europe, South Asia, Central Asia, and North Africa.”
To learn more about DNA and Haplogroups have a look at the following books:
- Genetic Genealogy: The Basics and Beyond
- The Family Tree Guide to DNA Testing and Genetic Genealogy
- DNA Is Not Destiny: The Remarkable, Completely Misunderstood Relationship between You and Your Genes
Also if you’d like to get your DNA tested have a look at:
- AncestryDNA: Genetic Testing – DNA Ancestry Test Kit
- 23andMe DNA Test Ancestry Personal Genetic Service
- Family Tree DNA Genetic Ancestry Test Kit
If you found this map interesting please help by sharing it:
Jurijs Kovzels says
BS. It could make sense if it was drawn without current borders in mind.
FamilyDNA Tree says
A little bit biased I would say….
1. Some HGs are split to deeper levels, R1a & R1b, J1 & J2 while E is left the top parent root, a 55K years old. Instead Bulgaria and Albania should be assigned to EV13, found virtually in Europe, splitting it as R1a vs R1b
2. This is only YDNA, representing only 2% of us, not DNA as whole….
James Spencer says
Why should a map be drawn according to the 1% of genetic material that makes me different from any given stranger? DNA and genes have fallaciously replaced “blood” as the metaphor for essential differences among humans. So, sure, let’s use our knowledge of genetics to fight disease and trace our history, but let’s stop making more of it than it is. Our complexity comes from other stuff.
Amjad Hashem says
That’s the most intelligent response to such an article.
Katya Merezhinsky says
James, I believe, you are the one who assigns any meaning to the article than what it is meant to be. It doesn’t claim that our complexity is based on the genetic composition. It shows what dominating gene is presented by a majority of the population in the given area. It is called ANTHROPOLOGY.
James Spencer says
I was inarticulate about the complexity point. Let me try again.
It’s the article that compared the zones of haplogroup concentrations to political borders. And it’s the visual rendering of the map which simplified the findings to suggest zones of uniformity which don’t exist in reality (as the accompanying stats seem to emphasize). Just as nation-state labels simplify ethnic complexity, so this map does the same with genetic complexity. So, using nation-state borders as a metaphor for zones where certain genetic characteristics are found in a high concentration, coupled with an oversimplified visual is, I would, argue, not very illuminating.
Nevertheless, DNA has become a piece of mental furniture that gets shoved around in media and everyday conversation, standing for essential differences. To my eye, having a map suggesting that there are somehow “unseen” borders, which are really there underneath, just echoes, to mix my metaphors, that fallacy.
If anthropologists and others use detailed information about the flow of genetic material to figure out stuff about our history, about our susceptibility to disease, and other things, that’s great. Comparing it to political borders -not so useful.
TNS says
I find these maps show more the origin of Y haplogroups hundreds, if not thousands, of years ago. Not really relevant to modern political boundaries. This map is more like a historical snapshot in time. Perhaps a more accurate map would show migration patterns of these haplogroups. A video of these migrations and Europe changing colour patterns would be even better.
Gölök Zoltán Buday says
The Y gene never changes, it is actually a 50% majority of your DNA, as an X is compounded genetic memory of several mothers. mother’s mother and even father’s mothers. Oddly enough it is so unpredictable, the X gene, your maternal side cousin could have 1% in common with you and a second cousin 10-25%……not pushing incest, although it may explain those like the Rooseveldts.
Andy leighton says
I think you’re asking a map to show complexity to an impossible level.
It is a fact that R1b, my haplotype, is dominant in Western Europe, more than half the male population carries it with concentrations increasing towards the West..
That fits neatly on a map.
If you want to produce a map showing it’s origin on the Pontic Steppe, the move into Europe in the Bronze age and the origin and spread of it’s various subclades during the Migration Period – best of luck.
Now rinse and repeat for all the other haplotypes.
You’ll end up with a mess.
Be satisfied with the text making it clear that “it’s not that simple”.
Maikati says
Absolute incorrect regarding the Balkans. Haplogroup E has a frequency of 19% in Bulgaria, second highest after I. While Western and Northeastern Europe are quite homogeneous in terms od Y-DNA (R1b and R1a), the same doesn’t apply to the Balkans. There are a pockets where I reaches very high levels (up to 70% in Herzegovina and Montenegro), the rest of the peninsula is quite mixed unlike the rest of Europe.
gluidori4e says
so where does our complexity comes from? for example we have ~96% same genes with chimps and if our difference doesnot come from this 4% than from where?
James Spencer says
Barley, I believe, has more genes than we do, but it’s not more complex.
I’m not a research scientist, but I am married to one : )
She talks to me about epigenetics…Our genes obviously have something to do with it, I would hazard, but the interplay of environment and genetics has a lot do with it, how proteins are expressed and other things beyond my ken, (I’m thinking of the recent rat studies that show effects of maternal stress on development of individuals – maybe Lamarck wasn’t entirely wrong).
In Mindwise, (author’s name escapes me just now) an economist discusses the nature of mind. He cites comparative studies between chimps and young children, showing that for certain tasks the chimps and the children are nearly indistinguishable. But for certain tasks which require co-operation the children are miles ahead of the chimps. Our complexity, perhaps, comes from a combination of our genetics and how we interact…? What’s your take?
Wesley says
We share more than 90% of out DNA with fishes, 1% is a universe of difference.
Emily Elizabeth Windsor-Cragg says
Diversity is okay, and it’s important. Being an anti-Racist and rejecting the idea that people can exhibit profound and fundamental GENETIC differences in their abilities and disabilities is just another way of denying reality. There’s nothing wrong with the fact some people cannot read music and other people are color blind; but everybody can learn to behave decently if that’s the objective and intention embedded in the Teachings with which they are socialized.
Huginn Muninn says
White ( a blanket term for the European tribes) folks have the most diversity of all races.Racism is a human reality. A DNA based construct. Loving or lionizing another race is a form of virtue signaling at social construct.
SevereCheer621 says
Whites do not have the most genetic diversity of the different populational groups. Africans do. There have been a few major out-of-Africa events. In all of these events there was a significant genetic bottleneck for those leaving the continent.
That said, Europeans do have much of the phenotypic diversity.
Bernadette says
Your correct! Those low iq Africans and India should stop complaining abt European colonialism. We are all PEOPLE.. what bigots to believe they’re different from anyone else..
Don says
Shut up you racist son of bitch…
read a book says
yes! we all hunted the mammoth!
African Pride says
You sound like an idiot, f this isn’t sarcasm. I am African and you racists are in no shape, way or form superior in intelligence nor IQ. Whether it is sarcasm or not is actually redundant to me. Your statement reinforces certain racist stereotypes period.
Jonas says
Not very correct map. For example, obviously the person who drew the map took into account recent illegal immigrants in Latvia – Russians, who migrated there during the past 50 years. They are not citizens of Latvia and should not be included, then it would be blue.
TheLittleKnyaz says
Dat butthurt
Hibernia86 says
This isn’t a map of legal citizens. It is a map of people who live in a particular area, which would include illegal immigrants.
Sheila Horseman says
Y DNA! That’s 50% of the population ignored – no change then!
Katya Merezhinsky says
Funny how people read articles. This map describes only what it claims : Average or majority of population with the particular y-DNA. There are many other genetic maps created by geneticists that describe other DNA connections and factors. It is just what it is. For what it is it is pretty accurate.
Egidijus Kup says
99.99% are ignored only circa 300 individuals tested
AAL says
Τypical misrepresentation of data, to the degree that they become unrecognizable. Here are some maps with real distributions http://www.eupedia.com/europe/maps_mtdna_haplogroups.shtml
Katya Merezhinsky says
Actually the map you are referring to is pretty close to the map above! Your map is more detailed
AAL says
That’s the point: it is so crude and oversimplified, that it does not say much…
AAL says
Any particular reason for deleting my link to more detailed maps? Using one color per region is in fact misleading. I urge anyone interested interested in real data to search “Distribution maps of mitochondrial haplogroups in Europe, the Middle East and North Africa”. Let us hope this will not be deleted.
Neth M. Köpke says
My Paternal Haplogroup is Haplogroup I1 (Y-DNA). Although my family was from Pommern in Prussia.
Northern Germany and Norway should be part of the I1.
Katya Merezhinsky says
This map doesn’t claim to be 100% correct for every single case. It is a generalization that describes the majority of that population, or draws the average. There are going to be many exceptions.
Mehmet Han says
Mine R1b1b2a which part of the world?
Wesley says
So modern Jews are Caucasian, so the Khazar theories is once again proved true by genetics studies.
bongo says
A map showing the distribution of J1 with high concentrations in modern day Israel and not in the Caucus region.
bongo says
Looks like you’ve even distorted a single paragraph on this page: “Middle East, and parts of the Caucasus, Sudan and Ethiopia. It is also found in high frequencies in parts of North Africa, Southern Europe, and amongst Jewish groups, especially those with Cohen surnames. ” What was the first one again? Oh yeah, “Middle East”.
Hannes Coetzee says
This map is BS as Sardania, Sicily, Spain etc has a lot of mixed blood from other areas.
Musso says
Sardinia is the genetically most isolated place in Europa.
David says
Wrong. Italy has the most mixed blood in Europe with less R1B than most European nations. Spain’s mixture is concentrated in the south. You don’t know R1B.
Juan the Biscayne says
Wrong. Spain: 69% R1b R-M269 (Andalusia: 65%). England: 69%. Scotland: 72%. I’m sure you see no admixture when it comes to the South African Boers (some 5% of Khoisanid, Hotentot, East Indian, Indian, West African and East African ancestry, plus a lot of Provençal surnames due to the Huguenot exile). Calvinism makes you white.
I couldn’t care less about Spain being 100% North African -that’s what you mean with ‘admixture’- , but Spain genetically happens to be a run-of-the-mill Western European country. Get over it, gammons, WASPs and Germanoid mutts.
Paul Hosse says
They (incorrectly) claim that the E Haplogoup is North African. The Balkans (especially Greece) are mostly E-V13, which is a seperate branch all together.
brenyoung says
Only men represented.
Hibernia86 says
That’s the nature of Y chromosome tracking.
Małgorzata Świątek says
East Germany should show R1a
killaria says
Fuck you. Bulgaria and Albania look like part of Africa. Are u kidding me???
Amador Rivas says
Fake map with anti-bulgarian propaganda……Are you crazy to post map from reddit ? People there are rude and this supposed to be horrible racist joke from macedonian…. delete this or change the map….Next time don’t post fake stuff and look up the bulgarian dna in different sites , NOT reddit…..
Egidijus Kup says
totally agree
SevereCheer621 says
There is nothing anti-Bulgarian about E-V13. It’s one of the oldest European haplogroups there is & one of the most truly European. It’s been in Europe circa 10,000 years. Indeed, the V13 mutation may very well have occurred on site in Bulgaria or anywhere from the Pannonian Basin down to Greece. E-V13 is literally found everywhere in Europe, even in Finland & Ireland. It is one of the most successful haplotypes on the European continent. This map isn’t even right. E1b1b (dominated by the V13 clade) is the most common haplotype in mainland Greece, not J2.
Vasil Hristov says
The map is WRONG.
BULGARIA’s dominant Hp is I2 at
27.5% according to “Karachanak 2009”,
22% according to “Karachanak 2013” and
34% according to “Begoña Martinez-Cruz2012”.
The Greek dominant is Hp E at 20.8% compared to 16.9% J (Firasat2007), but it varries according to regions.
Norway’s dominant Hp is I1 at 37% (FTDNA – 906 people tested) compared to 24% R1b and 25% R1a.
Huginn Muninn says
They left out K1 …Otzi the mummified ice man was of this Hp….and R1a is the most aggressive Hp…but the connections with Indians, Arabs.etc., is problematic….you cannot have a modern Nordic have 6he same DNA as a n Indian…GTFO impossible ALL of Europe would be DARK…..black hair, dark skin, and dark eyes…..this new science is full of NWO propaganda
SevereCheer621 says
It’s worth noting that this map is not really accurate. Mainland Greece is more E1b1b than J2. Greece as a whole is quite equally represented by both of these haplos (however, most of the studies I’ve seen give E a slight edge). The Greek Isles anyhow are heavily J (Crete, etc.). By the time you’ve gotten to the mainland though, that is to say virtually anywhere on the mainland, E1b1b (dominated by the V13 clade) is predominant.
Sandro Bilbeisi says
This map was made by a racist fool !||
Farhan says
Italy has tons of J2 and in certain regions it’s over 20% including places in the north not just the south. Spain also has enough J2 in south to render this map extremely misleading. As pointed out Greece is not dominated by J2 the way this map would have you believe.
David says
Italy has the most mixed blood in Europe and doesn’t possess as much R1B as the rest of Europe.
Interesting to note that Spain and England share the most R1B in Europe.
David says
Italy has the most J2 in Europe while Spain has the most R1B. Actually Greece is dominated by J2 according to research.
Gift Economy says
R1a is almost identic to R1b! Thus, no need for borders in Europe! R1a is almost as frequant in I2 region as in Russia… no need to create illusion of Serbs/Russians division!
John says
Very interesting the comments about Spain. The fact is that spain has the highest concentration of Rb1 in Europe along with the British Isles, with areas close to 90% and with about 70% as an average for the whole country: http://www.scs.illinois.edu/~mcdonald/WorldHaplogroupsMaps.pdf
anon says
Iran should be J2 (Blue)
Rashid says
The term “MENA” is flawed and not used by us MIddle Easterners. For one, the Middle East is not a continent. The Middle East is a transcontinental region that is situated on the intersection of Africa, Asia and Europe. It Begins with Egypt in North Africa and ends with Iran in West Asia. It’s a geopolitical region which means its territory is strictly based on shared Politics, shared History and shared demographic. If you are gonna make an article like this I would sugest you to use names of continents rather than geopolitical regions. Also “West Asia” is not just the countries you have mentioned. West Asia literally includes the majority of the Middle Eastern countries. The Sinai peninsula, the Levant, Arabian peninsula, Iraq, all of them are in West Asia. Why are there so much confusion when it comes to regions, continents etc?
alex says
map is not fully correct
DisgustingFatbody says
Its a coloring book map from reddit
Glad you noticed its ‘not correct’
alex says
https://upload.wikimedia.org/wikipedia/commons/4/4d/Haplogroups_europe.png
ML says
what if the city you come from is on the border, i.e., venice Italy. It seems that would be R1b, but it also looks like it could be R1a. So would it be R1A
Antranig bedrossian says
There are errors in the map in South Caucasus region.
Nagorno-karabakh is Armenian inhabited historically Armenian territory, now de facto independent, does not belong to Azerbaijani Turkish group, but to Armenian ethnic group.
Yordan Yanakiev says
That’s perfectly retarded.
For instance in Bulgaria the haplogroup “E” (not clear one) is 17-23% which is dominant toward the next 2 of the top 3 haplogroups which vary in between 13 to 22% I2 and R1a.
And compared to North Africa where the numbers is as follows : “E” (clear one) is 46 to 83, R1a is 0 to 2 and I2 is 0..
– PLEASE TELL ME THE SIMILARITIES ?!
That’s stunningly retarded map drawn by a person who clearly have no idea what he is doing.
LL says
Greek nationalist racist propaganda map. Because they don’t want people to look at them as being more genetically related to Africans. So they shifted that to their enemies the Bulgarians. Goofy.
LL says
I take that back. It seems like the Y haplogroup percentages over at the EUpedia has changed considerably for Greece and Bulgaria since last I checked. Has any other source done that as well? I am still suspicious. It wasn’t like these countries had very small samplings before.
Lienna says
Where’s haplogroup H? I thought it was the most common in Europe?!
Ivanov says
Dig a bit further before you post this bullshit
Dr Wilton McDonald says
For all those hardcore scientists- who subscribe to a planet of millions of years why in Christ’s name is the closest genetic match to mankind is the common garden variety pig?? Should it not be an ape/ monkey? All haplogroups need to be re-defined to conform to a Judeo Christian timeline of 6,000 to 7,000 years starting with ADAM the first created man who was black. Neanderthals never existed. Again if they did why cant you use a monkey’s or ape’s heart in a human?