
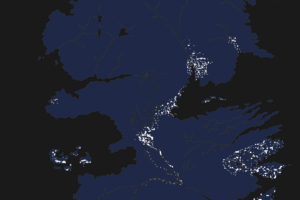
This remarkable map was developed by the Natural Sounds and Night Skies Division of the U.S. National Park Service.
It shows the distribution of the loudness of natural sounds (sounds that would be heard if human influence were taken out of the picture).
Natural sounds
Natural sounds are many and varied. Some such as the sound of running water, the wind rustling through the leaves and falling rain provide a steady background of noise. On top of this are sharper and more intermittent sounds made by birds, insects, amphibians and mammals.
Although the natural world is generally peaceful some of its sounds can be remarkably loud, such as the deafening trill of chorus frogs or the piercing whine of cicadas.
Distribution
The map shows that natural sound levels are linked to topography. The loudest are found in wetter areas with more vegetation, flowing water and many birds, insects and amphibians, such as the Mississippi Valley and South Florida.
By contrast, mountainous areas and deserts that are relatively devoid of life are much quieter.
Measurement of sound
Sound is normally measured in decibels (dB). A decibel is one-tenth of a bel, a unit named for Alexander Graham Bell, the inventor of the telephone.
Decibels measure the intensity of the pressure wave created by the sound relative to a normal or standard pressure. The decibel scale is logarithmic so that a 10 dB increase corresponds to a tenfold increase in sound energy.
The actual measure used for this map is the A-weighed decibel (dBA), which is intended to account for the relative loudness perceived by the human ear, which is less sensitive to low audio frequencies. Clearly sound levels are not constant so the median dBA is used, which is to say the sound level that sits in the middle so that it is less than the actual sound level half the time and greater than the actual sound level for the other half.
On the map this is indicated by the notation L50 SPL, which refers to the median (50th percentile) sound pressure level (SPL). A dBA of zero indicates the threshold of normal human hearing while rustling leaves might have a dBA of 20, a babbling brook 40, regular conversation 60, an alarm clock 80, a rock band 110 and a jet engine at take-off 140.
How the map was constructed
The basis for the map is a series of sound level measurements taken by the National Park Service in national parks across the U.S.
These were supplemented by additional measurements obtained in urban and rural areas across the country. In all 479 locations were sampled, many for 25 days or more in order to capture a range of activities and weather conditions.
In addition some sites were sampled for more than one season, generating a total of 966 observations. Of course the actual measurements included sounds from many non-natural sources.
These non-natural sources were then filtered out, leaving only physiographical sources of sound like wind, flowing water, precipitation, animals, and geological events. The results of these observations were then used to develop a model that related sound levels to a range of variables such as climate, topography, vegetation, etc.
This model could then be used to estimate natural sound levels across the country based on the distribution of these variables.
The importance of preserving natural sounds
The National Parks Service views the preservation of natural sound as an important part of the park visitor experience as well as being a key contributor to the health of the parks’ ecosystems.
Additionally, there are laws and policies in place that require the agency to conserve acoustic environments “unimpaired for the enjoyment of future generations.”
Contrast with the map of existing conditions
The contrast between the map of existing conditions and the map of natural conditions is quite striking. As expected the distribution of existing sound levels closely matches the pattern of built-up areas, many of which exhibit dBA levels that are at least 10 points (i.e. 10 times) higher than the highest natural readings.
To learn more about sound and noise, the following books may be of interest:
- The Science of Sound, 3rd Edition
- The Sound Book: The Science of the Sonic Wonders of the World
- Sound: An Acoulogical Treatise
- Noise: A Human History of Sound and Listening
If you enjoyed this post, please help us by sharing it:


Leave a Reply